


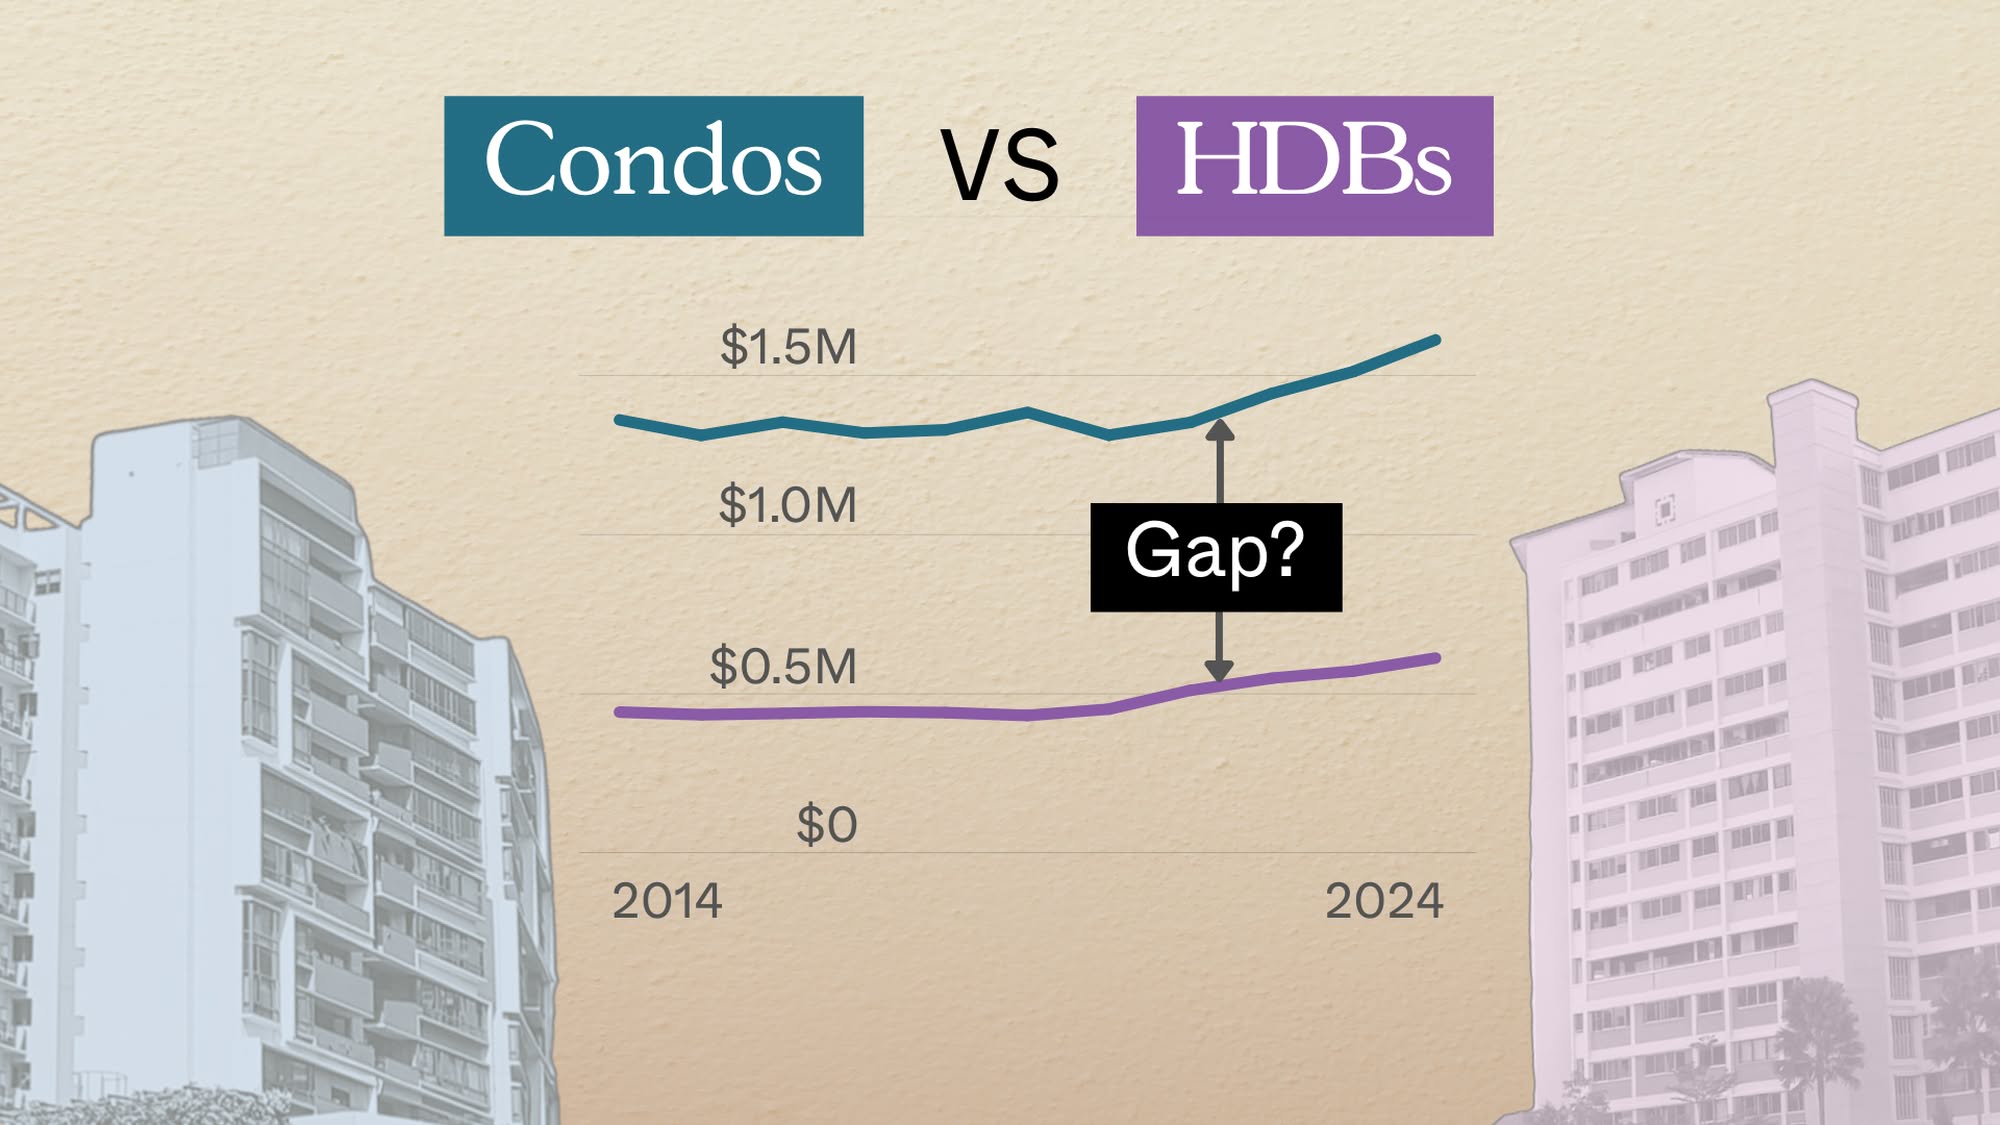
One of the most common questions we get is “Should I buy freehold instead of leasehold?” It’s a constant point of concern, although not one that’s easy to answer: property prices move for many different reasons besides the lease (or lack thereof). Nonetheless, an update is in order – so we’ve taken a look at the price movements of both since 2014. Here’s what we can see so far:
*Note: For this article, we will consider 999-year leases to be effectively similar to freehold.
Broad trend pieces like this are useful for setting expectations, but they can't tell you whether those trends apply to your estate, your unit type, or the price range you're actually considering.
That's often the hardest part of a property decision: working out what the broader market means for the specific home you're thinking of buying or selling.
Over time, that's also why we decided to work with agents who shared the same data-driven and advisory-led approach behind our editorial, consultants who could help readers think through decisions more objectively, rather than simply push transactions.
Today, the team has worked with more than 2,000 clients across over $5B in property transactions.
Let’s look at freehold versus leasehold price movements, from 2014 to 2024
Here’s a general snapshot, based on unit sizes. This is based on all types of sale transactions (e.g., new to resale, resale to resale, and so forth).
We have, however, excluded new-to-resale transactions for Executive Condominiums (ECs). This is because ECs are sold at subsidised prices, so these transactions would distort the overall picture.
| Type | Volume | ROI (%) | Average Gains ($) | Annualised (%) |
| 1BR FH | 1429 | 9.0% | $70,244 | 1.83% |
| 1BR LH | 4060 | 14.4% | $99,126 | 2.69% |
| 2BR FH | 2097 | 18.0% | $235,897 | 3.62% |
| 2BR LH | 7127 | 19.5% | $195,001 | 3.65% |
| 3BR FH | 2397 | 25.1% | $427,449 | 4.42% |
| 3BR LH | 6644 | 24.3% | $310,685 | 4.59% |
| 4BR FH | 565 | 23.8% | $757,036 | 4.56% |
| 4BR LH | 1615 | 24.5% | $402,006 | 4.61% |
| 5BR FH | 34 | 23.3% | $1,328,208 | 3.65% |
| 5BR LH | 185 | 26.9% | $515,488 | 4.92% |
| Average | 26093 | 20.2% | $255,855 | 3.8% |

Very small and very big leasehold units stood out the most, in overall comparisons.
For one-bedders, leasehold outperformed their leasehold counterparts with higher ROI, gains, and annualised returns.
For two, three, and four-bedders, the results were quite close. Across these size categories, leasehold units tended to slightly outperform freehold, in terms of ROI and annualised percentage gains. However, the freehold counterparts tended to see higher absolute gains.
For five-bedders, leasehold decisively outperformed freehold in annualised percentage gains. Once again, however, freehold saw bigger absolute gains. Do note that at these sizes, though, units from the luxury segment start to fall into the mix; these units can be quite volatile, showing very high absolute gains or losses.
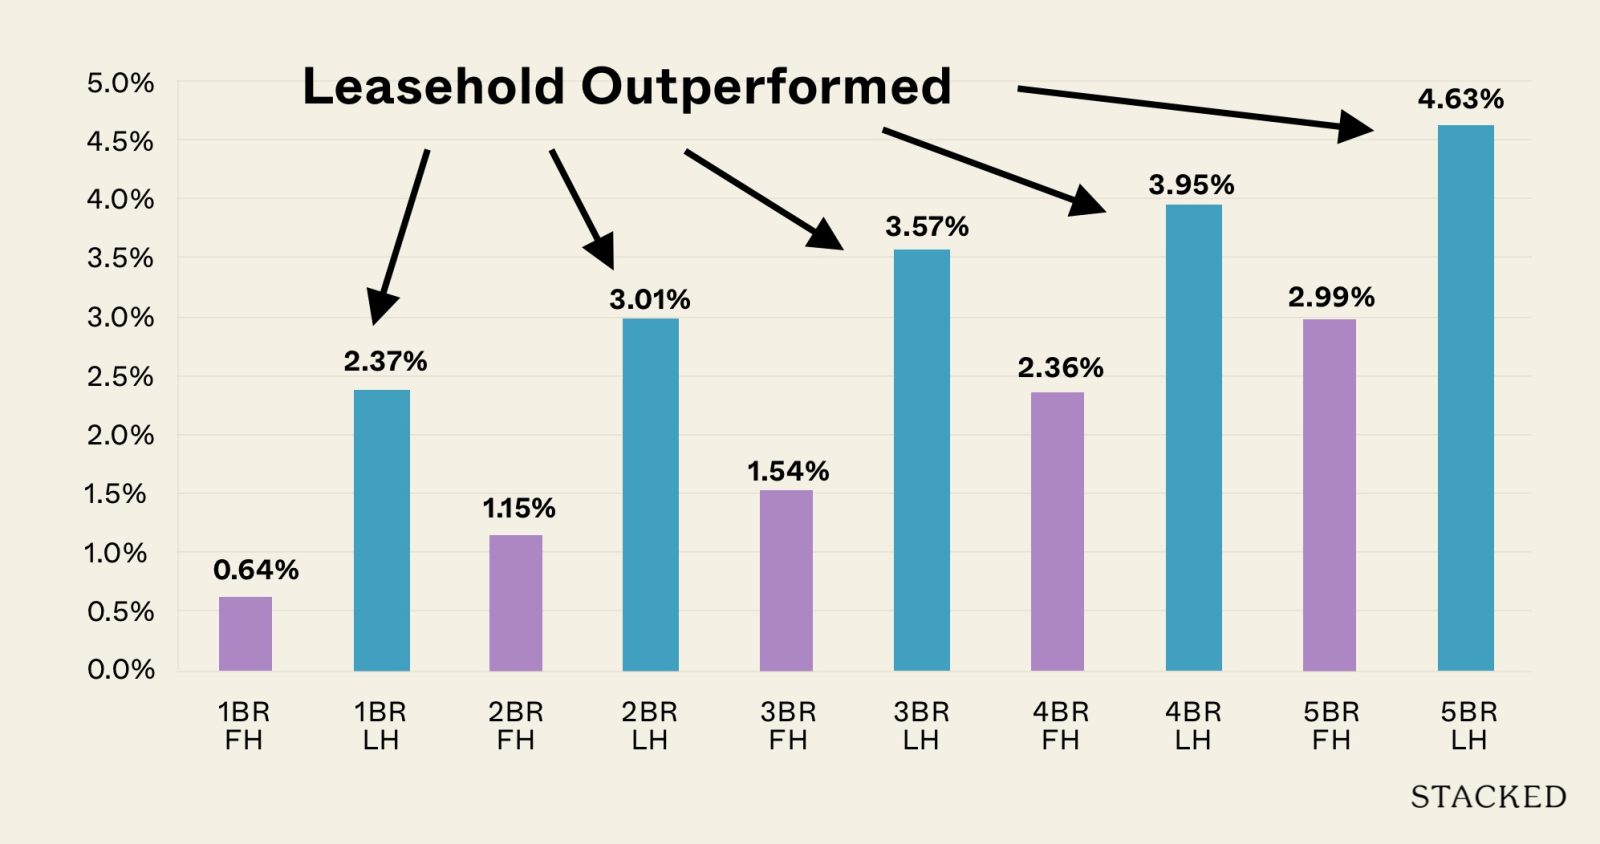
Next, let’s focus on how buyers of new launches fared, in terms of leasehold versus freehold
| Type | Volume | ROI (%) | Average Gains ($) | Annualised (%) |
| 1BR FH | 322 | 4.7% | $34,027 | 0.64% |
| 1BR LH | 1881 | 15.8% | $107,035 | 2.37% |
| 2BR FH | 425 | 8.3% | $105,671 | 1.15% |
| 2BR LH | 2992 | 20.1% | $196,370 | 3.01% |
| 3BR FH | 315 | 10.8% | $200,226 | 1.54% |
| 3BR LH | 2300 | 23.6% | $311,413 | 3.57% |
| 4BR FH | 85 | 14.9% | $512,281 | 2.36% |
| 4BR LH | 710 | 24.9% | $387,300 | 3.95% |
| 5BR FH | 7 | 29.9% | $3,047,714 | 2.99% |
| 5BR LH | 102 | 30.2% | $571,574 | 4.63% |
| Average | 9143 | 19.1% | $221,850 | 2.88% |

Overall, new launch leasehold beat new launch freehold across all size categories, in terms of ROI and annualised returns. Freehold showed especial weakness in the one and two-bedder categories: their ROI could be less than half of leasehold counterparts, with yields of below 1.2 per cent.
Freehold did pull ahead in terms of absolute gains, for larger four-room and five-room units. However, the volume of five-bedder transactions is very low (just seven), which makes us hesitant to draw any strong conclusions.
This is due to the natural traits of mass-market, fringe-region condos.
Many of the larger condo plots are leasehold and in the OCR. A mass-market condo in the OCR has the advantage of a lower initial price, which provides room for price growth. There’s also the freehold premium to consider, which further raises the base price of freehold properties.
Now let’s look at resale transactions:
| Type | Volume | ROI (%) | Average Gains ($) | Annualised (%) |
| 1BR FH | 1020 | 10.8% | $84,335 | 2.29% |
| 1BR LH | 974 | 11.8% | $81,093 | 2.71% |
| 2BR FH | 1529 | 21.3% | $278,666 | 4.38% |
| 2BR LH | 2145 | 19.9% | $195,990 | 4.13% |
| 3BR FH | 1980 | 27.9% | $470,111 | 4.93% |
| 3BR LH | 3106 | 25.8% | $305,185 | 5.15% |
| 4BR FH | 451 | 25.9% | $802,441 | 4.97% |
| 4BR LH | 640 | 25.3% | $419,984 | 5.06% |
| 5BR FH | 25 | 21.7% | $911,523 | 3.71% |
| 5BR LH | 27 | 18.6% | $350,359 | 4.53% |
| Average | 11898 | 22.0% | $298,962 | 4.37% |

A clear shift emerges when we focus solely on resale transactions. In this segment, where older properties come into play and price discovery has already occurred, the gap between leasehold and freehold shrinks considerably.
Notice that freehold units overtake leasehold in absolute gains in two and three-bedders, while annualised returns between leasehold and freehold can be as slim as 0.2 to 0.3 per cent.
When we break look at new launch vs. resale, and further by unit size, a pattern emerges:
The stronger performance of leasehold units could be less about tenure itself, and more about issues like location, affordability, and unit mix.
As mentioned above, leasehold condos dominate the OCR, where land is cheaper and there’s a lower base price. Conversely, freehold properties are more likely to be small boutique projects, or found in pricier CCR and RCR land plots, which leave less room for gains.
When we break down the various segments by tenure, this becomes quite clear:
| Type | Volume | ROI (%) | Average Gains ($) | Annualised (%) |
| FH CCR | 1614 | 19.1% | $467,152 | 4.0% |
| FH OCR | 1581 | 25.8% | $328,527 | 4.8% |
| FH RCR | 1890 | 22.1% | $312,851 | 4.1% |
| LH CCR | 592 | 10.5% | $186,497 | 2.2% |
| LH OCR | 4704 | 24.1% | $248,602 | 4.9% |
| LH RCR | 1625 | 19.7% | $280,215 | 4.0% |
| Average | 12006 | 22.1% | $299,838 | 4.4% |

Leasehold OCR units were the top for annualised returns, in line with the reasons mentioned. We can also see the OCR outperformed the CCR in general, reinforcing that affordability and mass market appeal – perhaps more so than tenure- drive stronger percentage returns.
Notice that the weakest performance was leasehold in the CCR: a double disadvantage of high initial prices, plus a contrast effect (psychologically, a leasehold project surrounded by freehold counterparts may be unappealing to buyers.)
Finally, in terms of volume, there are just a lot more leasehold transactions in the OCR. So, due to the sheer volume, it carries a greater weight; but if we compare leasehold to freehold in the OCR, the performance is not that different.
The conclusion is that leasehold has generally outperformed, but not for the reasons we may think
It’s really more about lower land and sale prices allowing for more price appreciation, and the volume of leasehold transactions that we see in the OCR. These factors weigh more than whether a property is leasehold or freehold, and it’s something for investors to keep in mind.
For more on the Singapore property market, follow us on Stacked.
Broad trends like this are useful for setting expectations, but they rarely tell you whether the pattern applies to your estate, your unit type, or the price band you’re actually shopping in.
If you’d like to discuss how this applies to your own circumstances, you can reach out for a one-to-one consultation here.
And if you simply have a question or want to share a thought, feel free to write to us at stories@stackedhomes.com. We read every message.


1 Comments
“Hi there Ryan, thanks for the insightful analysis and your excellent articles which i’ve been following on Stackedhomes.
Could you help to elaborate more on the number of transactions used in each analysis?
Originally we started off with 26k transactions, but this was later split to new launch(9k) and resale (11.9k) transactions. Which meant somehow that around 5k transactions were missed out somehow. And in your final analysis on the regions; OCR,CCR,RCR, only 12k transactions were used in the analysis, but i couldnt tell from the article whether this was a smaller subset of transactions because you were analysing a specific type of transaction.
Do hope you can help to answer these questions as I find the article really insightful and would like to know more about how the numbers came together to validate the insights.”