


The Property Assumptions Singapore Buyers Still Believe In 2026 — And What The Numbers Actually Show

Singaporean property buyers tend to overgeneralise parts of the housing market. Some examples include: “Queenstown is a cheaper alternative if you need a centrally located home”, or “Residential neighbourhoods in the West are the cheapest place to buy condos in Singapore”.
But there is often a tendency to take these generalisations too literally, and that perspective can limit some of the other possibilities out there. It also means that the exceptions (and there are plenty to pick when it comes to real estate) will catch you off-guard.
This doesn’t just apply to buyers in the market, it also influences the liquidity that sellers can face when they prepare to sell their asset. Over the years, we’ve seen how buying preferences and preferred neighbourhoods can change over the years. If you don’t keep up with these trends, there’s a chance you may be relying on outdated assumptions when you plan a sale or purchase.
But over the past few months, we’ve taken a deep dive into several planning areas on Stacked Pro. We’ve examined transaction data, buyer profiles, pricing trends, and the different sub-locations within popular planning areas.
Several findings stood out as we come to the end of this series of articles, and the findings challenged some of the common assumptions regarding these towns. Here are six points that surprised us.
Past performance is a useful signal, but it's not a forecast. The projects that outperformed over the last cycle aren't guaranteed to do so again, and the reasons they outperformed may no longer apply.
The more useful question is whether a particular property still makes sense at today's price, given your budget, objectives and timeline. That's where many buyers find it helpful to get a second opinion.
Over time, that's also why we decided to work with agents who shared the same data-driven and advisory-led approach behind our editorial, consultants who could help readers think through decisions more objectively, rather than simply push transactions.
Today, the team has worked with more than 2,000 clients across over $5B in property transactions.
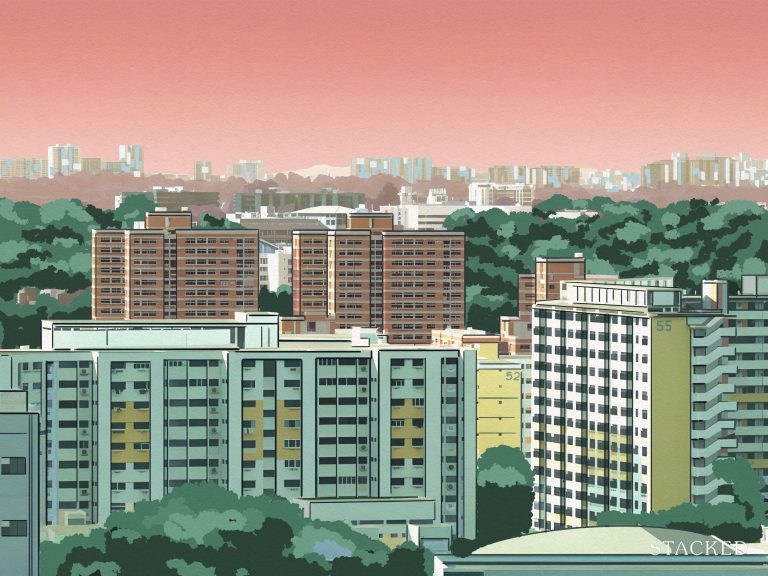
1. Queenstown isn’t that much cheaper compared to the Central Region anymore
In the 2000s and 2010s, there was a perception among some buyers that Queenstown offered the best “affordable alternative” for buyers looking for homes near the city centre.
Buyers who couldn’t justify, or afford, the prices that most private homes in the city centre – also known as the Core Central Region (CCR) – often turned to Queenstown as the next-best alternative.
But our analysis suggests by the end of 2025, that distinction may be fading.In our Stacked Pro deep dive, we found that between 2015 and 2025, Queenstown’s average resale and sub-sale prices rose from $1,205 psf to $2,020 psf.
This means that average condo resale prices in Queenstown now sit almost level with the average price of resale condos in Bukit Merah, which commands an average price of approximately $2,000 psf mark.
The rate of price growth also reflects this trend. Prices in the broader Central Region rose about 3.54% over the past decade, whereas the price growth in Queenstown outpaced this at an annualised rate of 5.3% growth over the same period.
Looking back to 2015, we can see that average condo prices in Queenstown were about 17% below the average price of private homes in the Central Region. By the end of last year, the price gap had shrunk to a mere 1.5%.
At this rate, Queenstown may no longer be the “cheaper alternative” to Central Region homes.
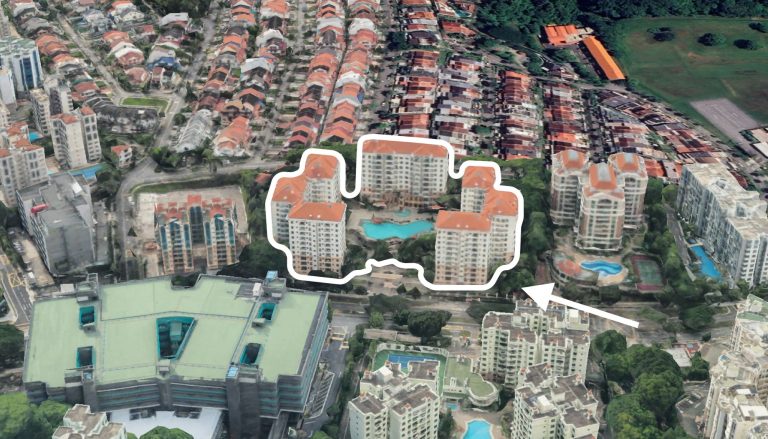
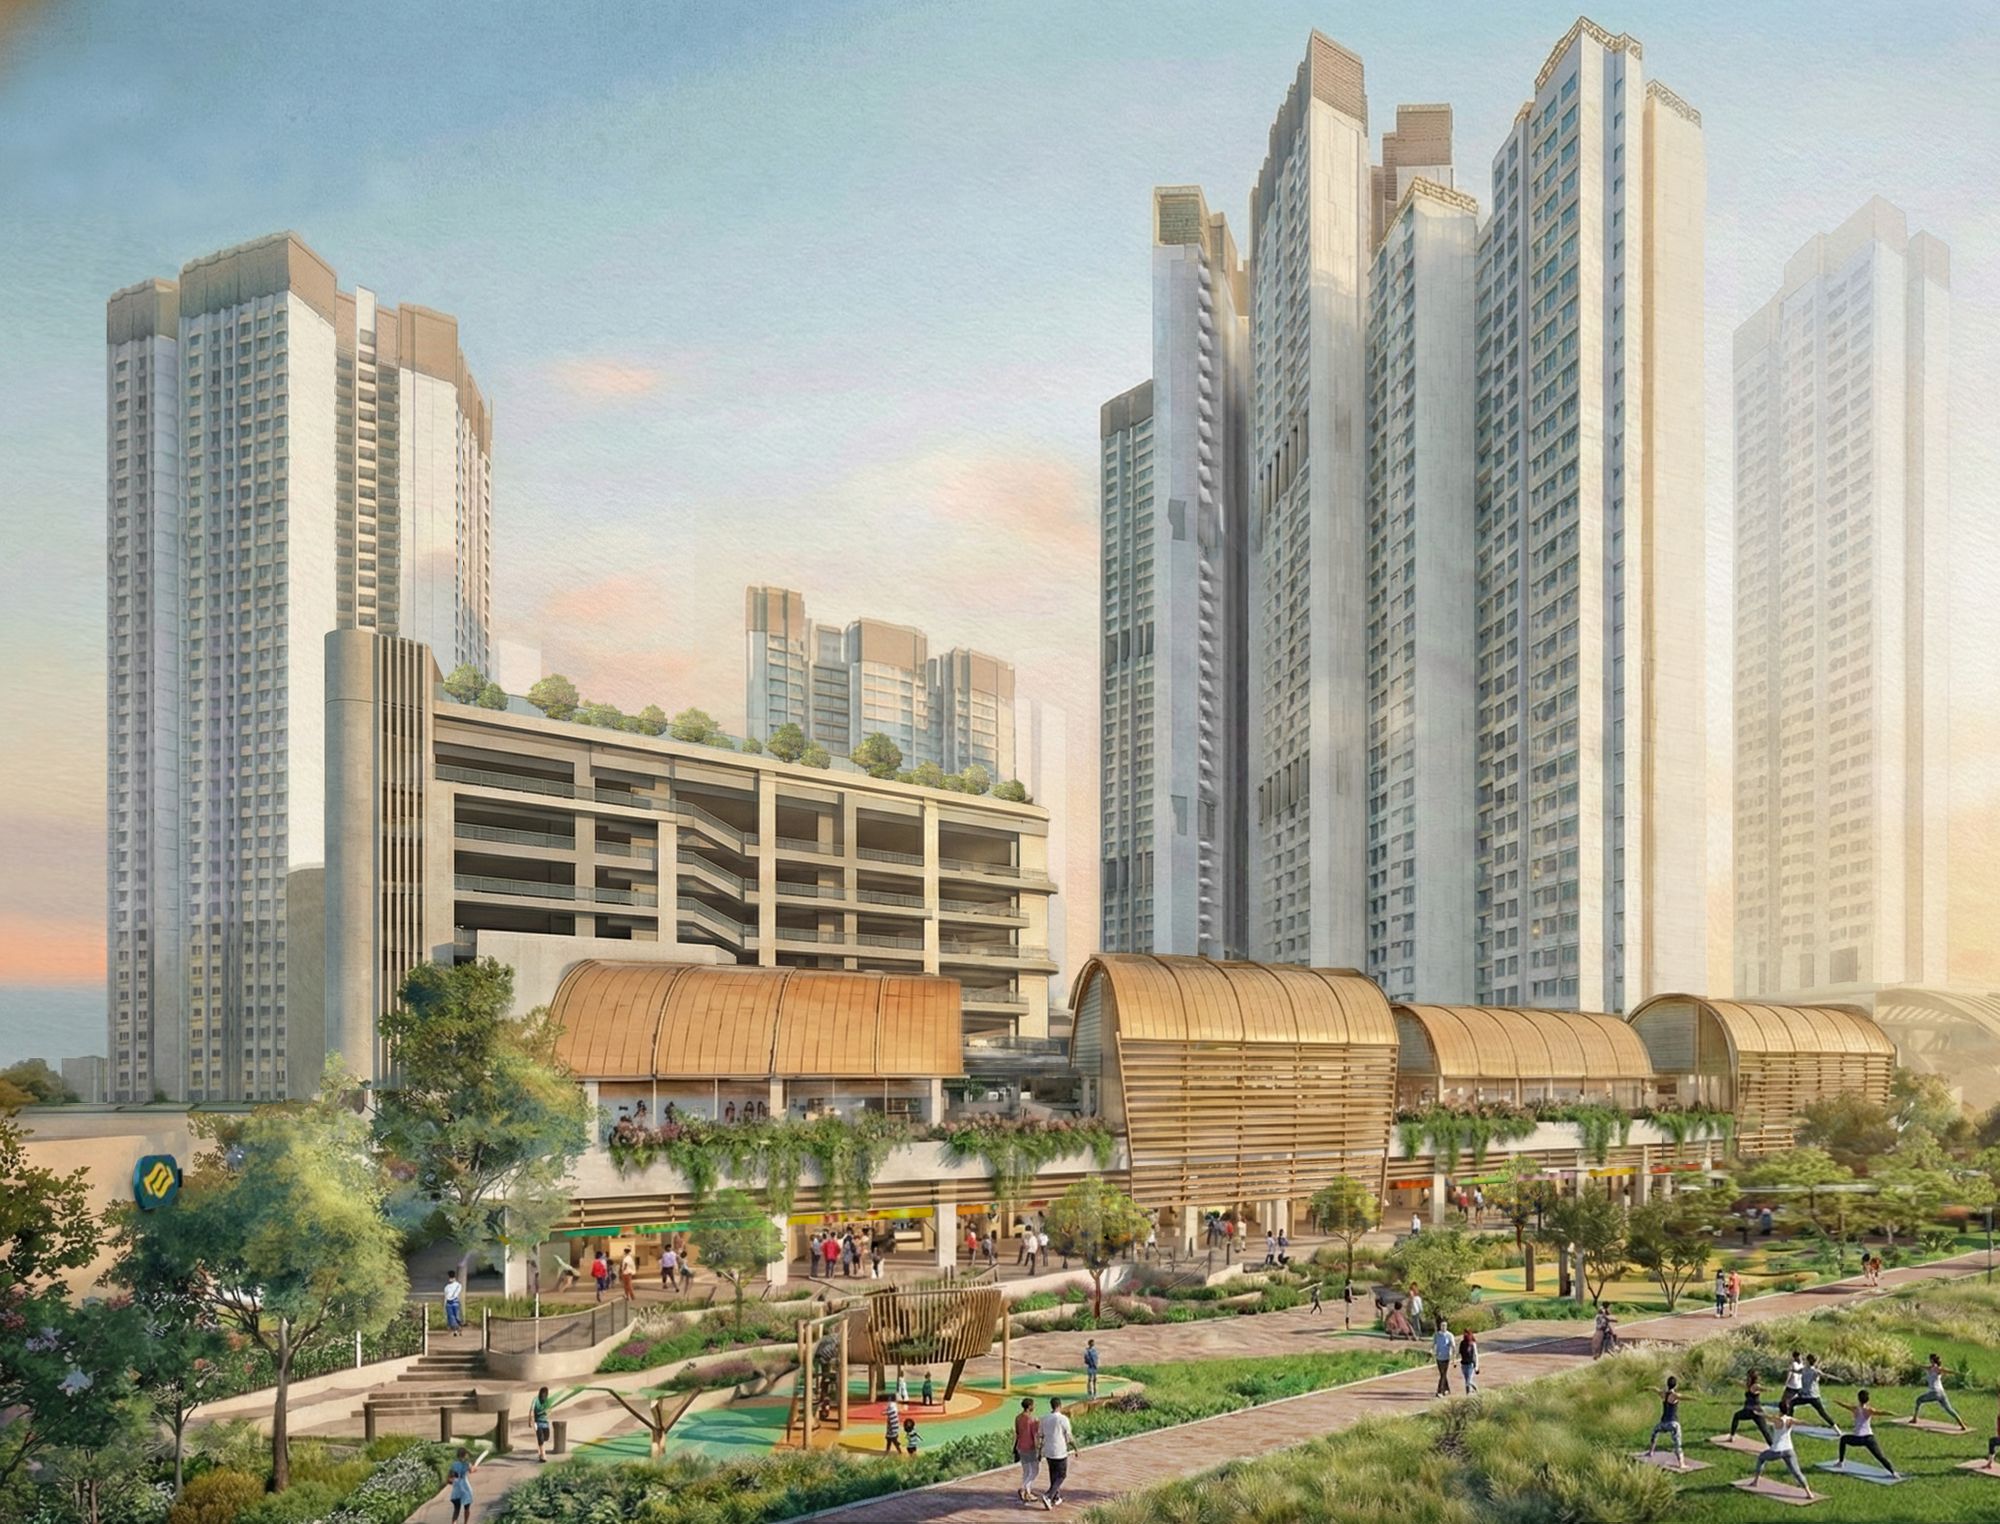
This is attributed to the continued development of the one-north precinct. After the initial phase, which saw the development of business parks, high-technology clusters, and new media industries, the residential market there has taken shape.
Coupled with the various employment clusters, and a growing catchment of retail and community amenities, the one-north precinct is the key driver behind the Queenstown planning area’s overall growth.
Moreover, there is a healthy upgrader market in Queenstown, and most buyers pick the area for more than its proximity to key clusters and competitive prices. There is genuine demand for homes there and this has supported healthy resale transactions by upgraders, who would prefer not to move to another town.
2. Geylang quietly outperformed much of the Central Region
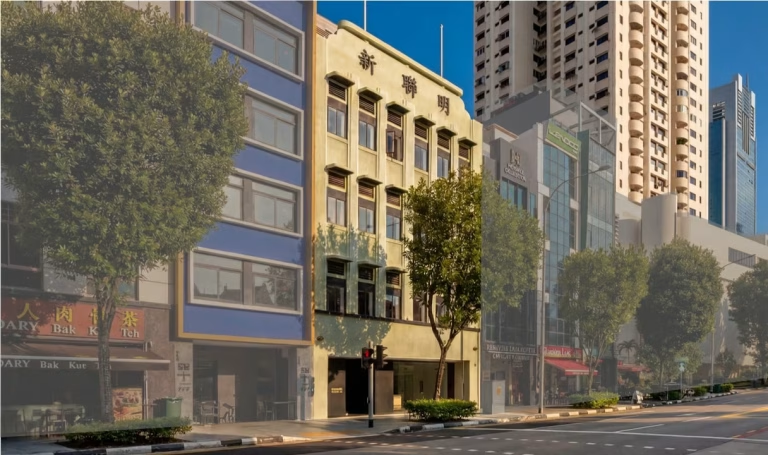
In terms of planning areas in Singapore, Geylang may be one of the more complex and unique zones so far.
While the area is highly accessible and centrally located, there is an underlying association that the area is tied to dense traffic, underdeveloped shophouses, vice activities, and low-cost rental options.
But Geylang is a lot more than its flamboyant reputation. In fact we found that over the past decade, Geylang has quietly been one of the strongest-performing planning areas in the Central Region.
Average resale and sub-sale prices rose from $1,126 psf in 2015 to $1,852 psf in 2025, representing annualised growth of 5.1%. As mentioned in the previous section, the Central Region grew only 3.54% over this same period.
We’d also add that Singapore’s non-landed residential market grew from $1,197 psf to $1,756 psf from 2015 to 2025, which represents an annualised rate of 3.91%. This means that the housing market in Geylang outperformed both of them.
The residential market in Geylang not only outperformed both market benchmarks, but also narrowed the gap with the rest of the Central Region. In 2015, Geylang transacted at about 78% of the Central Region average. By 2025, it had reached around 90% of the Central Region average.
In 2015, buyers paid almost 29% more on average for a Central Region condo compared to one in Geylang. By 2025, that premium had fallen to just 11%.
The main reason is that, whatever its underlying reputation, Geylang has exceptional accessibility. It has strong MRT connectivity, proximity to the city centre, and highly resilient rental demand. It helps that all of this comes at a relatively lower entry price for properties there compared to most parts of the Central Region, although that price gap is narrowing.
Another factor is that the Geylang planning area comprises several distinct neighbourhoods, and the profile of the area can change dramatically after you traverse a few streets.
For example, Paya Lebar is a high-end commercial hub anchored by Paya Lebar Quarter (PLQ), drawing office workers and young professionals. Dakota behaves almost like a premium residential enclave, with waterfront condos and proximity to Kong Hwa School. Aljunied, meanwhile, appeals to buyers seeking affordable city-fringe entry points, whilst Mattar and MacPherson are quieter residential environments.
This diverse make-up is found almost nowhere else in Singapore. It also means Geylang, as a planning area, has a subtle advantage: it isn’t dependent on a single buyer demographic.
Housing demand there stems from multiple groups of buyers, such as tenants, families, investors, and HDB upgraders. This is how the housing market in Geylang has remained stubbornly resilient across different market cycles.
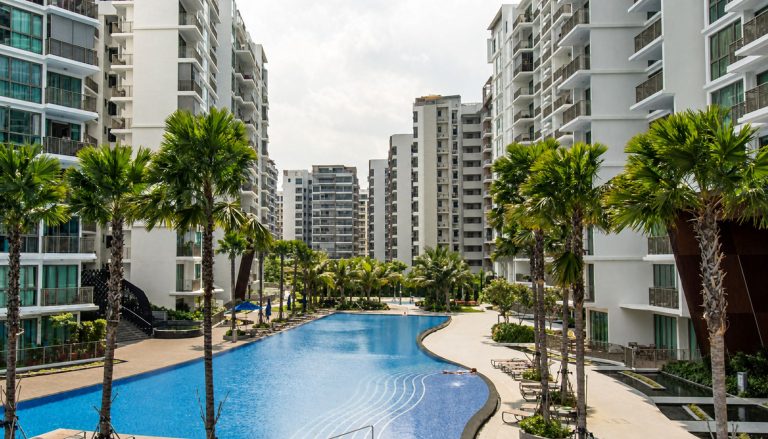
3. Price growth in Bukit Batok, Bukit Panjang, and Choa Chu Kang exceed expectations
The residential areas in the West are often perceived as Singapore’s affordable markets, and this is still true in a broad sense. However, what may surprise you is the pace at which prices have climbed here.
In our deep dive, we found that the residential areas in the West Region recorded annualised price growth of 5.47% over the past decade, which made it the strongest performer among all five geographic regions in Singapore.
We looked specifically at Bukit Batok, Bukit Panjang, and Choa Chu Kang, which have the stronger association with having relatively affordable private housing markets. Especially since Clementi and Jurong East have a strong association with pricier private home markets.
Between 2015 and 2025, average resale and sub-sale prices in these planning areas (Bukit Batok, Bukit Panjang, and Choa Chu Kang) rose from:
- Bukit Batok: $911 psf to $1,504 psf, or 5.14% annualised
- Bukit Panjang: $949 psf to $1,541 psf, or 4.97% annualised
- Choa Chu Kang: $783 psf to $1,327 psf, or 5.41% annualised
All three outpaced the residential non-landed market, which clocked an annualised price growth of 3.91% over the same period.
Choa Chu Kang was especially interesting because it started from the lowest base, but saw the strongest growth among the three areas. In 2015, the average price of condos in Choa Chu Kang was about 35% below the overall non-landed residential market. By 2025, that gap had narrowed to around 24%.
To be clear, the transaction data compiled by Stacked still suggest that Choa Chu Kang is one of the most affordable areas for buyers looking to move into the condo market, especially for larger homes. But what some buyers may consider to be a subdued or “sleepy” town has actually been an impressive generator of capital returns.

Another interesting trend is how buyer profiles have shifted across each of these planning areas.
In 2020, almost 68% of private home buyers in Choa Chu Kang were HDB upgraders, while only about 32% were existing private property owners. By 2025, the split had become almost even, with HDB upgraders at 49% and existing private owners making up the remaining 51% of buyers.
Bukit Batok and Bukit Panjang show a similar shift in buying trends. By 2025, existing private owners made up around 55% of buyers in Bukit Batok and 61% in Bukit Panjang.
This suggests that these three towns have a wider appeal among a range of buyers with different housing budgets. Someone who has the sale proceeds from a condo, for instance, could be expected to find affordable options in the pricier areas like Clementi or Jurong East. But some are clearly choosing Bukit Batok, Bukit Panjang, and Choa Chu Kang.
This is a sign that these neighbourhoods have grown beyond “fallback” locations, and are on the right track towards developing into established private housing markets of their own.
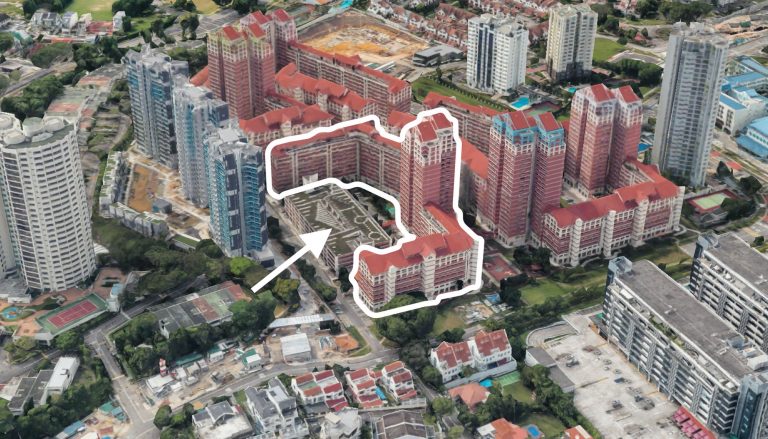
4. River Valley has emerged as the desirable entry price point among the prime areas
We often describe River Valley alongside other prime areas with trophy homes, such as Orchard Road, Tanglin, or Nassim Road. But the residential market in the River Valley area has evolved into something a little bit different.
In our Stacked Pro deep dive, we found that average resale and sub-sale prices in River Valley rose from $1,567 psf in 2015 to $2,543 psf in 2025, which represents an annualised growth rate of about 4.96%.
While this is still more expensive than the average price of condos in the Central Region, which stood at $2,051 psf, it remains below the average price of $3,024 psf for condos in Orchard Road.
Put another way, buyers paid roughly 47% more on average for a luxury home in the Orchard Road area compared to a luxury home in River Valley. Although both areas are part of the prime residential belt in this part of the central region, there is a significant price gap.

This is mostly attributed to transaction quantums. Across River Valley, many resale two-bedroom units continue to transact around the $2 million mark. It is far from cheap but it is also the lowest entry price point for buyers looking for a private residential property in this prime region.
The conclusion from most of the deep-dives in this series reveals that property prices that are listed for around $2 million are still within the upper limits of affordability for some upgraders. The River Valley area also has a much stronger residential character, and this is particularly true of the Great World area which we cover in detail here, compared to the Orchard Road shopping belt.
As a result, River Valley is not simply a cheaper version of Orchard Road, and the planning area has its own identity and appeal that can continue to draw buyers even if prices rise.
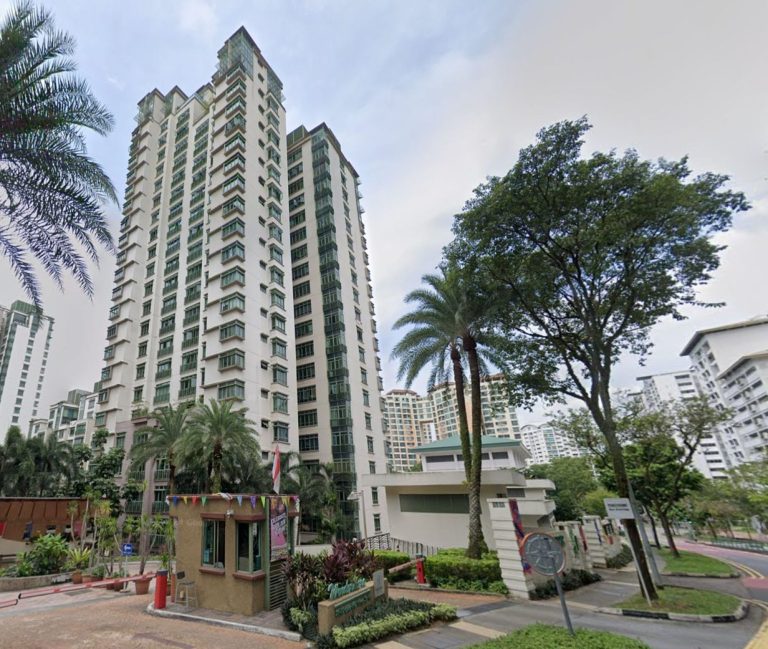
5. Condos in Newton may not be as pricey as you expect (in context)
Usually, when buyers think of Newton, they tend to place it in the same prime residential category as Orchard Road, Tanglin, and Bukit Timah. But our look at the numbers suggest it may not be quite as expensive, at least in Central Region terms.
To be clear, Newton still commands a high average price of $2,644 psf in 2025, which is still comfortably above the Central Region average of $2,051 psf. However, it is significantly below some of the resale prices exhibited in parts of Orchard Road and River Valley.
In our examination of the River Valley area, average resale and sub-sale prices reached $2,864 psf by 2025, while parts of Orchard Road were already transacting for well above the $3,000 psf mark.
In Newton, we found that many two-bedroom resale units were going for between $1.8 million to $2 million, while some older three-bedroom units fetched prices that were less than the price of some newer two-bedders in Orchard Road and River Valley.
We think that the private housing market in Newton is unlike most of the luxury neighbourhoods that surround it. The area’s convenience and public transport accessibility are favourable attributes compared to Orchard Road which has a stronger luxury profile and lifestyle focus.
Newton’s perceived characterisation can sometimes work in favour of buyers, who benefit from properties that are located in a highly central location, multiple MRT connections, and easy access to Orchard Road. But without the price premiums attached to some neighbouring districts.
As a result, Newton offers many of the advantages that come with living in a prime central area, while being more affordable compared to some of the ultra-luxury enclaves in the vicinity.
If there’s one takeaway from these deep dives, it’s that broad labels like “prime” and “affordable”, or average town prices, can be misleading.
The biggest opportunities, and sometimes the biggest risks, tend to emerge when you over-generalise a planning area. This is why we do more detailed studies on Stacked Pro, and drill down deeper into sub-locations and specific projects.
If you’d like access to the full story behind the findings above, consider subscribing to Stacked Pro.
Historical performance is a useful signal, but it isn’t a forecast. The conditions that drove strong returns in one cycle aren’t always present in the next.
That’s why the more useful question is whether a specific property still represents the right purchase at today’s price, not simply whether it performed well in the past.
If you’d like to discuss how this applies to your own circumstances, you can reach out for a one-to-one consultation here.
And if you simply have a question or want to share a thought, feel free to write to us at stories@stackedhomes.com. We read every message.

0 Comments