


There’s an old saying that the funniest joke in investment markets is the phrase: ‘This time it’s different’.
Now that’s only partially true, because there are differences in market cycles but there’s no denying certain historical patterns. One of those, with regard to Singapore’s property market, is the way prices tend to rise even higher than the last peak on the back of most global crisis (for reference, we wrote about it here).
Global instability and volatility tend to result in investors flock to the safety of Singapore’s real estate market, grounded by the city state’s position as a global safe haven market – I did suspect we are seeing something similar in 2026.
What I didn’t expect, however, was the degree at which high net-worth capital is flowing into Singapore.
One reason is that global wealth is still being created at a rapid pace, a trend that has gone largely under-reported. Knight Frank’s Wealth Outlook 2026 shows that at the broadest level, the increase in global wealth creation increased 32.9% between 2021 and 2026.
Over the same period, the Asia Pacific region saw a 24.8% increase in the number of Ultra-High Net-Worth (UHNW) individuals, largely due to the spike in valuations of AI and AI-related industries. At present, the Asia Pacific accounts for around a third (31%) of the world’s UHNW population.
In Singapore, the UHNW population grew from 7,171 in 2021 to around 10,496 this year, while the number of billionaires living here more than doubled from 28 to 63. This should give you a sense of just how much capital and money is typically parked here.
News pieces like this explain what's happening in the market. Our consultations are designed to help you understand what it means for your own property decisions.
If you're considering buying, selling or upgrading, we'd be happy to help you work through your options.
This backdrop might explain why property investments aren’t only growing, they may just be getting warmed up.
Knight Frank’s data on total investment sales by sector shows that the property market recorded a $40.5 billion worth of deals last year. In fact, 2025 was the strongest figure in terms of property investment in the past decade, ahead of the $35.5 billion lodged during the peak of the last enbloc cycle in 2017.
With the Covid-19 pandemic, as we saw in previous crises, the same pattern in capital flows followed: a momentary dip followed by a sharp bounce back. Property investment fell to $24.4 billion in 2020 – the height to the pandemic – before rebounding to $29.2 billion in 2024, and then hitting its historic level last year.
As for 2026, well, we’re still only in mid-April as I write this, but the report already shows sales volumes to date amount to $16.7 billion. If the current pace continues, we may not see a drop from 2025, despite ongoing geopolitical concerns.
However, most of that investment capital is pivoting away from residential assets
This is likely due to the 60% ABSD on foreigners buying residential property in Sigapore. It’s certainly one of the reasons why we’re seeing Singaporeans and Permanent Residents pick up more properties in the Core Central Region (CCR). Several prime location properties last year were targeted at locals, not foreigners. In that sense, at least, things are a little bit different this time.
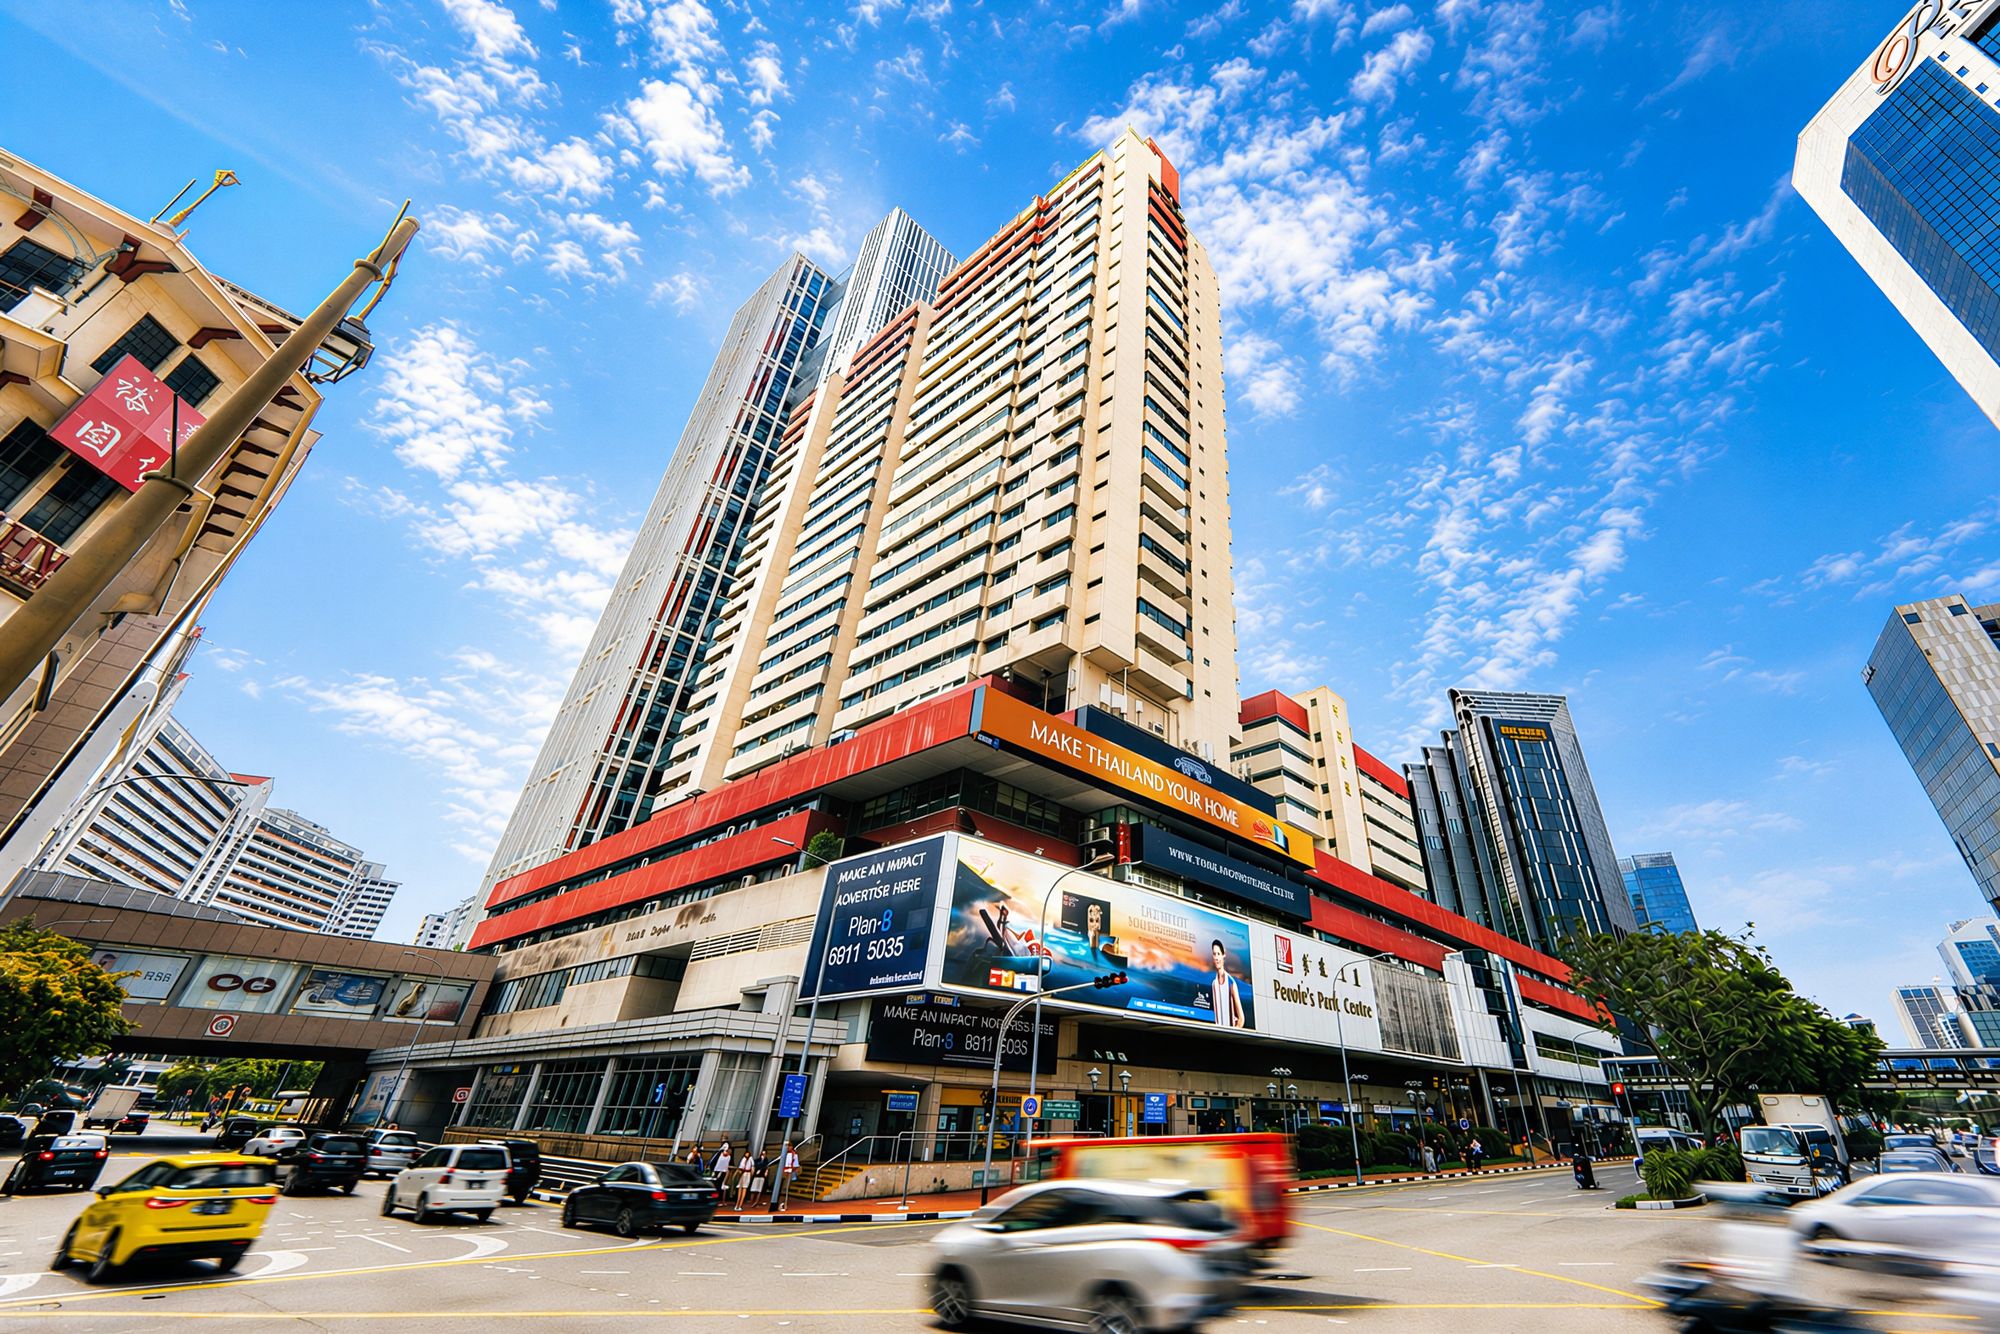
Once acquisition costs for residential property become high enough – as they are now for foreigners or buyers of additional homes – commercial assets start to look much more attractive. Besides the absence of a high ABSD, adding commercial assets to an existing property portfolio provides diversification, and a more varied stream of rental income. Knight Frank cited 21 Collyer Quay as an example, and we may now see some wealthy buyers prefer trophy commercial assets over ultra-lux homes.
In effect, the higher ABSD hasn’t driven capital away, so much as funnelled it more into the commercial segment of the property market. This may not be without consequence: purely as a matter of opinion, I think it may be time for authorities to check the full impact this trend may have on local businesses. The spate of closures in F&B, and the recent prices of coffee shops, and rising rent is often cited as a push factor for many business owners.
Rising rental rates could stem from landlords paying ever-higher acquisition prices for assets, then seeking returns that justify the purchase price. If that’s the case, then some of the wealth flowing into Singapore property may eventually be felt in the kopi you buy downstairs.
But as far as prime residential properties go, other cities in APAC are seeing even worse price spikes.
For example, Tokyo saw new-build (i.e. new launch) price growth of 58.5% over the past 12 months, far ahead of Singapore’s 7.9%. Knight Frank cited strong domestic demand plus foreign buying and investment interest, buoyed by a relatively weak yen, as the cause.
Other Asia Pacific cities that saw spikes include Manila at 17.5%, Seoul at 14.7%, and Mumbai at 8.7%. In comparison, property price growth in Singapore appears modest. It may not feel that way when looking at the growing $PSF trends, or how new launches can now fetch over $1.8 million for a new two-bedder, but prices could have been worse if it wasn’t for the higher ABSD, and the government ramping up supply via Government Land Sales.
As an interesting aside, some of the major cities in our region that saw prices dip for prime properties was Hong Kong, which slipped by 2.1% y-o-y. This is due to the continued – but recovering – effects from China’s property downturn, which started about five years ago. This has some bearing on Singapore’s residential property scene: due to ABSD rates, and the fact that Hong Kong’s prices have dipped while ours rose, there’s a possibility that some investors may eye Hong Kong as an alternative again. But this requires confidence that China’s property market will rebound soon.
That said, our homes are shrinking
Knight Frank’s prime residential property index (PIRI) casts light on how much prime space US$1 million buys you in different cities and is an indicator of the overall performance of the luxury residential market is different gateway cities.
Between 2020 and 2025, the buying power of US$1 million shrank sharply across the globe. We saw the biggest impacts on markets like Dubai, which fell 66%, and Tokyo slipping 41%. In Singapore, that US$1 million bought around 387.5 sq ft of prime residential space in 2020. But this had shrunk to approx 301 sq ft by 2025.
This reflects how developers here are generally building smaller-sized units, to compensate for higher $PSF prices in the residential market. Given that sales have been brisk, especially in the primary market, it suggests that this is still palatable to most buyers. Going forward you can expect to see more “low quantum, high $PSF” pricing approaches by developers.
I also had some questions from readers this week.
“Should I buy my first resale HDB flat now, or wait for prices to drop further?”
I take it this is a reference to how resale flat prices dipped last quarter, for the first time in seven years. But while resale flat prices do look set to moderate, one important question is what type of resale flat you’re considering.
Certain types of flats, such as those in highly desirable mature estates, DBSS flats, and very new five-year old flats, tend to behave very differently compared to market headlines about the property market. As I mentioned in the linked newsletter, some of these flat types have seen prices continue to rise.
Going by the same data, I also ponder what “cheaper” properties may actually look like given prevailing market conditions and price benchmarks. To be blunt: the recent dip in resale HDB prices was only 0.1% quarter-on-quarter. It’s not notable because flats got a lot cheaper, it’s notable simply because it was the first decline in seven years. Which, incidentally, clues us in on how often flat prices drop. The answer is “not very.”
There are more flats reaching MOP and being built. But what we’re more likely to see is slower price growth on average; I’d say a huge drop in resale flat prices is a bit much to expect.
I would be cautious about trying to time the market for discounts, even now. Waiting is not free: there’s no guarantee that you won’t end up paying more, even if the price increase is slower than it would have been previously.
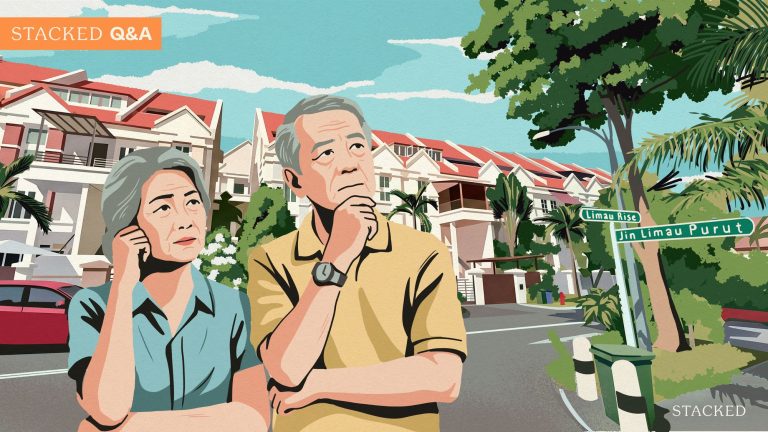
“My wife and I currently split time between my parents’ home – where there is more space but less privacy – and a family-owned 500 sq ft studio apartment in the CBD.
We were considering applying for a BTO flat once she gets PR status, but we’re concerned about the income ceiling, waiting time, and whether the flat size would suit us. We’ve also thought about just renting continuously, especially since we may need to care for one of my parents in future.
We have no loans, combined income of around $16,000 to $17,000, and may sell the studio first before deciding. Longer term, we may retire early or move overseas once family obligations change. Given all this, should we buy, rent, wait, or do something else?”
Unfortunately, the income ceiling for BTO flats, as of now, is $14,000 per month. As such, you’ll likely have to look in the resale market instead. You can write in to HDB to appeal based on your circumstances but on paper, you’re past the income cap.
As an aside, note that if you sell a private property, there are waiting periods before you can buy a flat. This is 15 months for a resale flat (unless you’re 55 and buying a four-room or smaller flat). For this reason, it’s important to note whose name the private studio apartment is under, in the event it gets sold.
That said, the answer to this boils down to how soon you expect those major life changes. If you expect to continue staying in Singapore for the next 10+ years, then buying your own home can make more sense than continuously paying rent. On the other hand, if you expect the changes to come much sooner, then renting allows you to maintain flexibility. Do remember that flats come with a five-year MOP as an added restriction (10 years for Prime and Plus flats).
I’d also suggest conferring with your parents on the future plans for their property, before making your decision. If, for example, they intend to sell their property for their retirement, that might necessitate you having to secure your own home anyway; possibly one big enough for extended family.
Meanwhile, in other property news:
- Check out the property market statistics for the first three months of this year, from offices to retail to homes here.
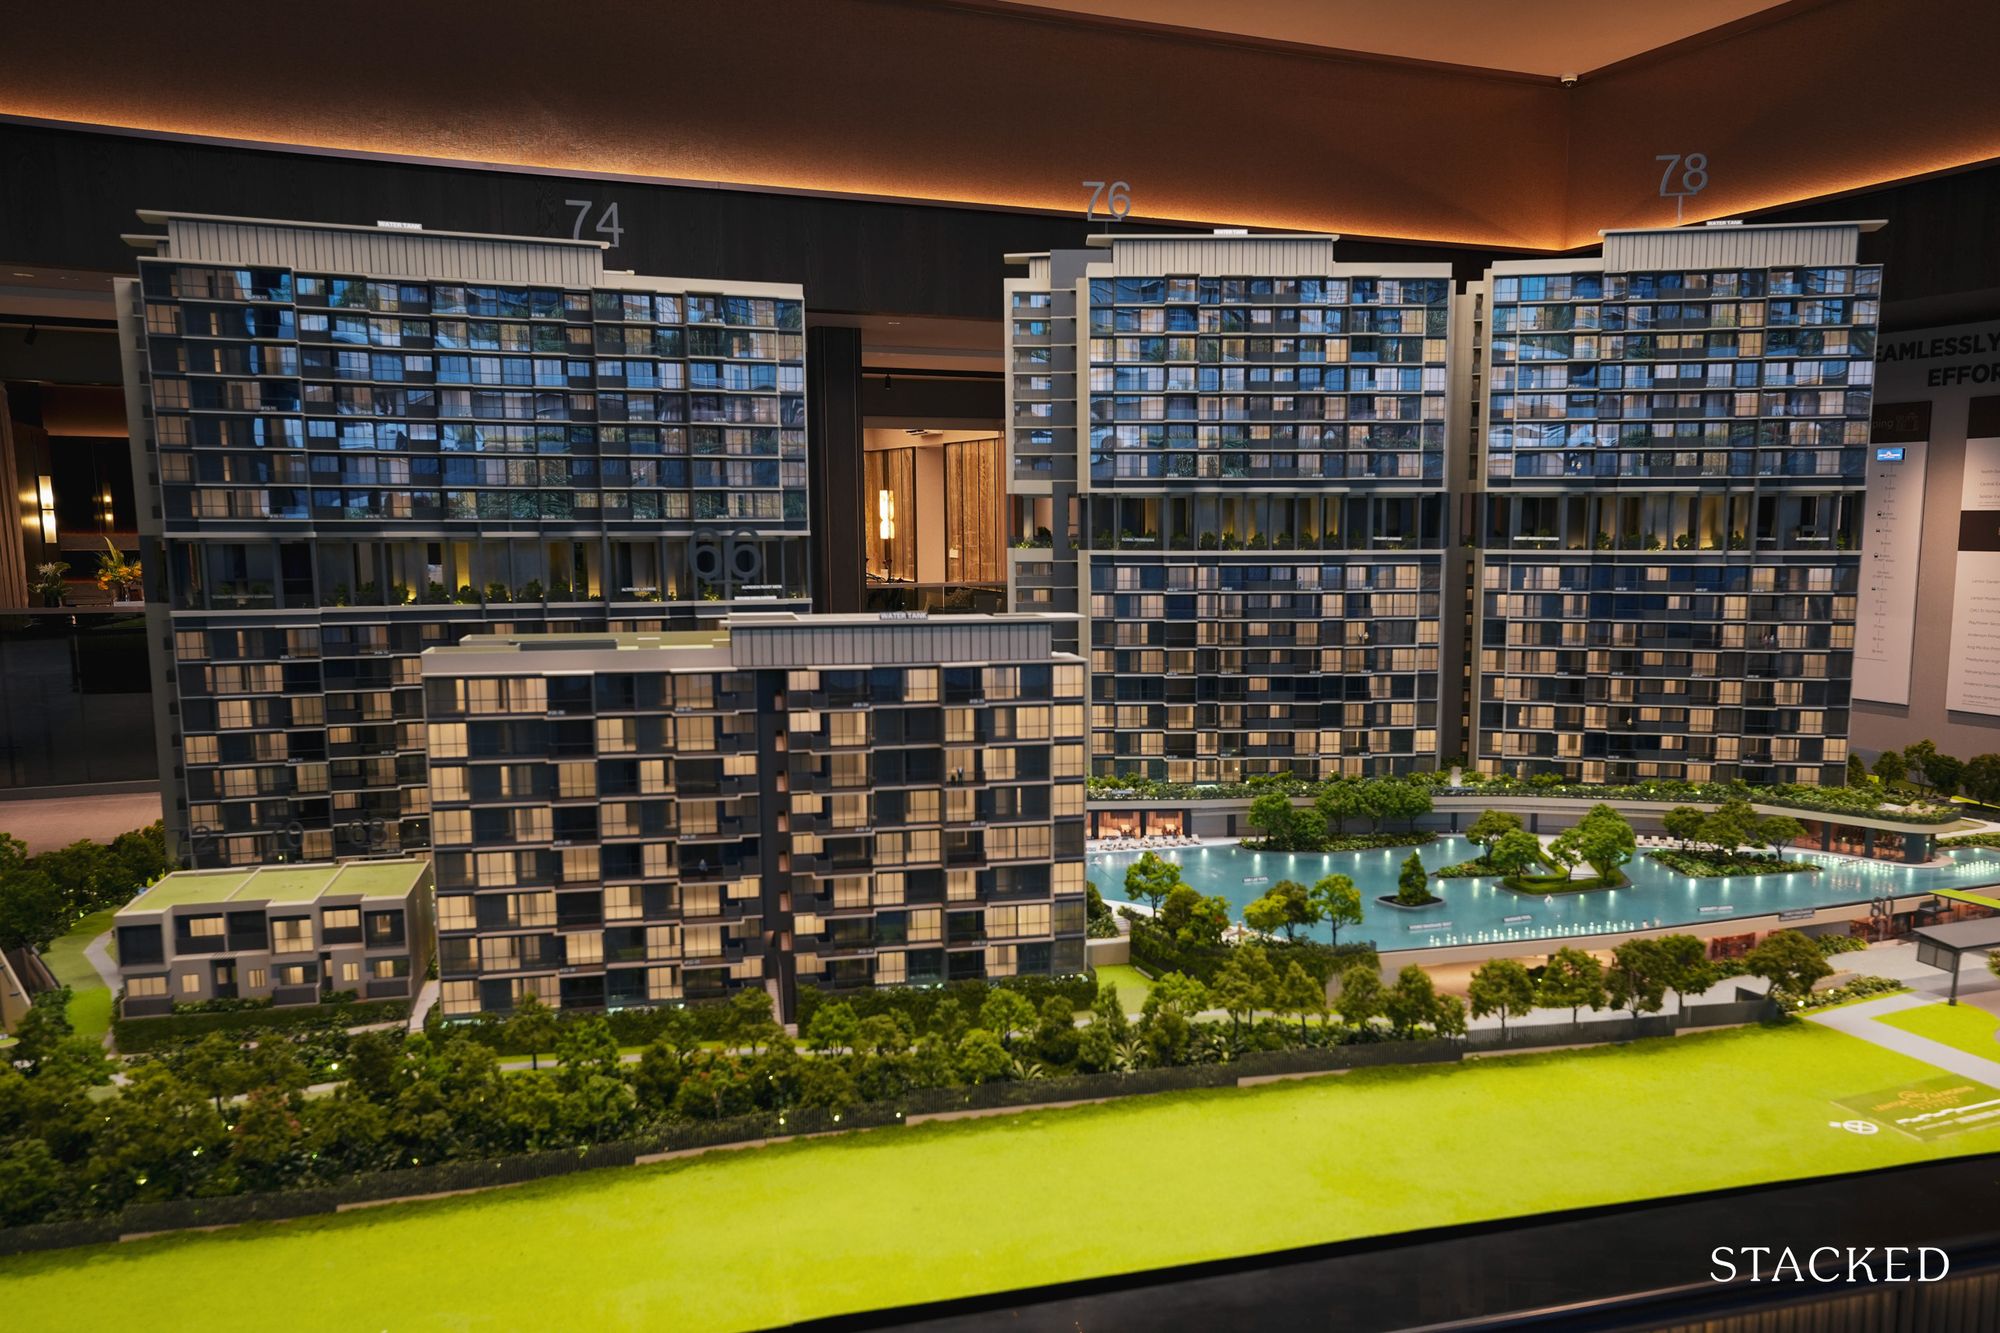
- What can you expect from Vela Bay, the first new launch in the upcoming Bayshore estate? Check out the details here.
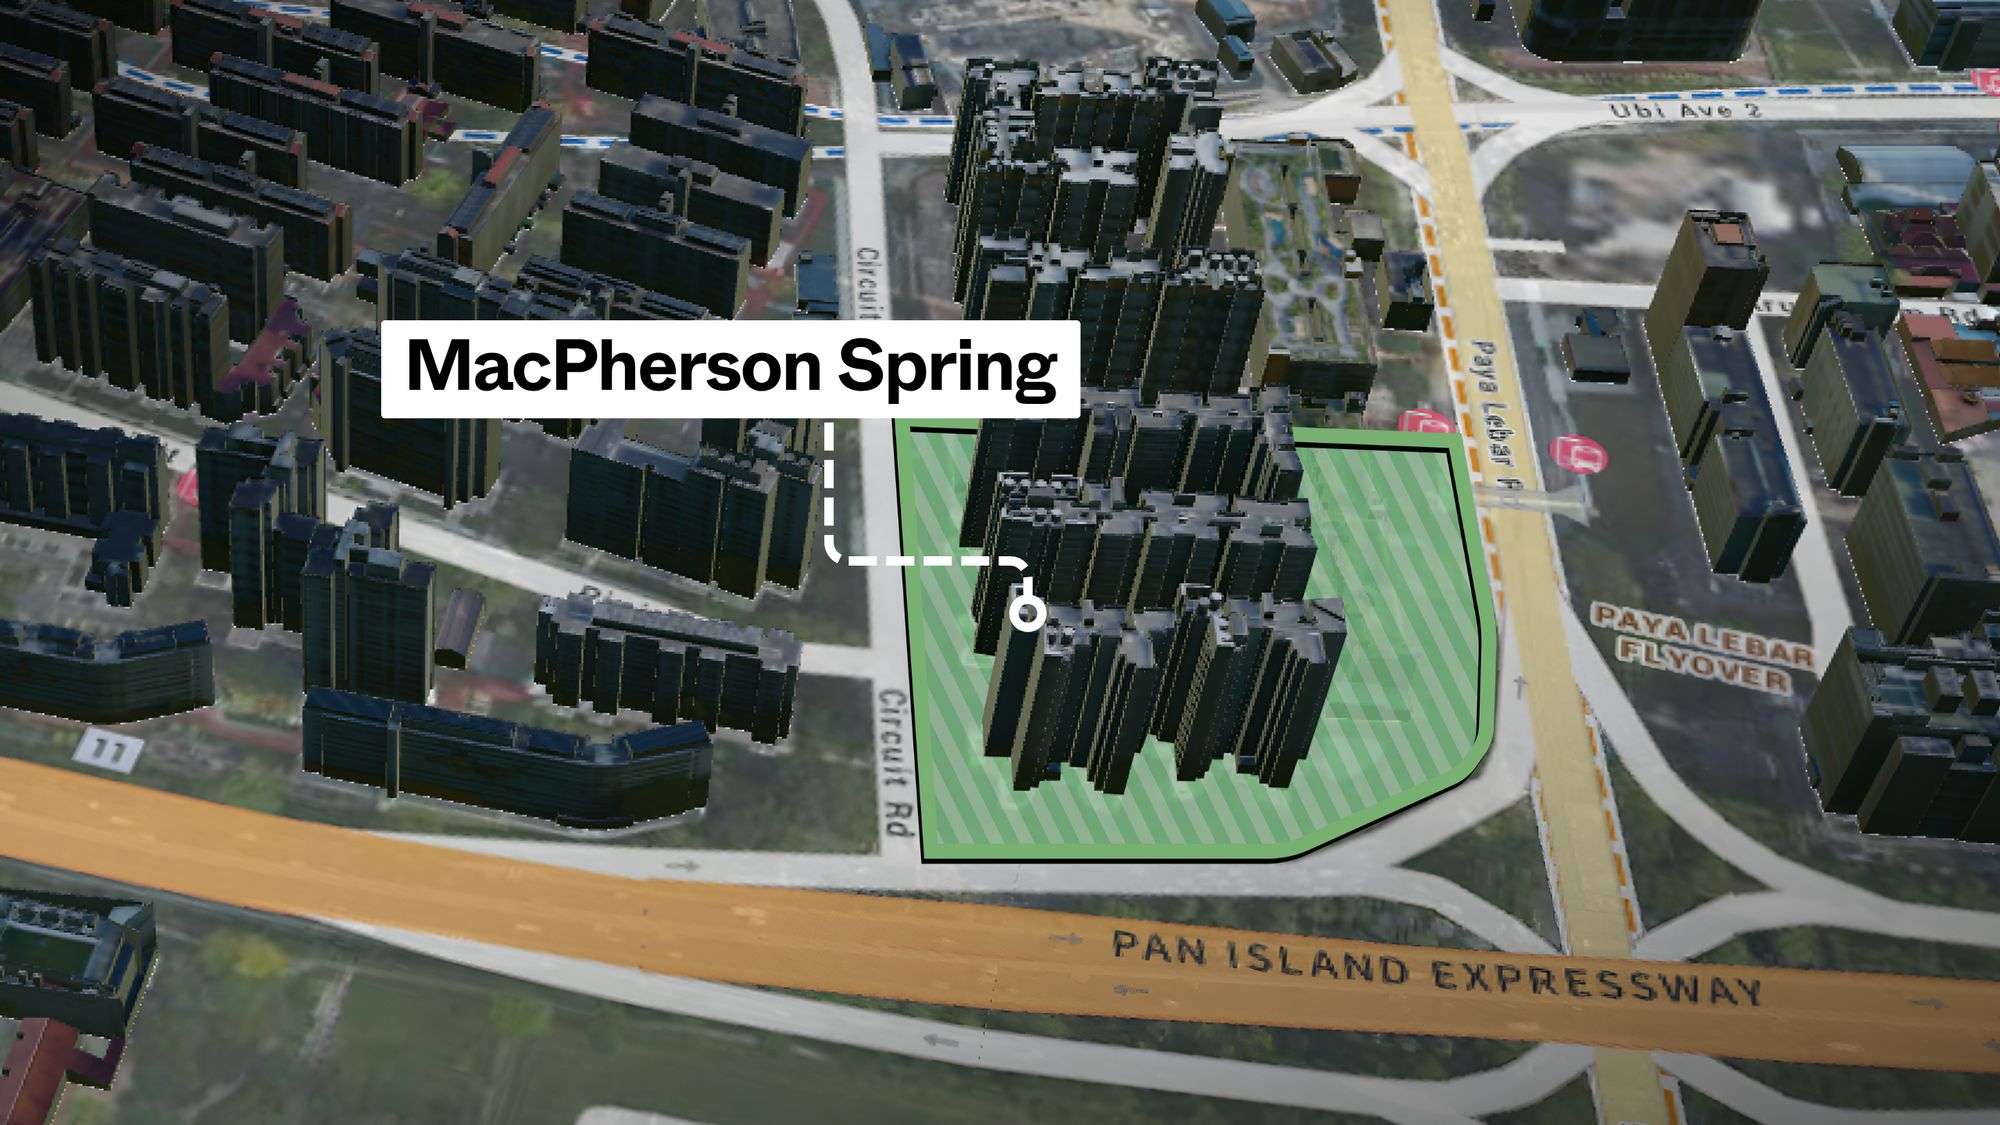
- Loyang Valley, an incredibly huge but “ulu” condo, has finally been bought by a developer; but why and what can we expect?
- How has the condo market in Serangoon moved, and what can we expect from prices there today? Find out with our Stacked Pro readers.
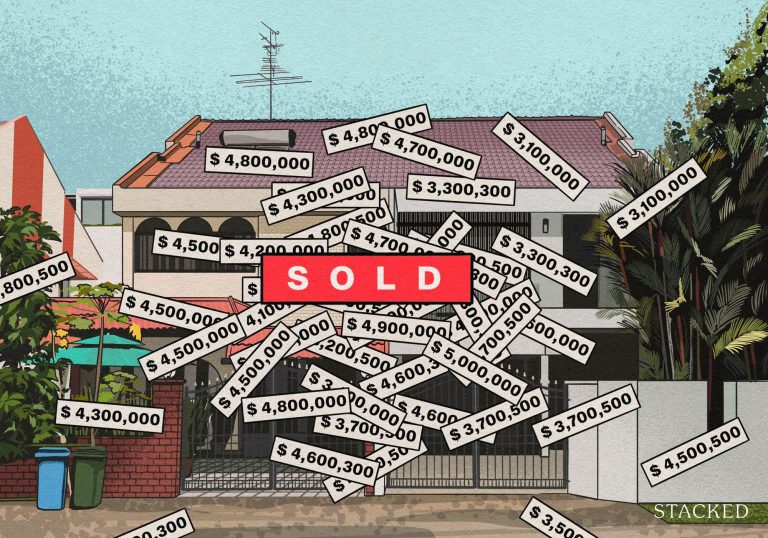
Weekly Sales Roundup (13 -19 April)
Top 5 Most Expensive New Sales (By Project)
| PROJECT NAME | PRICE S$ | AREA (SQFT) | $PSF | TENURE |
| RIVER MODERN | $6,583,000 | 1830 | $3,598 | 99 yrs (2025) |
| MEYER BLUE | $5,797,000 | 1733 | $3,345 | FH |
| GRAND DUNMAN | $5,616,000 | 2497 | $2,249 | 99 yrs (2022) |
| THE CONTINUUM | $5,397,000 | 1905 | $2,833 | FH |
| ELTA | $4,056,000 | 1507 | $2,692 | 99 yrs (2024) |
Top 5 Cheapest New Sales (By Project)
| PROJECT NAME | PRICE S$ | AREA (SQFT) | $PSF | TENURE |
| NARRA RESIDENCES | $1,262,000 | 560 | $2,255 | 99 yrs (2025) |
| ARINA EAST RESIDENCES | $1,291,000 | 495 | $2,607 | FH |
| THE CONTINUUM | $1,378,000 | 560 | $2,462 | FH |
| UNION SQUARE RESIDENCES | $1,384,000 | 506 | $2,736 | 99 yrs (2024) |
| NOVO PLACE | $1,406,000 | 872 | $1,613 | 99 yrs (2023) |
Top 5 Most Expensive Resale
| PROJECT NAME | PRICE S$ | AREA (SQFT) | $PSF | TENURE |
| HILLTOPS | $5,120,000 | 1550 | $3,303 | FH |
| LUSH ON HOLLAND HILL | $4,350,000 | 1851 | $2,350 | FH |
| PINEWOOD GARDENS | $3,810,000 | 1658 | $2,298 | FH |
| OUE TWIN PEAKS | $3,800,000 | 1604 | $2,369 | 99 yrs (2010) |
| THE TRIZON | $3,793,000 | 1765 | $2,149 | FH |
Top 5 Cheapest Resale
| PROJECT NAME | PRICE S$ | AREA (SQFT) | $PSF | TENURE |
| PARC ROSEWOOD | $658,000 | 431 | $1,528 | 99 yrs (2011) |
| AVANT RESIDENCES | $660,000 | 420 | $1,572 | 99 yrs (2012) |
| URBAN VISTA | $722,000 | 441 | $1,636 | 99 yrs (2012) |
| PALM ISLES | $728,000 | 560 | $1,301 | 99 yrs (2011) |
| URBAN RESIDENCES | $745,000 | 484 | $1,538 | FH |
Top 5 Biggest Winners
| PROJECT NAME | PRICE S$ | AREA (SQFT) | $PSF | RETURNS | HOLDING PERIOD |
| PINEWOOD GARDENS | $3,810,000 | 1658 | $2,298 | $2,530,000 | 25 Years |
| KENSINGTON PARK CONDOMINIUM | $2,950,000 | 1658 | $1,780 | $2,225,000 | 20 Years |
| SEAVIEW POINT | $3,008,888 | 1389 | $2,167 | $2,108,888 | 27 Years |
| MANDARIN GARDENS | $2,450,000 | 2024 | $1,211 | $1,650,000 | 25 Years |
| PARC REGENCY | $2,550,000 | 1658 | $1,538 | $1,552,000 | 25 Years |
Top 5 Biggest Losers
| PROJECT NAME | PRICE S$ | AREA (SQFT) | $PSF | RETURNS | HOLDING PERIOD |
| MARINA COLLECTION | $2,800,000 | 1873 | $1,495 | -$1,320,600 | 17 Years |
| DUO RESIDENCES | $1,380,000 | 646 | $2,137 | -$192,000 | 12 Years |
| THE CREST | $2,550,000 | 1302 | $1,958 | -$84,000 | 8 Years |
| LIV ON SOPHIA | $1,268,000 | 538 | $2,356 | -$73,000 | 13 Years |
| AVANT RESIDENCES | $660,000 | 420 | $1,572 | -$40,000 | 7 Years |
Top 5 Biggest Winners (ROI%)
| PROJECT NAME | PRICE S$ | AREA (SQFT) | $PSF | ROI (%) | HOLDING PERIOD |
| KENSINGTON PARK CONDOMINIUM | $2,950,000 | 1658 | $1,780 | 307% | 20 Years |
| SEAVIEW POINT | $3,008,888 | 1389 | $2,167 | 234% | 27 Years |
| LAKEVIEW ESTATE | $1,628,888 | 1615 | $1,009 | 226% | 27 Years |
| PARC OASIS | $1,510,000 | 1227 | $1,231 | 208% | 24 Years |
| MANDARIN GARDENS | $2,450,000 | 2024 | $1,211 | 206% | 25 Years |
Top 5 Biggest Losers (ROI%)
| PROJECT NAME | PRICE S$ | AREA (SQFT) | $PSF | ROI (%) | HOLDING PERIOD |
| MARINA COLLECTION | $2,800,000 | 1873 | $1,495 | -32% | 17 Years |
| DUO RESIDENCES | $1,380,000 | 646 | $2,137 | -12% | 12 Years |
| AVANT RESIDENCES | $660,000 | 420 | $1,572 | -6% | 7 Years |
| LIV ON SOPHIA | $1,268,000 | 538 | $2,356 | -5% | 13 Years |
| THE CREST | $2,550,000 | 1302 | $1,958 | -3% | 8 Years |
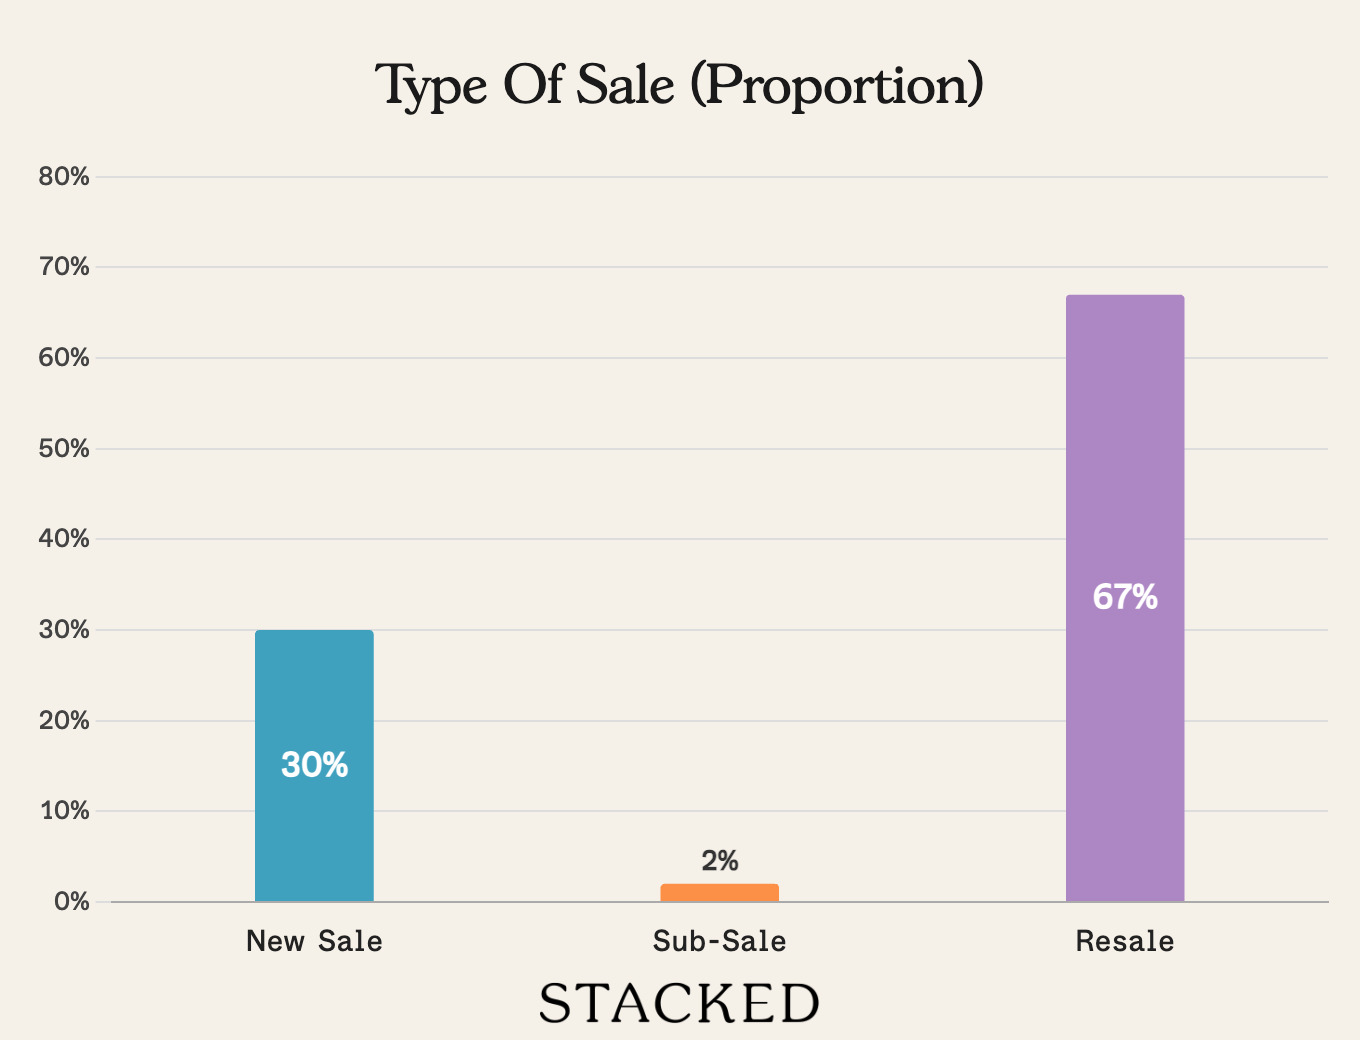
Transaction Breakdown
Follow us Stacked for news and updates on the Singapore property market.
A single headline is rarely enough to change your plans. The value comes from understanding how today’s news fits into the broader direction of the market.
If you’d like to talk through what a shift like this means for your own timing, purchase, or exit, you can reach out for a one-to-one consultation here.
And if you simply have a question or want to share a thought, feel free to write to us at stories@stackedhomes.com. We read every message.

0 Comments