The towns and estates in the Western part of Singapore aren’t the typical areas where we expect buyers to flock to for two-bedroom condominium units. Well-known neighbourhoods like Bukit Batok, Bukit Panjang, and Bukit Timah are established family areas, where demand tends to prefer larger sized units.
Although the perception among homeowners towards two-bedders have changed in recent years, these compact homes were once considered the choice for singles, younger couples, and investors.
Nonetheless, there are two-bedder units in these three neighbourhoods – Bukit Batok, Bukit Panjang, and Bukit Timah – that have recorded strong resale and capital performance. As attitudes toward these units evolve, there’s a good chance that it will renew interest in the resale market.
This week, we’ll analyse two-bedder condo units across Bukit Batok, Bukit Panjang and Choa Chu Kang to find the strongest performer over the past 10 years. This is the relatively unknown Hazel Park Condominium off Upper Bukit Timah Road.
Let’s unpack the reasons why this condo has performed so well in the two-bedder segment, as well as other attributes that led to its strong performance to date.
Past performance is a useful signal, but it's not a forecast. The projects that outperformed over the last cycle aren't guaranteed to do so again, and the reasons they outperformed may no longer apply.
The more useful question is whether a particular property still makes sense at today's price, given your budget, objectives and timeline. That's where many buyers find it helpful to get a second opinion.
Over time, that's also why we decided to work with agents who shared the same data-driven and advisory-led approach behind our editorial, consultants who could help readers think through decisions more objectively, rather than simply push transactions.
Today, the team has worked with more than 2,000 clients across over $5B in property transactions.
Top two-bedder units in the Bukit Batok, Bukit Panjang and Choa Chu Kang areas
To identify the strongest performer, we analysed the profitability of two-bedder units in all three areas over the past 10 years. We focused solely on subsale and resale transactions, and excluded new launch sales.

We have also excluded projects that lodged less than five profitable transactions, in order to prevent outliers from skewing the data.
| Project | Gains | |||
| Average ROI | Average profit | Average holding period (years) | No. of units | |
| KINGSFORD . HILLVIEW PEAK | 10.05% | $106,889 | 2.4 | 8 |
| ECO SANCTUARY | 15.88% | $145,648 | 3.8 | 12 |
| THE HILLIER | 17.64% | $200,333 | 4.2 | 9 |
| THE TENNERY | 17.92% | $164,143 | 3.2 | 7 |
| HILLSTA | 18.47% | $166,714 | 4.5 | 7 |
| MAYSPRINGS | 18.52% | $140,278 | 4.7 | 18 |
| REGENT HEIGHTS | 18.81% | $152,646 | 4.1 | 15 |
| HILLION RESIDENCES | 19.59% | $208,600 | 4.3 | 5 |
| SPRINGDALE CONDOMINIUM | 20.19% | $225,000 | 3.6 | 5 |
| PARKVIEW APARTMENTS | 20.78% | $150,836 | 5.8 | 19 |
| HILLVIEW REGENCY | 21.11% | $171,941 | 5.0 | 17 |
| THE MADEIRA | 22.73% | $203,500 | 3.4 | 10 |
| FORESQUE RESIDENCES | 22.82% | $203,375 | 2.7 | 8 |
| MI CASA | 23.54% | $229,481 | 5.7 | 6 |
| GUILIN VIEW | 25.87% | $190,469 | 4.5 | 9 |
| SUMMERHILL | 28.95% | $316,900 | 4.3 | 5 |
| THE WARREN | 29.58% | $250,622 | 5.6 | 5 |
| NORTHVALE | 29.77% | $240,286 | 5.2 | 7 |
| HILLVIEW HEIGHTS | 30.94% | $353,667 | 5.0 | 6 |
| TREE HOUSE | 31.97% | $278,500 | 4.9 | 14 |
| SOL ACRES | 34.39% | $266,222 | 2.8 | 9 |
| HILLTOP GROVE | 36.56% | $295,200 | 6.7 | 5 |
| HILLVIEW GREEN | 36.97% | $380,770 | 3.2 | 7 |
| BLOSSOM RESIDENCES | 37.42% | $265,000 | 4.8 | 5 |
| GLENDALE PARK | 41.95% | $452,021 | 5.0 | 9 |
| SYMPHONY HEIGHTS | 44.20% | $487,000 | 5.8 | 5 |
| HAZEL PARK CONDOMINIUM | 49.46% | $529,714 | 6.0 | 7 |
Going into this analysis, we had expected that the top performers would be established names such as Hillion Residences, The Tennery, The Hillier, or even Tree House. But after crunching the numbers, the result surprised us.
Although it is an integrated development, with a direct connection to Bukit Panjang MRT station on the Downtown Line, the 546-unit Hillion Residences posted average but unremarkable returns for their two-bedders. Likewise, the same could be said for The Tennery and The Hillier.
Instead, we found that the top performer in the two-bedroom segment is Hazel Park Condominium, and it surged ahead of the pack by a wide margin.
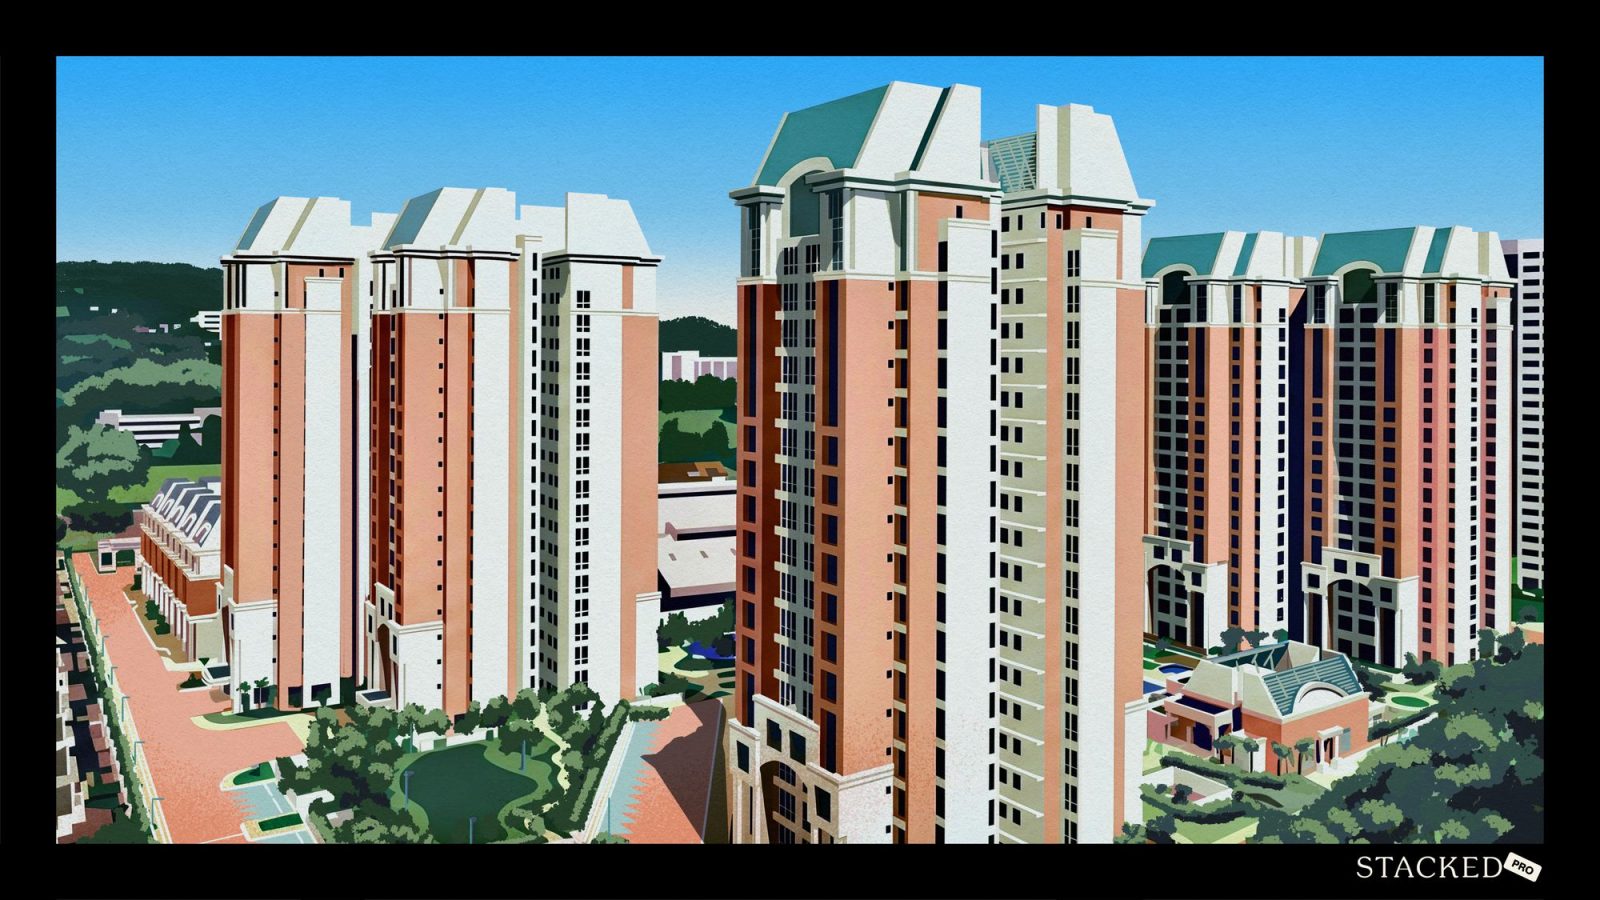
Located on Hazel Park Terrace off upper Bukit Timah Road, the 999-year leasehold Hazel Park Condo is a 696-unit development that was completed in 2000. Its two-bedders raked in an average return on investment (ROI) of 49.46%, which is five percentage points ahead of the runner-up, Symphony Heights (44.20%), and nearly eight points ahead of Glendale Park (41.95%).
The condo also recorded the highest average profit among the condos in our analysis, with most sellers reaping profits of over $529,000. This tells us that it is not the usual case of high percentage gains because of a low base price, since its two-bedders have turned out to be reasonably profitable as well.
However, we caveat our result by stating that the development has only recorded seven profitable transactions over the 10 year period of our analysis. But if you look at the whole dataset, most projects recorded fewer than 10 profitable two-bedder transactions over the past decade.
We feel that this still puts Hazel Park in the middle of the pack in terms of transaction volume and this sample size.
In addition, we also notice that older and larger developments in Bukit Batok, Bukit Panjang and Choa Chu Kang seem to have done particularly well. Hazel Park, Symphony Heights, Glendale Park and Hillview Green are all late-1990s projects with larger unit layouts compared to newer developments.
Why did Hazel Park Condominium outperform by such a large margin?
Let’s start by examining the most typical cause: its selling price when it first launched for sale. If Hazel Park was substantially cheaper at launch, its units would have had much more room to reap significant price appreciation when they hit the resale market.
Let’s look at the average quantum, $PSF, and unit sizes of two-bedder transactions across all three areas in 1996 – this is when Hazel Park was launched for sale. This comparison includes all transaction types:
| Project | Completion year | Property type | Average $PSF | Average price* | Average size (for units transacted) |
| MAYSPRINGS | 1998 | Apartment | $627 | $537,877 | 858 |
| PARKVIEW APARTMENTS | 1998 | Apartment | $588 | $576,586 | 981 |
| CASHEW PARK CONDOMINIUM | 1983 | Condominium | $678 | $605,667 | 893 |
| REGENT HEIGHTS | 1999 | Condominium | $613 | $627,359 | 1023 |
| MONTROSA | 1999 | Condominium | $706 | $637,090 | 902 |
| HILLBROOKS | 1999 | Condominium | $724 | $646,290 | 893 |
| HILLVIEW PARK | 1995 | Condominium | $790 | $656,667 | 833 |
| NORTHVALE | 1998 | Apartment | $620 | $667,765 | 1077 |
| HILLVIEW GREEN | 1998 | Condominium | $668 | $673,673 | 1010 |
| CHANTILLY RISE | 1998 | Condominium | $717 | $678,500 | 947 |
| MERAWOODS | 1999 | Condominium | $672 | $696,279 | 1042 |
| HILLVIEW HEIGHTS | 1996 | Condominium | $716 | $703,150 | 982 |
| SOUTHAVEN I | 1997 | Condominium | $733 | $712,667 | 972 |
| HUME PARK II | 1997 | Condominium | $739 | $731,000 | 988 |
| MERALODGE | 1997 | Condominium | $659 | $746,600 | 1133 |
| SYMPHONY HEIGHTS | 1998 | Condominium | $765 | $748,577 | 980 |
| GLENDALE PARK | 2000 | Condominium | $728 | $752,500 | 1033 |
| HAZEL PARK CONDOMINIUM | 2000 | Condominium | $705 | $764,060 | 1093 |
| PARC PALAIS | 1999 | Condominium | $786 | $764,920 | 973 |
| SPRINGDALE CONDOMINIUM | 1998 | Condominium | $899 | $832,233 | 926 |
| THE DAIRY FARM | 1985 | Condominium | $624 | $861,818 | 1386 |
| SOUTHAVEN II | 1999 | Condominium | $814 | $865,750 | 1066 |
Hazel Park was not a cheap development when it first hit the market. In fact it was the fourth most expensive project in our selected areas, in terms of absolute price. But we also see where its appeal stems from.
Other developments which launched around that time, like Parkview Apartments and Maysprings were much cheaper in terms of price quantum because they were 99-year leasehold projects. On the other hand, Hazel Park is a 999-year leasehold project, a fact that contributes towards its price premium.
In terms of size-to-price efficiency (about $705 psf), buyers were getting a 1,093 sq ft unit. This was one of the largest two-bedders in the dataset, even back in 1996. Only The Dairy Farm (1,386 sq ft), Meralodge (1,133 sq ft) and Northvale (1,077 sq ft) were comparable or larger.
This is relevant to buyers today since a 1,093 sq ft unit would be on par with a newer three-bedder, as unit sizes have shrunk in recent years. We also pointed out that developments with larger units tended to perform better on the resale market.
The two-bedroom owners at Hazel Park Condominium, just like the buyers of the other larger two-bedders, likely don’t view these units as the typical compact two-bedder we are familiar with today. Back then, the two-bedroom units at the condo were family-sized homes and appealed to upgrader families.
Does Hazel Park Condominium also have a locational advantage?
To assess whether location played a role, we compared the locational attributes of the other developments in our three areas. If the better-performing projects all consistently share some of the same characteristics, that clues us in on what supports stronger returns in these areas.
| Project | Average ROI | Sub-location | Nearest MRT station | Walking time to MRT | Year nearest MRT station opened | Is it within 1km of any renowned primary school? | Convenient access to nature parks? |
| Gains | |||||||
| KINGSFORD . HILLVIEW PEAK | 10.05% | Hillview | Hillview | 7 min | 2015 | – | Yes |
| ECO SANCTUARY | 15.88% | Rest of Bukit Panjang | – | – | – | – | Yes |
| THE HILLIER | 17.64% | Hillview | Hillview | 6 min | 2015 | – | Yes |
| THE TENNERY | 17.92% | Near Bukit Panjang MRT | Bukit Panjang | 3 min | 2015 | – | No |
| HILLSTA | 18.47% | Rest of Bukit Panjang | Bukit Panjang | 7 min | 2015 | – | No |
| MAYSPRINGS | 18.52% | Near Bukit Panjang MRT | Bukit Panjang | 4 min | 2015 | – | No |
| REGENT HEIGHTS | 18.81% | Hillview | – | – | – | – | Yes |
| HILLION RESIDENCES | 19.59% | Near Bukit Panjang MRT | Bukit Panjang | 0 min | 2015 | – | No |
| SPRINGDALE CONDOMINIUM | 20.19% | Hillview | Hume | 9 min | 2025 | – | Yes |
| PARKVIEW APARTMENTS | 20.78% | Rest of Bukit Batok | – | – | – | – | Yes |
| HILLVIEW REGENCY | 21.11% | Hillview | Bukit Batok | 13 min | 1990 | – | Yes |
| THE MADEIRA | 22.73% | Near Bukit Gombak MRT | Bukit Gombak | 2 min | 1990 | – | Yes |
| FORESQUE RESIDENCES | 22.82% | Rest of Bukit Panjang | – | – | – | – | Yes |
| MI CASA | 23.54% | Choa Chu Kang Central | Choa Chu Kang | 7 min | 1990 | – | No |
| GUILIN VIEW | 25.87% | Near Bukit Gombak MRT | Bukit Gombak | 5 min | 1990 | – | Yes |
| SUMMERHILL | 28.95% | Hillview | Hillview | 12 min | 2015 | – | Yes |
| THE WARREN | 29.58% | Choa Chu Kang Central | Choa Chu Kang | 7 min | 1990 | – | No |
| NORTHVALE | 29.77% | Choa Chu Kang Central | Choa Chu Kang | 4 min | 1990 | – | No |
| HILLVIEW HEIGHTS | 30.94% | Hillview | Hillview | 6 min | 2015 | – | Yes |
| TREE HOUSE | 31.97% | Rest of Bukit Panjang | – | – | – | – | Yes |
| SOL ACRES | 34.39% | Rest of CCK | – | – | – | – | No |
| HILLTOP GROVE | 36.56% | Hillview | – | – | – | – | Yes |
| HILLVIEW GREEN | 36.97% | Hillview | Hillview | 9 min | 2015 | – | Yes |
| BLOSSOM RESIDENCES | 37.42% | Rest of Bukit Panjang | – | – | – | – | Yes |
| GLENDALE PARK | 41.95% | Hillview | Hillview | 5 min | 2015 | – | Yes |
| SYMPHONY HEIGHTS | 44.20% | Hillview | Hume | 4 min | 2025 | – | Yes |
| HAZEL PARK CONDOMINIUM | 49.46% | Cashew | Cashew | 3 min | 2015 | – | No |
More from Stacked
Bishan Condo Prices Have Risen 83% In 10 Years. Here’s Why Buyers Still Pay Up
Bishan is one of Singapore’s most prominent towns and a unique residential neighbourhood. It isn’t a high-end central district like…
About half of the top ten performers are condos in or around the Hillview area, including Hazel Park which is located next to the Cashew Road and Chestnut Drive landed estates.
The top ten performers each recorded an ROI of over 30% for their two-bedroom units. This suggests that this particular neighbourhood stands out, which implies that Hazel Park has a clear locational advantage by being there.
In general, the Hillview area is one of the most lush residential neighbourhoods in this part of Singapore, and it’s where well-known green spaces like Dairy Farm Nature Park, Bukit Timah Nature Reserve, and the Rail Corridor are located.
Since the completion of the Downtown Line (DTL) in 2015, public transport accessibility into these locations have been significantly improved. With MRT stations like Hillview, Cashew, and Hume there is a better balance of greenery and public transport accessibility in this region.
Hazel Park enjoys an added advantage because it is a three-minute walk to Cashew MRT station. The earlier buyers at Hazel Park back in the 1990s and early 2000s wouldn’t have known that the area would see an MRT line there. From a price perspective, the usual ‘MRT proximity premium’ wasn’t keyed in for several years.
At the same time, the character of the area has been well-preserved with no mega-developments or master planned projects that have eradicated key green spaces. Nearly all of the newer projects are boutique projects with between 300 – 600 units. Thus, the area doesn’t feel significantly more built up which elevates the appeal of projects there among some buyers.
Did factors like unit count, land area, and unit mix play an advantageous role?
Let’s examine the impact of these factors among the condos in our selected areas.
| Project | Average ROI | Minimum 2-bedroom size | Land size (sqm) | Number of units in the project | Land area (sqm) per unit | Unit mix | Average price in 1996 | Average price in 2025 |
| Gains | ||||||||
| KINGSFORD . HILLVIEW PEAK | 10.05% | 775 | 14,671 | 512 | 29 | 1, 2, 3, 4 | – | $1,221,291 |
| ECO SANCTUARY | 15.88% | 667 | 18,699 | 483 | 39 | 1, 2, 3, 4 | – | $1,122,875 |
| THE HILLIER | 17.64% | 807 | 14,294 | 528 | 27 | 1, 2 | – | $1,339,222 |
| THE TENNERY | 17.92% | 850 | 15,645 | 338 | 46 | 1, 2 | – | $1,187,200 |
| HILLSTA | 18.47% | 753 | 5,853 | 396 condos and 20 landed units | 14 | 1, 2, 3 | – | $1,185,000 |
| MAYSPRINGS | 18.52% | 807 | 25,000 | 636 | 39 | 2, 3, 4 | $537,877 | $1,089,600 |
| REGENT HEIGHTS | 18.81% | 1023 | 26,819 | 645 | 42 | 1, 2, 3, 4 | $627,359 | $1,047,653 |
| HILLION RESIDENCES | 19.59% | 710 | 19,236 | 546 | 35 | 1, 2, 3, 4 | – | $1,332,889 |
| SPRINGDALE CONDOMINIUM | 20.19% | 926 | 31,173 | 480 | 65 | 2, 3, 4 | $832,233 | $1,535,000 |
| PARKVIEW APARTMENTS | 20.78% | 926 | 24,979 | 532 | 47 | 2, 3 | $576,586 | $991,222 |
| HILLVIEW REGENCY | 21.11% | 904 | 23,093 | 572 | 40 | 2, 3 | – | $1,084,543 |
| THE MADEIRA | 22.73% | 936 | 53,991 | 456 | 118 | 2, 3, 4 | – | $1,205,500 |
| FORESQUE RESIDENCES | 22.82% | 667 | 22,744 | 496 | 46 | 1, 2, 3, 4 | – | $1,192,500 |
| MI CASA | 23.54% | 990 | 19,000 | 457 | 42 | 1, 2, 3, 4 | – | $1,185,000 |
| GUILIN VIEW | 25.87% | 840 | 31,025 | 655 | 47 | 2, 3, 4 | – | $1,076,667 |
| SUMMERHILL | 28.95% | 947 | 28,251 | 406 | 70 | 2, 3, 4 | – | – |
| THE WARREN | 29.58% | 1033 | 29,093 | 699 | 42 | 2, 3, 4, 5 | – | $1,223,000 |
| NORTHVALE | 29.77% | 1033 | 37,265 | 762 | 49 | 1, 2, 3, 4 | $667,765 | $1,142,127 |
| HILLVIEW HEIGHTS | 30.94% | 958 | 27,123 | 360 | 75 | 1, 2, 3, 4 | $703,150 | $1,743,333 |
| TREE HOUSE | 31.97% | 743 | 22,700 | 429 | 53 | 2, 3, 4, 5 | – | $1,200,000 |
| SOL ACRES | 34.39% | 614 | 32,909 | 1,327 | 25 | 1, 2, 3, 4, 5 | – | $1,143,525 |
| HILLTOP GROVE | 36.56% | 861 | 13,006 | 192 | 68 | 2, 3 | – | $1,090,000 |
| HILLVIEW GREEN | 36.97% | 797 | 30,449 | 400 | 76 | 2, 3, 4 | $673,673 | $1,575,000 |
| BLOSSOM RESIDENCES | 37.42% | 753 | 66,264 | 602 | 110 | 2, 3, 4 | – | $990,000 |
| GLENDALE PARK | 41.95% | 1033 | 30,837 | 448 | 69 | 2, 3 | $752,500 | $1,825,000 |
| SYMPHONY HEIGHTS | 44.20% | 915 | 36,143 | 449 | 80 | 2, 3, 4 | $748,577 | $1,752,750 |
| HAZEL PARK CONDOMINIUM | 49.46% | 980 | 73,905 | 696 | 106 | 2, 3, 4, 5 | $764,060 | $1,621,333 |
We have already laid out that one of the standout factors is unit size. Hazel Park’s smallest two-bedder is already 980 sq ft, making it significantly larger than projects in the area. Most new condos typically see two-bedroom units that only span around 600 – 800 sq ft.
Another notable factor is the size of the site area. Hazel Park occupies a 73,905 sqm (795,217 sq ft) plot with just 696 units, which translates to around 106 sqm of land area per unit. This is among the highest land-to-unit ratios on our list, exceeded only by The Madeira and Blossom Residences. When we consider newer condos, the land-to-unit ratio significantly drops to between 25 – 40 sqm.
Moreover, Hazel Park also has a broad family-oriented unit mix, comprising two- to five-bedroom apartments. Some of the lower-performing developments in this analysis, such as The Hillier and The Tennery, consist of one- and two-bedroom units. It is worth taking note that some buyers don’t like projects dominated by smaller units.
Does the layout of units at Hazel Park Condominium give it an edge?

Both units are the smallest two-bedder layouts in their respective projects. Hazel Park’s unit is a two-bedroom, two-bathroom layout, while Glendale Park is configured as a two-bedroom, two-bathroom unit plus study.
Ryan J. Ong
A seasoned content strategist with over 17 years in the real estate and financial journalism sectors, Ryan has built a reputation for transforming complex industry jargon into accessible knowledge. With a track record of writing and editing for leading financial platforms and publications, Ryan's expertise has been recognised across various media outlets. His role as a former content editor for 99.co and a co-host for CNA 938's Open House programme underscores his commitment to providing valuable insights into the property market.Need help with a property decision?
Speak to our team →Read next from Property Investment Insights
PRO New Launch Condo Analysis Lentor Gardens Residences Starts From $1.5M For A Two-Bedder — How Its Pricing Compares In Lentor
Property Investment Insights We Analysed How Executive Condominiums Have Performed Since Launch — Here Are The 3 Biggest Lessons We Found
PRO Property Investment Insights How A 30-Year-Old Condo Became Serangoon’s Strongest-Performing Condo For 2-Bedders — With Average Profits Of $457,000
PRO Property Investment Insights This Pasir Ris EC Launched From Around $500K — Here’s How It Has Performed 13 Years Later
Latest Posts
Singapore Property News This $17.8M Portfolio Of 14 Office Units Comes Fully Leased — Just As CBD Office Rents Are Expected To Rise Up To 20%
Property Advice We’re Planning To Retire In Johor: Should We Replace Our $3M Singapore Home With A $1.5M Condo?
Investor Case Studies Why We Bought A $1.26M 3-Bedroom Condo Instead Of Two 1-Bedroom Investment Units: A Buyer’s Case Study
0 Comments