Treasure at Tampines Pricing Review: How Its Prices Compare to D18, OCR, and the Wider Market
August 26, 2025
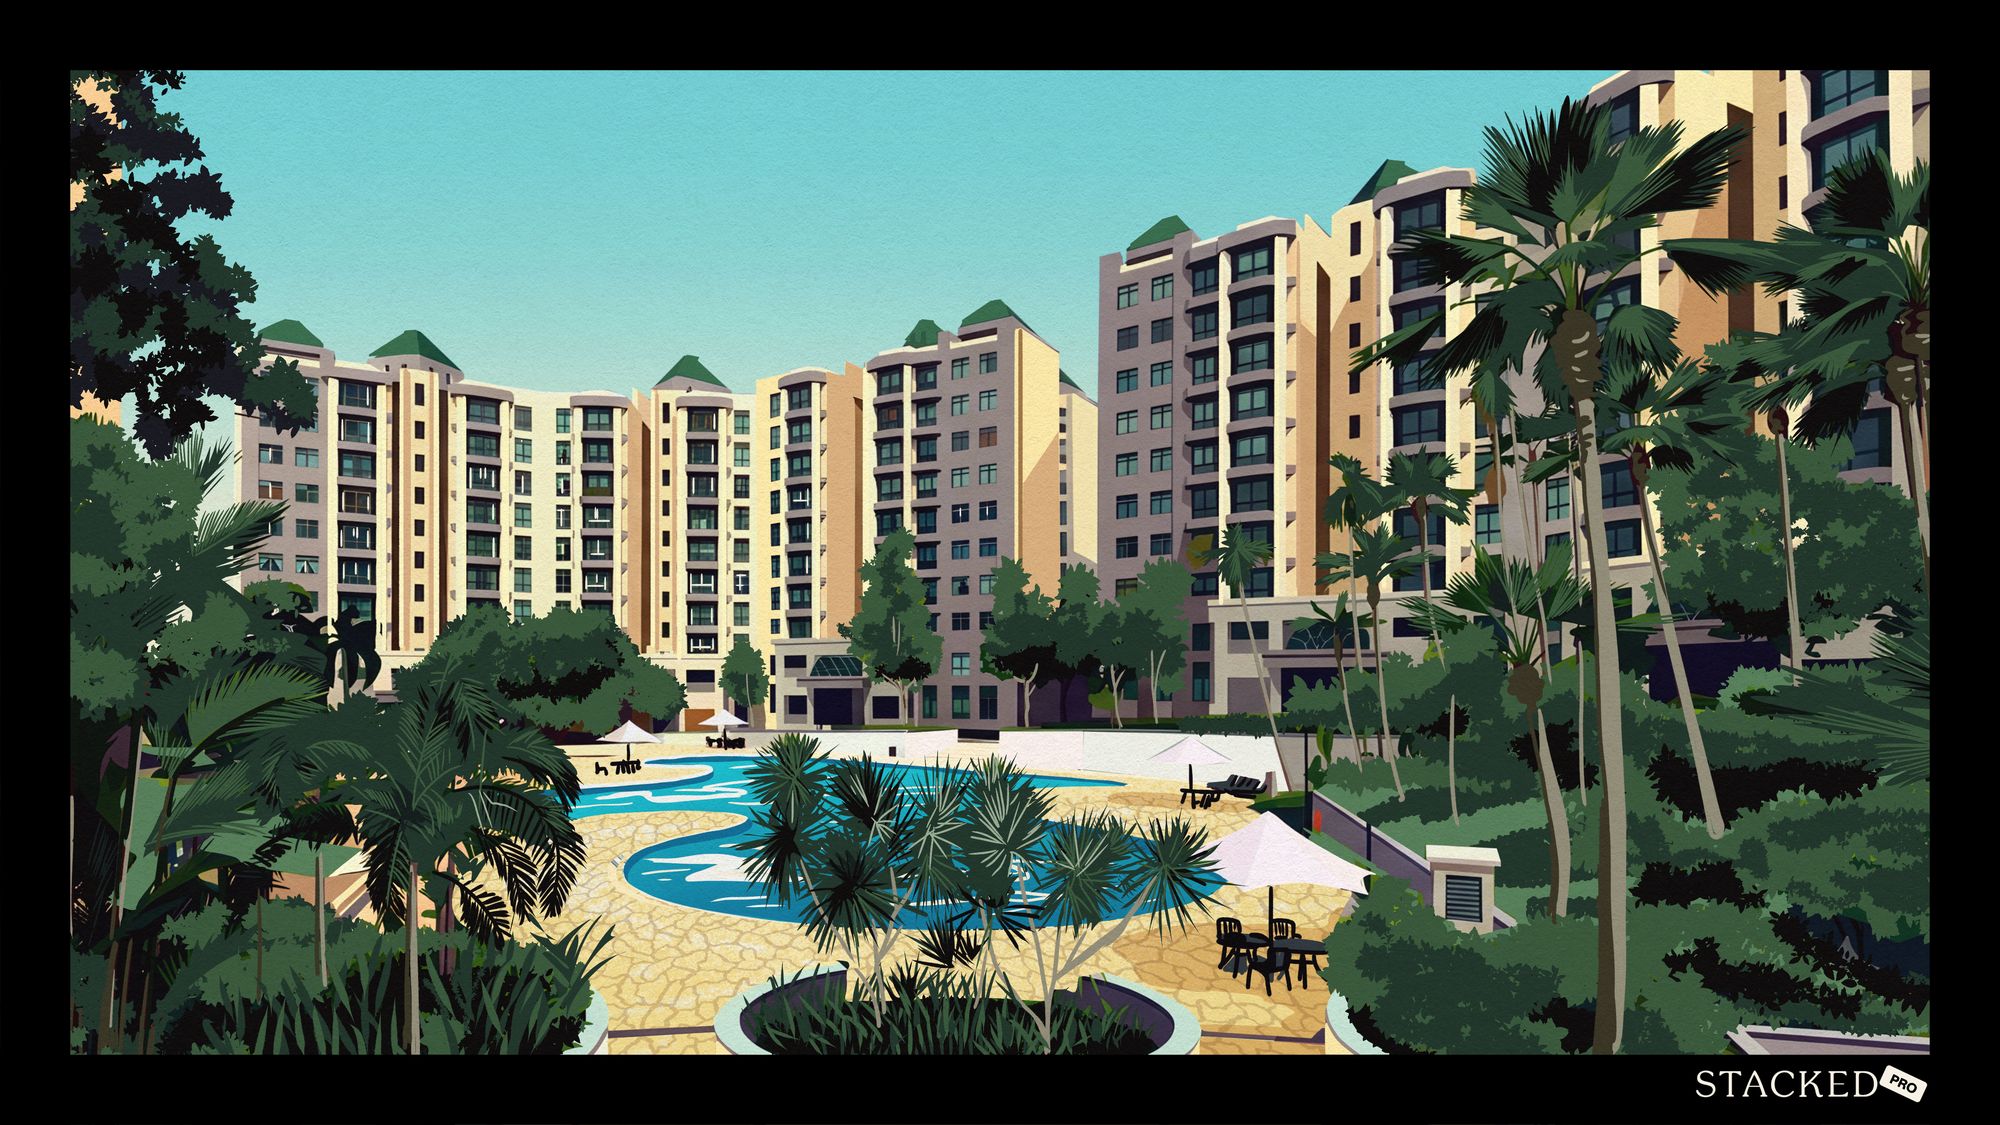
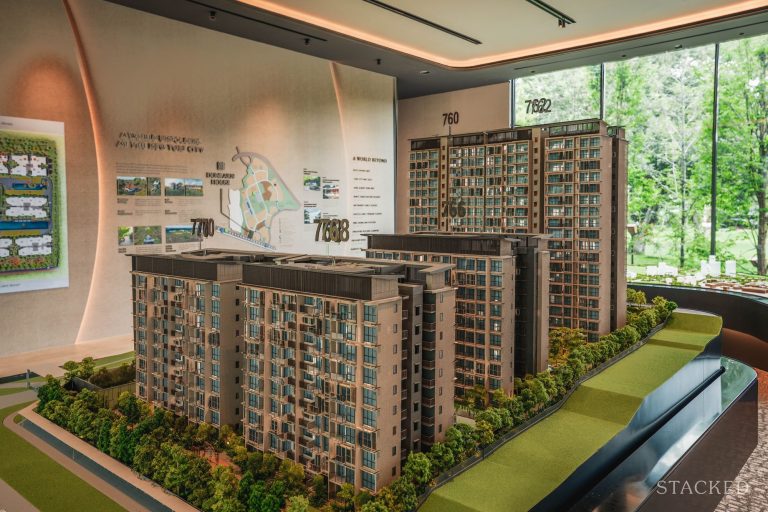
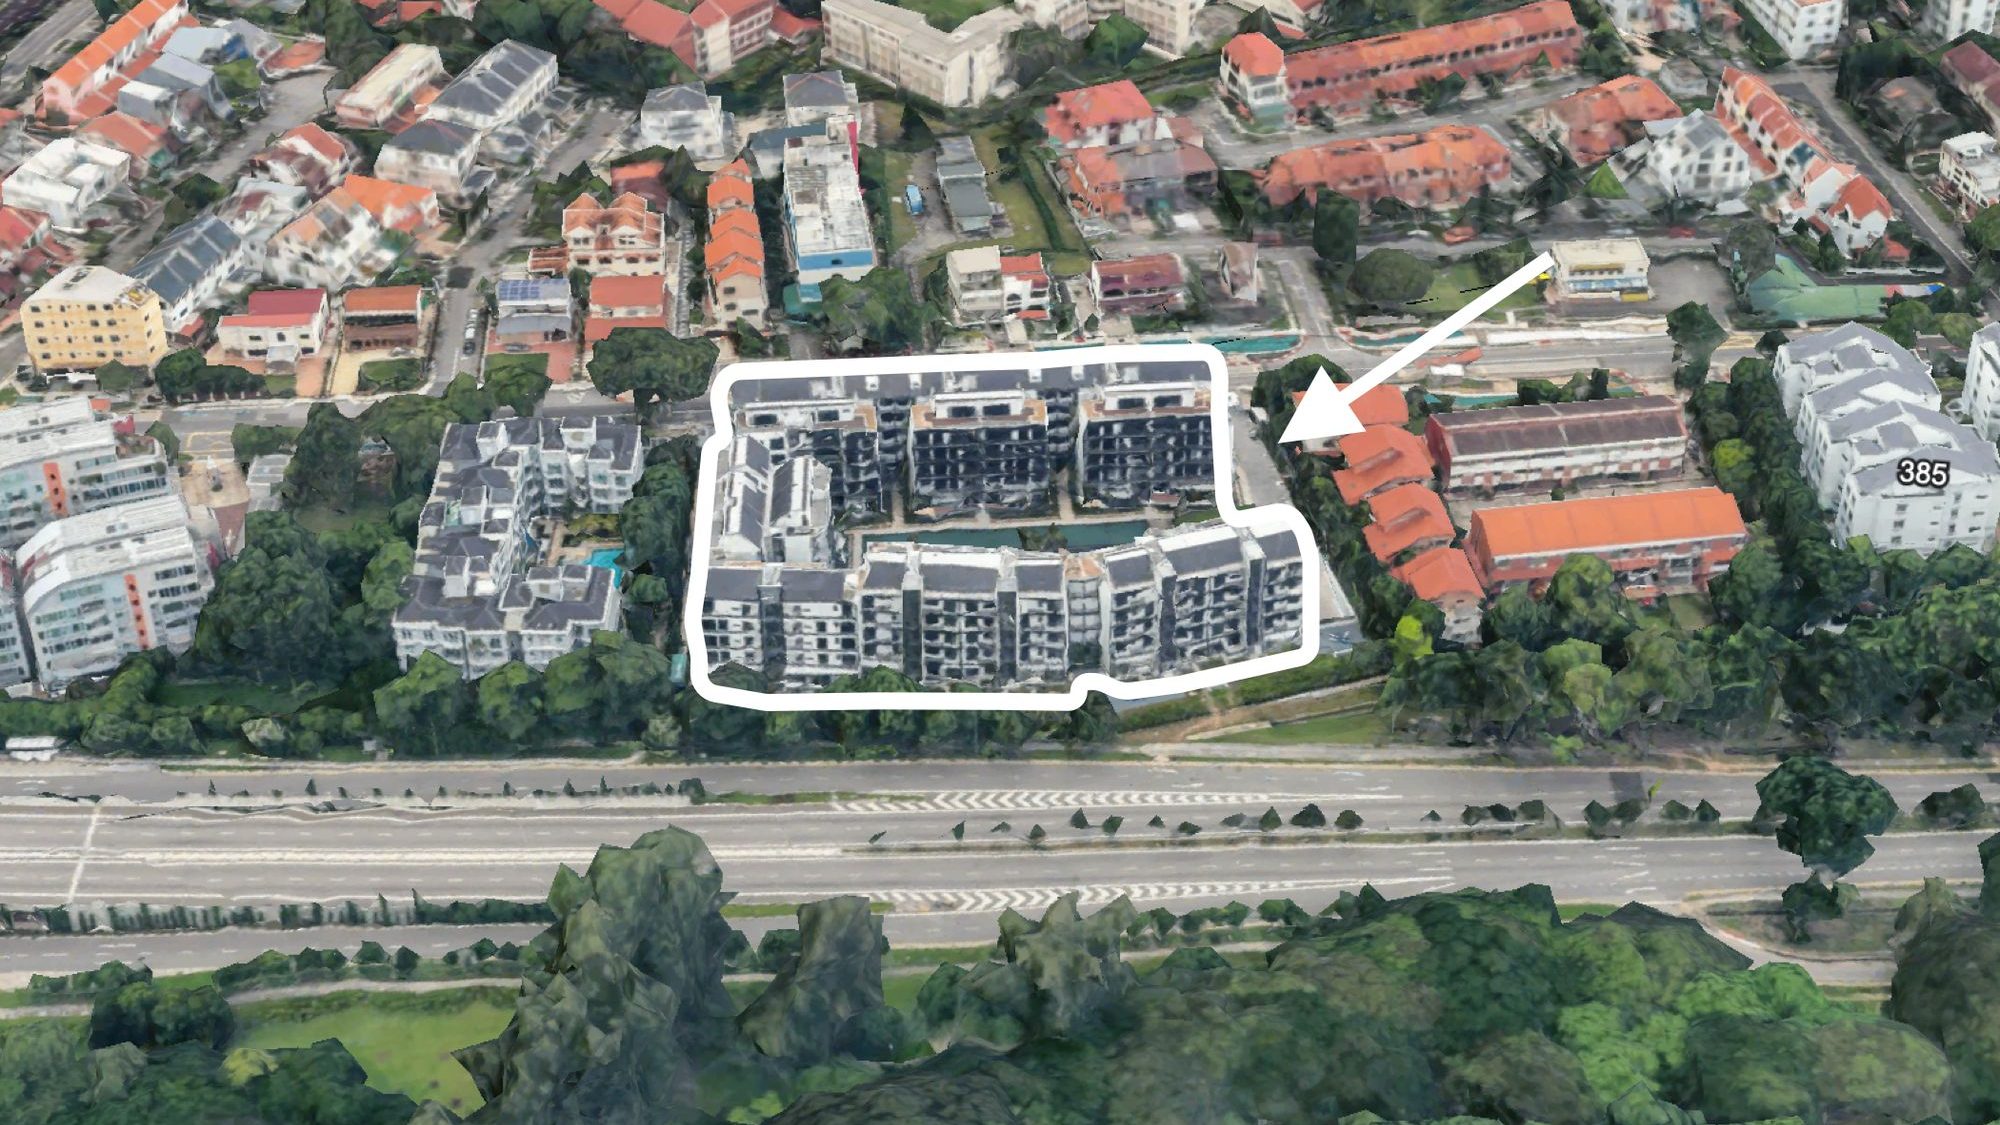
A pricing review of Treasure at Tampines has some challenges; the main one being scale. As of 2025, Treasure at Tampines is the single largest condo project in Singapore with 2,203 units. At this size, it’s really more akin to a micro-town or estate than a typical condo project. That also means a more varied profile of owners, which can range from pure owner-occupiers to entry-level investors to multi-generational families. This can all impact buying and selling behaviour, and the ultimate price point.
Nonetheless, Treasure at Tampines has always been known for being competitively priced; this was part of the sales pitch since even before the launch day. Now on the resale market, it’s one of the few projects where a three-bedder can be had for below $1.7 million; an increasingly rare possibility in 2025.
But does being cheaper necessarily mean better value? Let’s take a closer look at the numbers:
Key Points:
- Price accessibility: Treasure at Tampines remains attractive mainly on quantum, especially for three- and four-bedders that fit upgrader budgets.
- Mega-project competition: With 2,200+ units, resale sellers face heavy competition from within the same development.
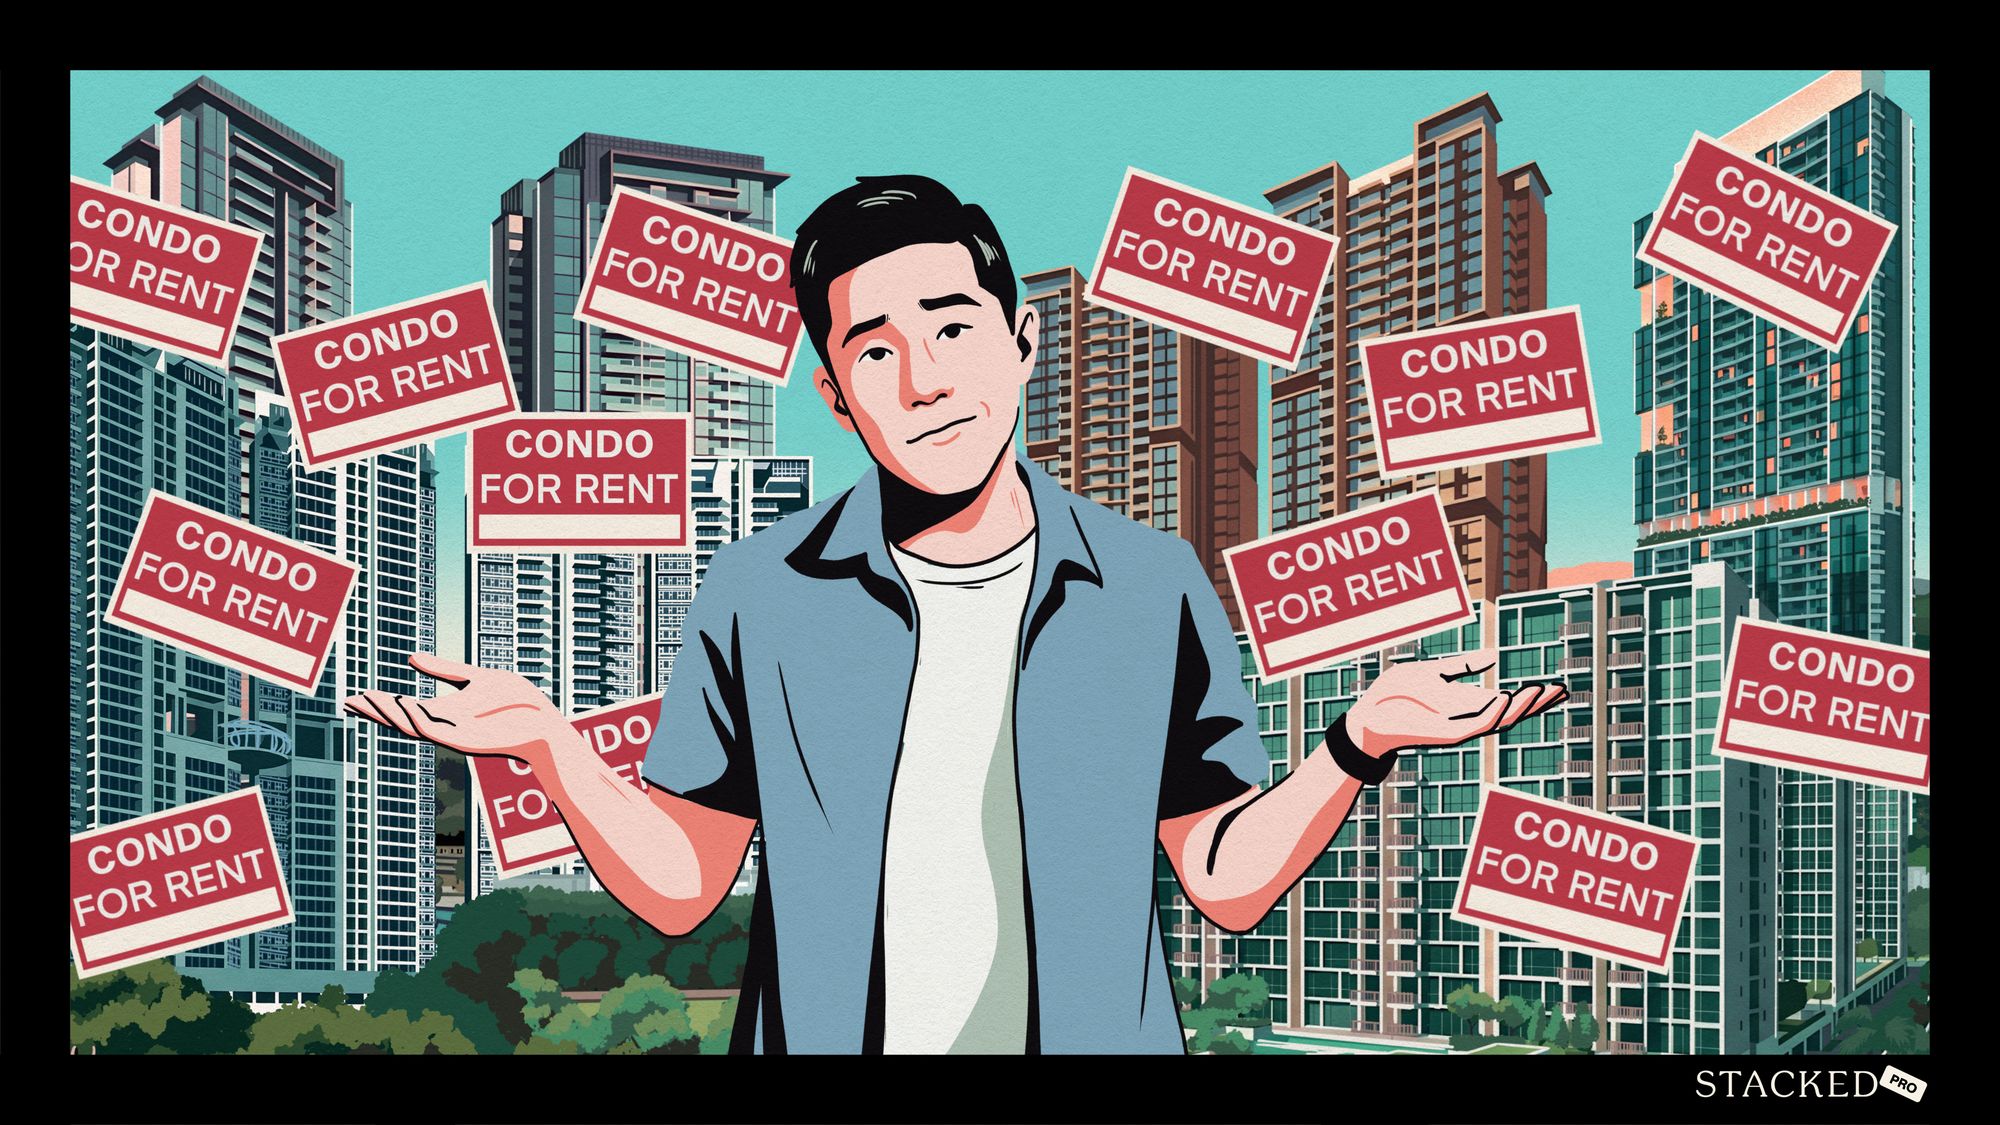
- Future supply risk: A wave of new ECs (and Parktown Residence) will add significant competition once they hit MOP.
- Smaller unit pressure: One-bedders face the toughest resale outlook, as Treasure at Tampines already makes up most of D18’s one-bedder stock.
The challenge for many buyers today isn't access to information.
It's interpreting that information in a way that makes sense for their finances, goals, and stage of life.
Over time, that's also why we decided to work with agents who shared the same data-driven and advisory-led approach behind our editorial, consultants who could help readers think through decisions more objectively, rather than simply push transactions.
Today, the team has worked with more than 2,000 clients across over $5B in property transactions.
First, let’s look at overall prices
We’ll look at how Treasure at Tampines has performed since its launch, compared to the broader pool of condos in District 18, as well as Singapore-wide. This covers all transaction types: new sale, subsale, and resale.
All tenures
| Year | Treasure at Tampines | D18 | All non-landed private properties |
| 2019 | $1,339 | $1,197 | $1,560 |
| 2020 | $1,369 | $1,172 | $1,513 |
| 2021 | $1,410 | $1,192 | $1,600 |
| 2022 | $1,540 | $1,223 | $1,712 |
| 2023 | $1,646 | $1,344 | $1,869 |
| 2024 | $1,698 | $1,415 | $1,886 |
| Annualised | 4.86% | 3.40% | 3.86% |
99-year leasehold properties
| Year | Treasure at Tampines | D18 | All non-landed private properties |
| 2019 | $1,339 | $1,199 | $1,474 |
| 2020 | $1,369 | $1,174 | $1,453 |
| 2021 | $1,410 | $1,193 | $1,517 |
| 2022 | $1,540 | $1,223 | $1,595 |
| 2023 | $1,646 | $1,344 | $1,783 |
| 2024 | $1,698 | $1,417 | $1,854 |
| Annualised | 4.86% | 3.40% | 4.70% |
We see that, in terms of ROI, Treasure at Tampines has outperformed both District 18 and the broader Singapore market. This is also true when compared specifically to other 99-year properties.
Let’s make some comparisons across the OCR, RCR, and CCR:
All tenures
| Year | Treasure at Tampines | CCR | RCR | OCR |
| 2019 | $1,339 | $2,294 | $1,726 | $1,225 |
| 2020 | $1,369 | $2,181 | $1,681 | $1,229 |
| 2021 | $1,410 | $2,318 | $1,808 | $1,252 |
| 2022 | $1,540 | $2,451 | $1,893 | $1,381 |
| 2023 | $1,646 | $2,512 | $2,102 | $1,518 |
| 2024 | $1,698 | $2,330 | $2,159 | $1,653 |
| Annualised | 4.86% | 0.31% | 4.58% | 6.17% |
99-year leasehold properties
| Year | Treasure at Tampines | CCR | RCR | OCR |
| 2019 | $1,339 | $2,319 | $1,739 | $1,225 |
| 2020 | $1,369 | $2,226 | $1,714 | $1,222 |
| 2021 | $1,410 | $2,327 | $1,873 | $1,228 |
| 2022 | $1,540 | $2,311 | $1,970 | $1,354 |
| 2023 | $1,646 | $2,316 | $2,186 | $1,520 |
| 2024 | $1,698 | $2,312 | $2,230 | $1,661 |
| Annualised | 4.86% | -0.06% | 5.10% | 6.28% |
Treasure at Tampines underperforms the broader OCR market, whether comparing 99-year leasehold properties or properties overall.
But it’s worth noting that the early years of a new project are often shaped by developer pricing strategies, rather than by pure resale market forces. In Treasure’s case, much of the initial movement between 2019 and 2021 would have been a reflection of developer pricing movements.
So, for more clarity, let’s focus on Treasure at Tampines’s performance in the resale market
The following are based on subsale and resale transactions from 2024 to June 2025
| Project | Completion year | Tenure | No. of units | Unit mix | Avg size | Avg $PSF | Avg price | No. of tnx |
| MELVILLE PARK | 1996 | 99-years | 1232 | 2, 3 | 1153 | $915 | $1,052,968 | 85 |
| PINEVALE (EC) | 1999 | 99-years | 322 | 3, 4 | 1418 | $1,043 | $1,466,914 | 13 |
| SIMEI GREEN CONDOMINIUM (EC) | 1999 | 99-years | 602 | 3 | 1168 | $1,086 | $1,265,450 | 20 |
| SAVANNAH CONDOPARK | 2005 | 99-years | 648 | 2, 3, 4, 5 | 1426 | $1,088 | $1,537,243 | 39 |
| CHANGI RISE CONDOMINIUM | 2004 | 99-years | 598 | 2, 3, 4 | 1379 | $1,098 | $1,507,243 | 37 |
| EASTPOINT GREEN | 1999 | 99-years | 646 | 1, 2, 3, 4, 5 | 1084 | $1,130 | $1,224,678 | 39 |
| THE EDEN AT TAMPINES (EC) | 2003 | 99-years | 430 | 2, 3, 4 | 1245 | $1,162 | $1,440,708 | 25 |
| TROPICAL SPRING | 2002 | 99-years | 242 | 2, 3 | 1389 | $1,177 | $1,634,347 | 8 |
| MODENA | 2001 | 99-years | 230 | 2, 3, 4 | 1425 | $1,226 | $1,743,333 | 9 |
| THE TROPICA | 2000 | 99-years | 537 | 2, 3, 4 | 1209 | $1,254 | $1,523,278 | 14 |
| SUNHAVEN | 2002 | Freehold | 295 | 2, 3, 4 | 1371 | $1,259 | $1,702,000 | 5 |
| ARC AT TAMPINES (EC) | 2014 | 99-years | 574 | 2, 3, 4 | 1086 | $1,353 | $1,465,860 | 53 |
| DOUBLE BAY RESIDENCES | 2012 | 99-years | 646 | 1, 2, 3, 4, 5 | 1244 | $1,381 | $1,685,844 | 36 |
| THE SANTORINI | 2017 | 99-years | 597 | 1, 2, 3, 4, 5 | 847 | $1,423 | $1,198,678 | 50 |
| Q BAY RESIDENCES | 2016 | 99-years | 630 | 1, 2, 3, 4, 5 | 900 | $1,447 | $1,304,041 | 66 |
| WATERVIEW | 2014 | 99-years | 696 | 2, 3, 4, 5, 6 | 1051 | $1,449 | $1,527,378 | 42 |
| CITYLIFE@TAMPINES (EC) | 2016 | 99-years | 514 | 2, 3, 4, 5 | 1317 | $1,466 | $1,901,308 | 45 |
| THE ALPS RESIDENCES | 2019 | 99-years | 626 | 1, 2, 3, 4, 5 | 784 | $1,496 | $1,166,538 | 51 |
| MY MANHATTAN | 2014 | 99-years | 301 | 1, 2, 3, 4 | 998 | $1,523 | $1,505,444 | 20 |
| THE TAMPINES TRILLIANT (EC) | 2015 | 99-years | 670 | 3, 4 | 1122 | $1,564 | $1,742,980 | 68 |
| THE TAPESTRY | 2021 | 99-years | 861 | 1, 2, 3, 4, 5 | 746 | $1,686 | $1,252,864 | 130 |
| TREASURE AT TAMPINES | 2023 | 99-years | 2203 | 1, 2, 3, 4, 5 | 868 | $1,710 | $1,484,957 | 352 |
Among the projects in Tampines, Treasure stands out in three ways: it is the newest, the largest, and carries the highest average $PSF at around $1,710.
Among the projects in Tampines, Treasure stands out in three ways: it is the newest, the largest, and carries the highest average $PSF at around $1,710. In contrast, most other large-scale condos in the area still transact below $1,500 psf, with many older projects under $1,200 psf.
That said, Treasure’s compact average unit size of 868 sq ft helps to keep overall quantum low: at roughly $1.48 million on average, it remains accessible to most HDB upgraders.
Let’s break this down into the various unit types
The figures below are also based on subsale and resale transactions, from 2024 to June 2025.
1-bedroom units
| Project | Avg $PSF | Avg price | No. of tnx | Avg size (based on units transacted) | Completion year |
| THE SANTORINI | $1,437 | $735,176 | 17 | 512 | 2017 |
| THE ALPS RESIDENCES | $1,565 | $737,491 | 12 | 472 | 2019 |
| DOUBLE BAY RESIDENCES | $1,371 | $737,500 | 2 | 538 | 2012 |
| THE TAPESTRY | $1,712 | $779,379 | 39 | 455 | 2021 |
| Q BAY RESIDENCES | $1,428 | $780,370 | 21 | 551 | 2016 |
| TREASURE AT TAMPINES | $1,704 | $798,309 | 33 | 469 | 2023 |
| MY MANHATTAN | $1,600 | $852,000 | 4 | 533 | 2014 |
| EASTPOINT GREEN | $953 | $862,000 | 1 | 904 | 1999 |

Although Treasure at Tampines has the second-highest average $PSF for one-bedders, its overall quantum remains in the mid-range. This is due to the compact 469 sq ft average.
Ryan J. Ong
A seasoned content strategist with over 17 years in the real estate and financial journalism sectors, Ryan has built a reputation for transforming complex industry jargon into accessible knowledge. With a track record of writing and editing for leading financial platforms and publications, Ryan's expertise has been recognised across various media outlets. His role as a former content editor for 99.co and a co-host for CNA 938's Open House programme underscores his commitment to providing valuable insights into the property market.Need help with a property decision?
Speak to our team →Read next from Editor's Pick
PRO Property Investment Insights This Old Executive Condo Was Once Seen As Too Expensive — 20 Years Later, Has It Become A Value Buy?
PRO Property Investment Insights This Prime Area In Singapore Still Has Condos Under $2M — Despite Nearby Prices Climbing Much Higher
PRO Property Investment Insights This Old Bukit Panjang EC Once Had More Losing Sellers Than Winners — But Look At It Now
PRO Property Investment Insights This “Affordable Central” Neighbourhood Has Outperformed Singapore’s Condo Market Over The Past Decade
Latest Posts
Singapore Property News A 4-Room HDB Flat Just Sold For A Record $1.263 Million In Bishan — Here’s What Buyers Are Paying For
Property Market Commentary Why Some New Condo Owners Struggle To Sell Even After Prices Have Risen
On The Market 5 New Launch Condos That Still Have Two-Bedders Available — Starting From $1.18 Million
0 Comments