Is There A ‘Best’ Time To Buy (Or Sell) Property In Singapore? We Analysed 56,000 Transactions To Find Out

Get The Property Insights Serious Buyers Read First: Join 50,000+ readers who rely on our weekly breakdowns of Singapore’s property market.

A seasoned content strategist with over 17 years in the real estate and financial journalism sectors, Ryan has built a reputation for transforming complex industry jargon into accessible knowledge. With a track record of writing and editing for leading financial platforms and publications, Ryan's expertise has been recognised across various media outlets. His role as a former content editor for 99.co and a co-host for CNA 938's Open House programme underscores his commitment to providing valuable insights into the property market.
In this Stacked Pro breakdown:
- We analysed over 56,000 property transactions to uncover when buyers consistently paid less and sellers walked away with the biggest gains
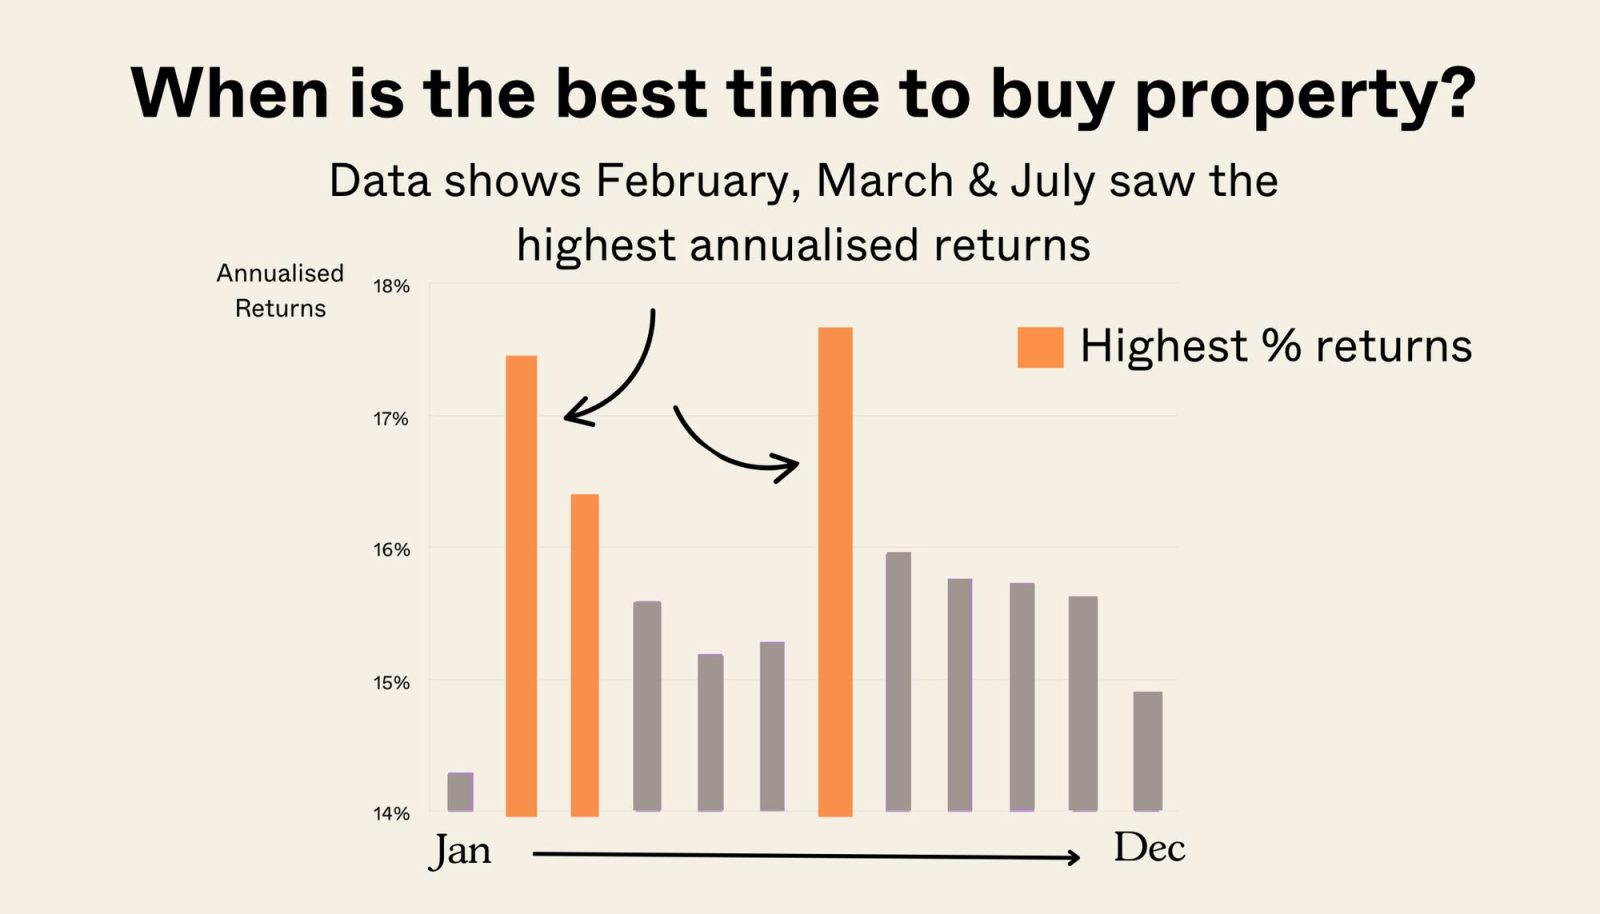
- Our data shows a clear seasonal pattern, with certain months offering a statistically better chance of securing a better deal
- We reveal which quarter consistently tilts the odds in favour of buyers across the Singapore property market
Already a subscriber? Log in here.
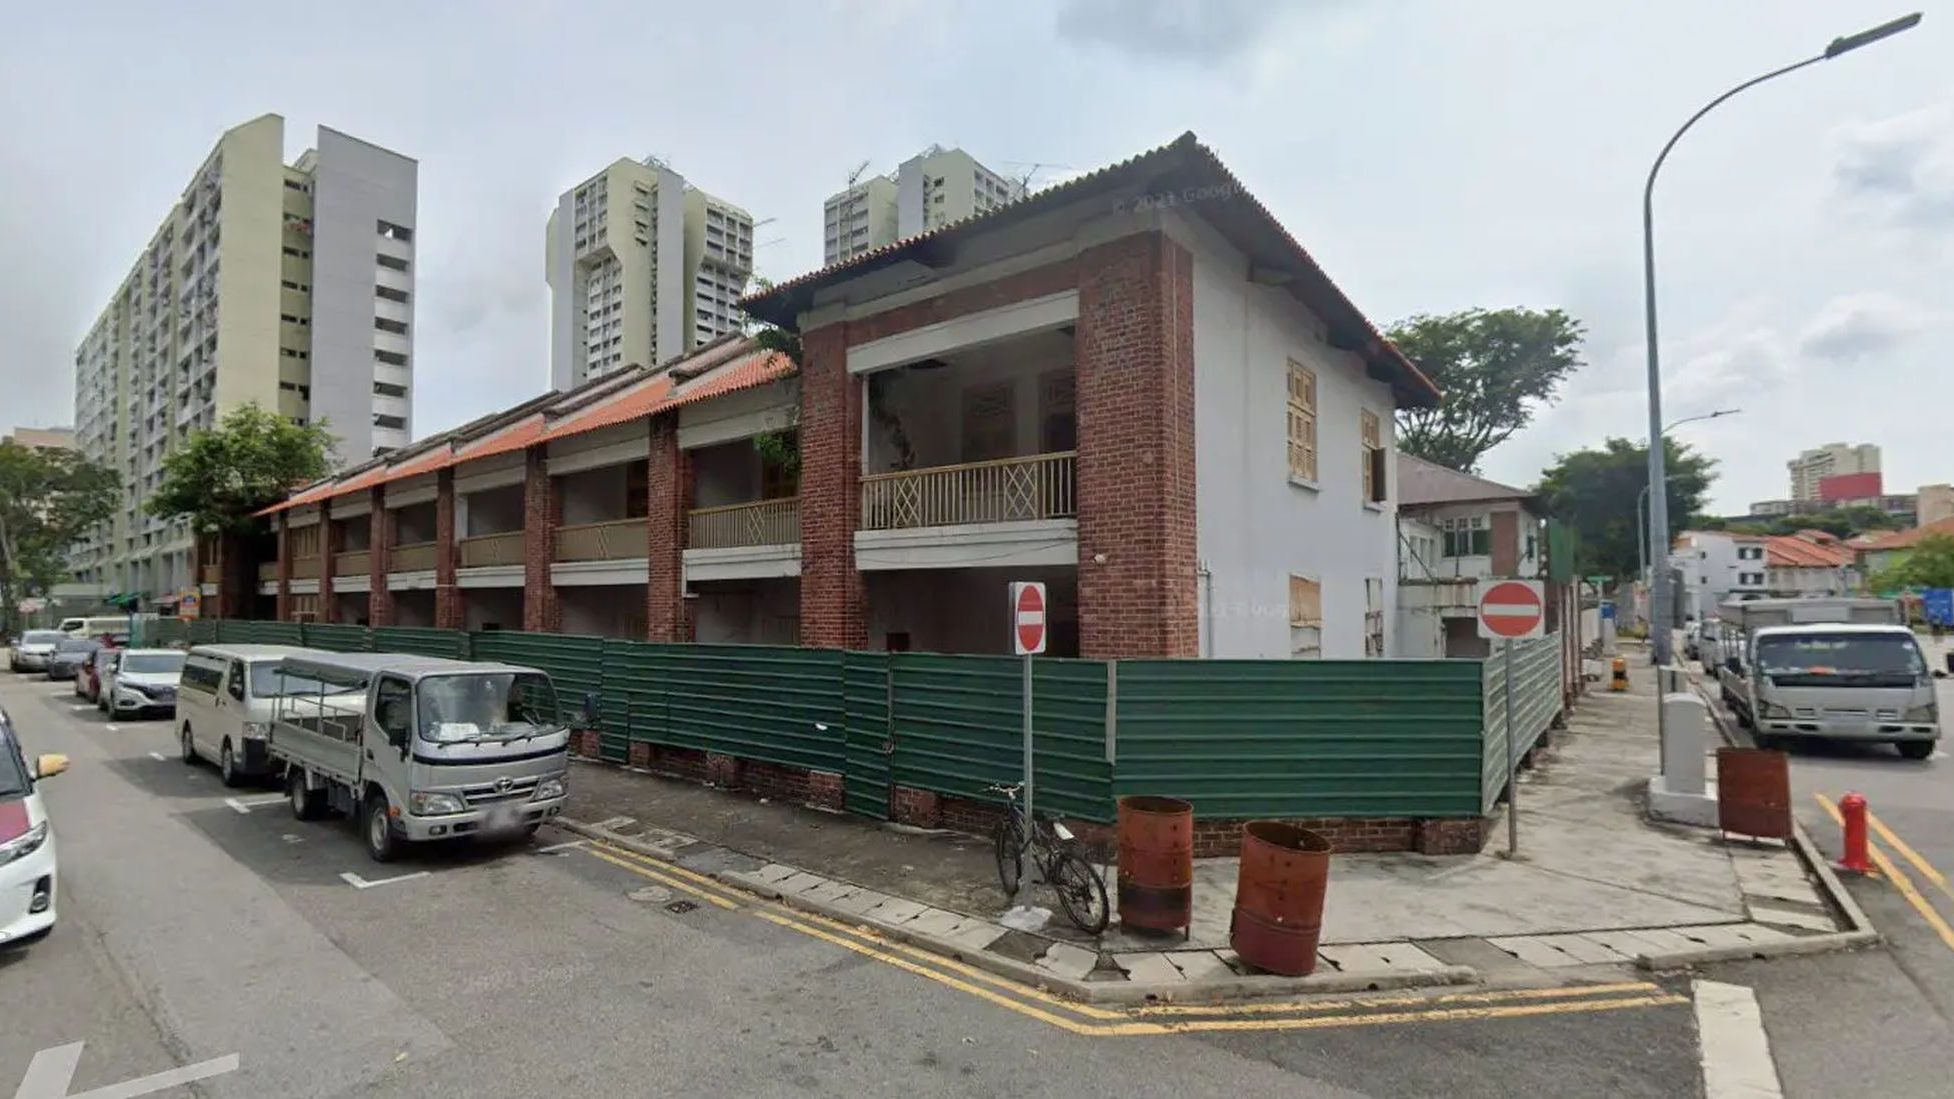
For those familiar with the Singapore property market, certain periods are often considered “dead zones” with little activity—Chinese New Year and the Hungry Ghost Month being prime examples. Some buyers believe prices peak right after these lull periods as demand rushes back, while others argue that the best deals appear at the end of the year when sellers become eager to close deals before December 31. But what do the numbers say?
Examining the Data
To determine the best time of year to buy property at the lowest prices, we analysed historical trends using the Property Price Index (PPI). While the PPI is only available quarterly (not monthly), it still provides valuable insights into price movements over the years.

We categorised each quarter based on how often prices fell or rose. Here’s what we found:
Quarter | Less than -5% | Less than -2.5% | Less than 0% | Less than 2.5% | Less than 5% | More than or equal to 5% |
1Q | 5 | 3 | 11 | 14 | 9 | 7 |
2Q | 3 | 1 | 9 | 19 | 7 | 11 |
3Q | 1 | 6 | 9 | 19 | 5 | 10 |
4Q | 4 | 3 | 11 | 17 | 5 | 9 |
What we’re looking for here is which quarters had more dips, and which had more gains. We’ve summarised it here:
Quarter | Dips | Gains |
1Q | 19 | 30 |
2Q | 13 | 37 |
3Q | 16 | 34 |
4Q | 18 | 31 |
From what we can see, Q2 is when the most gains occur, followed by Q3. This means Q2 is worse for buyers: Q2 sees the fewest dips and the highest number of gains, indicating that prices tend to rise during this period.
This aligns with market activity ramping up after the first quarter. In particular, only four times has Q2 brought about a change of less than -2.5 per cent, compared to Q1 (eight times), Q3 (seven times), and Q4 (seven times).
Q1 and Q4 show the most price dips. Speculatively, this may be due to the post-Chinese New Year period when the property market sees a lull in Q1. As for Q4, it may simply be that sellers look to close deals before December.
Q3 also has a high number of gains, which is possibly due to a rebound in demand after the 7th Month.
So logically, buying in Q1 would be good as you have a better chance of getting a lower price. Conversely, selling would be better done in Q2, when you have a better chance of getting a higher price.
In theory, this makes it better to buy between January to March, but sell between April to June.
That said, there may be some criticism that all this is based on the PPI since 1975. This is a rather long time, and some may assert that – with changes like cooling measures, Sellers Stamp Duty (SSD), and so forth – the same pattern may not recur in more recent years.
So, to rectify this, we’ll look at the year 2011 onwards.
We’ve chosen this year because that was when SSD was introduced. This could make an impact, as SSD rates (even if they’ve changed a bit over the years) have the same effect of discouraging home flipping.
More from Stacked
This New EC Will Have 3-Bedders Priced From $1.29m: What You Need To Know About Novo Place
Tengah is a new town, so there will be a lot of “firsts” over the coming years. At the helm…
Here are the results from this period:
Quarter | Less than -1% | Less than 0% | Less than 1% | Less than 2% | Less than 3% | Less than 4% | Less than 5% | More than 5% |
1Q | 4 | 3 | 3 | 1 | 2 | 1 | ||
2Q | 5 | 3 | 4 | 2 | ||||
3Q | 2 | 1 | 7 | 2 | 1 | 1 | ||
4Q | 5 | 4 | 1 | 1 | 1 | 1 | ||
Total | 6 | 14 | 17 | 8 | 4 | 3 | 2 | 1 |
And as before, we’ll compare the dips and rises across the quarters:
Quarter | Dips | Gains |
1Q | 7 | 7 |
2Q | 5 | 9 |
3Q | 3 | 11 |
4Q | 5 | 8 |
Updated Insights (Post-2011)
Q1 still has the most notable price dips, making it favourable for buyers. Q2 and Q4 don’t have any changes less than -1 per cent. However, Q2 isn’t the strongest this time around, in terms of the number of positive changes. Q3 looks stronger this time around, which reinforces the idea of demand recovery right after the 7th Month.
To be fair, there aren’t as many cycles between 2011 to 2025. But it remains clear that Q1 remains the best bet for buyers.
Now let’s look at the magnitude of gains and losses
Quarter | Gain | Loss |
1Q | 1.85% | -0.79% |
2Q | 1.57% | -0.47% |
3Q | 1.06% | -1.03% |
4Q | 1.78% | -0.63% |
Q1 tends to gain the least and also lose the most. However, we should caution that Q1 also sees the biggest gains, on occasions when they happen!
Next, we look at the profit and losses of actual transactions.
What we want to see is this: will buyers who sell in Q2, but buy in Q1, make more?
After all, if our formula works, this should be the way to go when planning property purchases and sales. So let’s look at the specific month properties were bought and sold, versus their profits:

Here, 56,300 transactions were considered. We can see some interesting patterns emerging here: those who sold between January to March did the worst, while those who sold between July to December did better.
This reinforces the patterns we’ve seen on a quarterly basis.
But what if we look only at resale, to prevent the data from being skewed by new launches?
Admittedly, a new launch on any given month could skew prices, as it attracts a large number of transactions at one go. So to address this, we looked at prices while only considering resale transactions:
To avoid prices being skewed since new launches can attract a large number of transactions in a particular launch, we’ll only look at resale-to-resale transactions as this better reflects the market conditions

In total, 21,580 transactions were considered.
Again, those who bought in Q1 tended to do well: they saw 22 transactions above the 50 per cent mark of all gains:
All sales | |||||
By quarter | Buy Quarter | ||||
Period | 1Q | 2Q | 3Q | 4Q | |
Sell Quarter | 1Q | 15.2% | 14.4% | 15.0% | 14.3% |
2Q | 15.8% | 15.6% | 17.2% | 15.3% | |
3Q | 16.7% | 15.7% | 16.7% | 16.3% | |
4Q | 16.6% | 15.7% | 17.3% | 16.0% | |
Just resales | |||||
Buy Quarter | |||||
Period | 1Q | 2Q | 3Q | 4Q | |
Sell Quarter | 1Q | 16.9% | 15.7% | 15.7% | 15.2% |
2Q | 18.2% | 16.9% | 18.5% | 16.6% | |
3Q | 18.9% | 17.6% | 16.9% | 17.3% | |
4Q | 20.0% | 17.1% | 17.9% | 16.7% |
February to April performed better when we only factor in resale, but buying in January shows good profits (provided the property wasn’t sold before May).
Now here’s the proportion of gains over all transactions, broken down by month of purchase and sale. This includes even new sale and sub sale transactions.

Overall, buying around December to January has historically been the least favourable, while February, March, and July have shown stronger outcomes for buyers. Consistent with earlier observations, Q1 tends to be the toughest quarter for sellers.
While it’s tough to draw a conclusion based on just 14 years of data, there is a useful pattern.
That said, no trend holds forever. Market factors like interest rates, new government policies, or global economic shifts can change things quickly. So while the trends offer helpful guidance, timing alone shouldn’t be the only factor in your property decisions.
The bigger challenge for most buyers today isn’t timing the market—it’s cutting through the noise to identify real value and long-term potential.
At Stacked, our property consultants apply the same data-driven approach to help clients navigate these decisions confidently. We’ve worked with over 300 clients to secure homes that outperformed the market.
If you’re exploring a move and want to understand how these insights apply to your personal situation, book a consult with us.
Ryan J
A seasoned content strategist with over 17 years in the real estate and financial journalism sectors, Ryan has built a reputation for transforming complex industry jargon into accessible knowledge. With a track record of writing and editing for leading financial platforms and publications, Ryan's expertise has been recognised across various media outlets. His role as a former content editor for 99.co and a co-host for CNA 938's Open House programme underscores his commitment to providing valuable insights into the property market.Read next from Property Investment Insights

Property Investment Insights Why Kingsford Hillview Peak Underperformed—Despite Its MRT Location And “Good” Entry Price

Property Investment Insights Singapore Property Data Is Transparent: But Here’s Why It Can Still Mislead You

Property Investment Insights Why Marina Bay Suites May Look Like a Poor Performer—But Its 4-Bedroom Units Tell a Different Story

Property Investment Insights Why This 40-Year-Old Leasehold Condo Beat Newer Developments: A Case Study Of Loyang Valley
Latest Posts

Property Market Commentary I Reviewed HDB’s 2 And 3-Room Show Flats: Ideal For First-Time Buyers Or Too Small To Live In?

Editor's Pick Buying Property In Malaysia As A Singaporean: 6 Key Restrictions To Be Aware Of

Editor's Pick Why Punggol Northshore Could Be The Next Hotspot In The HDB Resale Market

Singapore Property News 9,800 New Homes Across 11 GLS Sites In 2H 2025: What To Know About Tanjong Rhu, Dover, And Bedok

Singapore Property News Why HDB Needs To Build More 4 Bedroom Flats

Homeowner Stories “If We Sell, We’ll Never Have A Home This Big Again”: What Singaporean Parents Do After The Kids Move Out

Property Advice How Much Is Your Home Really Worth? How Property Valuations Work in Singapore

On The Market 5 Cheapest Convenient 1-Bedders Near Integrated Developments From $800k

Property Advice Why I Had Second Thoughts After Buying My Dream Home In Singapore

Editor's Pick 50 New Launch Condos With Balance Units Remaining In 2025 (From $1,440 PSF)

Singapore Property News This West-Side GLS Plot Just Got A $608M Bid And 6 Bidders: Why Lakeside Drive Bucked The Trend

Editor's Pick Touring A Rare Stretch of Original 2-Storey Freehold Terrace Homes At Joo Chiat Place From $3.02m

Singapore Property News The 1KM Primary School Rule In Singapore: Fair Game Or Property Power Play?

Singapore Property News 1,765 Punggol Northshore HDB Flats Reaching MOP: Should You Sell Quickly or Wait?

Editor's Pick Love Without A BTO Flat: The Tough Housing Choices Facing Mixed-Nationality Couples In Singapore
