


While most people can grasp basic concepts like “good location” or “good facilities”, the top gainers are almost always a surprise. Some of them can seem old and worse for wear, yet top the charts. Others can be in a prestigious location like Sentosa, and end up at the bottom of the pile. Here’s a look at some of the top gainers recently, and what they have in common:
One of the most profitable property transactions in 2021 was an ageing condo
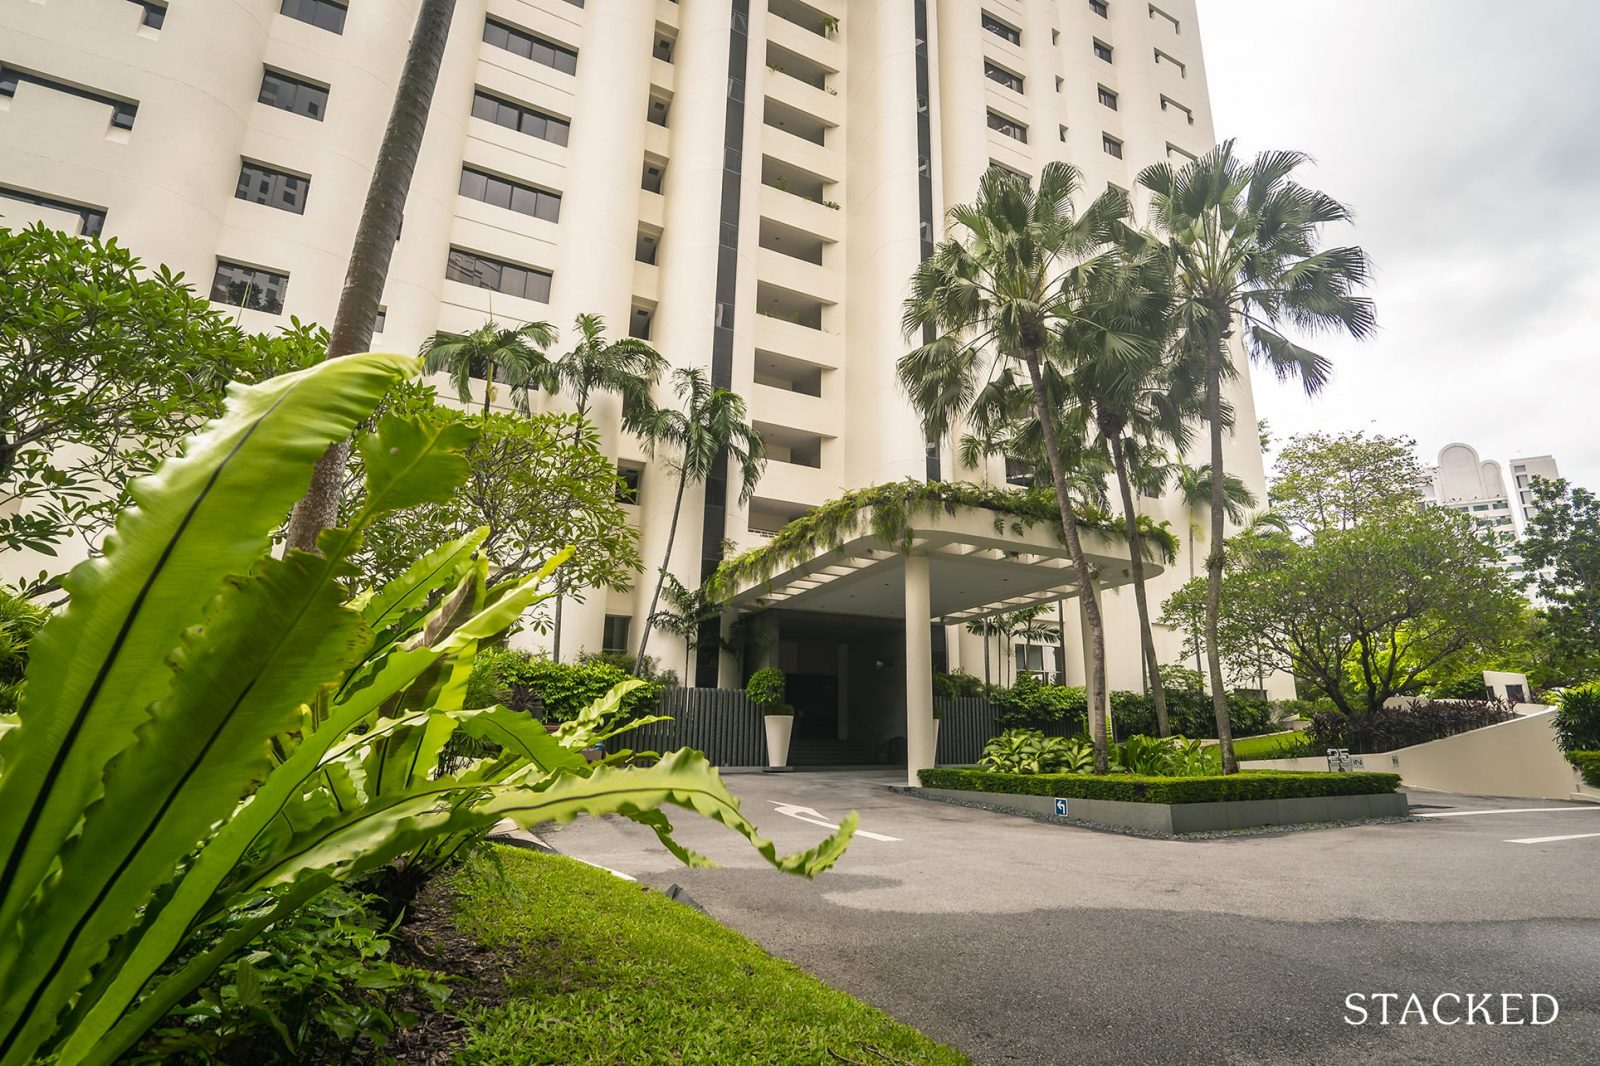
This was a transaction at Yong An Park, an old (built 1986) but freehold condo along River Valley Road. This was for a 6,576 sq. ft. penthouse unit. Now while it’s not surprising that a huge penthouse unit would sell for a high quantum, what’s impressive is the net gain:
The unit was bought for $578 psf in May 2000, but sold for $1,901 psf in September 2021.
The sale price was $12.5 million, with a profit of $8.7 million. This comes to an annualised return of 5.7 per cent per annum. Note that the norm for most residential properties, bought within the past decade, is between two to three per cent.
That’s an outstanding performance, from a development that many would have glossed over due to its age.
The top gainers may not be the shiny, iconic condos we expect
For example, one of the top gainers to date is a penthouse unit at Golden Mile Complex. It was just 926 sq. ft. (smaller than a 4-room flat). Many of the top gainers – by percentage – are also properties that you wouldn’t look at twice if you walked past.
Likewise, there can be condos in high-profile locations, that actually end up being among the top losers.
Feel free to sort the table by its column.
No rows match your search.Orchard Scotts $3,680,000 2,336 21 Oct 2013 15 Feb 2017 99 yrs from 08/11/2001 -$4,776,653 -56.5% Bedok Shopping Complex $340,000 1,216 29 Jan 2013 19 Oct 2021 60 yrs from 01/03/1977 -$440,000 -56.4% Turquoise $4,400,000 3,746 11 Jul 2007 9 May 2018 99 yrs from 12/03/2007 -$5,132,280 -53.8% The Coast At Sentosa Cove $5,300,000 4,779 16 Aug 2007 10 Jul 2020 99 yrs from 11/04/2006 -$6,169,600 -53.8% Archipelago* $525,000 829 4 Oct 2018 22 Jul 2021 99 yrs from 01/06/2011 -$575,000 -52.3% Turquoise $2,900,000 2,185 29 Oct 2007 7 Aug 2015 99 yrs from 12/03/2007 -$3,138,490 -52.0% Seascape $6,200,000 4,069 28 Jun 2010 2 Jul 2017 99 yrs from 09/06/2007 -$6,600,000 -51.6% Seascape $3,100,000 2,336 26 Mar 2010 23 May 2019 99 yrs from 09/06/2007 -$3,165,000 -50.5% The Azure $3,600,000 3,165 29 Oct 2007 29 Mar 2021 99 yrs from 03/01/2005 -$3,600,000 -50.0% Reflections At Keppel Bay $3,339,630 3,078 5 Apr 2007 12 Jun 2018 99 yrs from 15/03/2006 -$3,297,870 -49.7% Reignwood Hamilton Scotts $7,188,888 2,756 6 May 2013 12 Feb 2020 Freehold -$6,591,112 -47.8% Seascape $5,800,000 4,133 21 Dec 2011 29 May 2015 99 yrs from 09/06/2007 -$5,200,000 -47.3% Reflections At Keppel Bay $5,850,000 3,854 5 Aug 2008 21 Jul 2020 99 yrs from 15/03/2006 -$4,820,400 -45.2% Helios Residences $8,400,000 4,629 27 May 2014 11 May 2020 Freehold -$6,100,000 -42.1% The Marq On Paterson Hill $10,280,000 3,089 17 Sep 2012 20 Dec 2017 Freehold -$4,920,000 -32.4% Boulevard Vue $12,500,000 4,478 10 Jul 2009 27 Apr 2015 Freehold -$4,796,500 -27.7% Nassim Park Residences $18,800,000 6,954 4 May 2011 22 May 2019 Freehold -$5,311,500 -22.0% Ardmore Park $27,650,000 8,740 1 Jan 1998 24 Apr 2020 Freehold $11,650,000 72.8% Four Seasons Park $17,880,000 6,157 6 Nov 2002 16 Dec 2019 Freehold $8,880,000 98.7% Nassim Jade $11,700,000 5,038 19 Oct 2005 27 Nov 2020 Freehold $6,050,000 107.1% The Claymore $17,000,000 4,919 23 Mar 2002 13 Apr 2020 Freehold $9,000,000 112.5% The Balmoral $12,000,000 7,642 28 Sep 1995 30 Sep 2013 Freehold $7,300,000 155.3% Juniper At Ardmore $15,000,000 6,006 8 Aug 2005 27 Jan 2021 Freehold $9,400,000 167.9% Nassim Mansion $10,000,000 3,520 20 Nov 2003 5 Jun 2018 Freehold $6,500,000 185.7% Yong An Park $10,100,000 6,695 22 Dec 2004 10 Jun 2020 Freehold $6,800,000 206.1% Yong An Park $12,500,000 6,577 5 Jan 2000 3 Sep 2021 Freehold $8,700,000 228.9% Lien Towers $8,400,000 5,070 16 Jul 2001 25 Jun 2021 Freehold $6,350,000 309.8% N.A. $1,500,000 1,442 17 Jul 2003 9 Oct 2018 Freehold $1,181,000 370.2% Thong Sia Building $3,350,000 1,970 14 Feb 1996 1 Jul 2014 Freehold $2,640,000 371.8% Pearl Bank Apartment $1,328,000 1,324 18 Jan 2005 4 Sep 2012 99 yrs from 02/06/1970 $1,048,000 374.3% Keng Lee Court $1,180,000 1,055 10 May 2006 18 Mar 2013 Freehold $940,000 391.7% 336 River Valley $3,843,072 1,561 22 Jan 2007 4 Jul 2018 Freehold $3,073,072 399.1% N.A. $705,000 1,040 19 Apr 2006 23 Jan 2018 9999 yrs from 01/01/1957 $570,000 422.2% Petain Rd/Tyrwhitt Rd Conservation Area $4,500,000 1,510 30 Aug 2006 5 Sep 2019 999 yrs from 31/10/1919 $3,715,000 473.2% Balestier Towers $2,608,000 1,410 29 Jun 2006 8 Jul 2014 Freehold $2,163,000 486.1% 336 River Valley $5,000,000 1,539 2 Aug 2001 4 Jul 2018 Freehold $4,240,000 557.9% Golden Mile Complex $940,000 926 10 Dec 2004 11 Oct 2012 99 yrs from 04/08/1969 $830,000 754.5%
What are some shared traits of top gainers (or some top losers?)
- Small developments, often old and freehold
- Top gainers and losers can be in prestigious areas
- For top gains by percentage, the quantum is comparable or less than a landed home
- Holding period plays a noticeable role
- Recent gains may be a result of trends rather than fundamentals
1. Small developments, often old and freehold
If we look at top gainers by quantum, all the condos are freehold. The newest of these developments, Ardmore Park, dates back to 2001, while Nassim Jade is the next newest (1997).
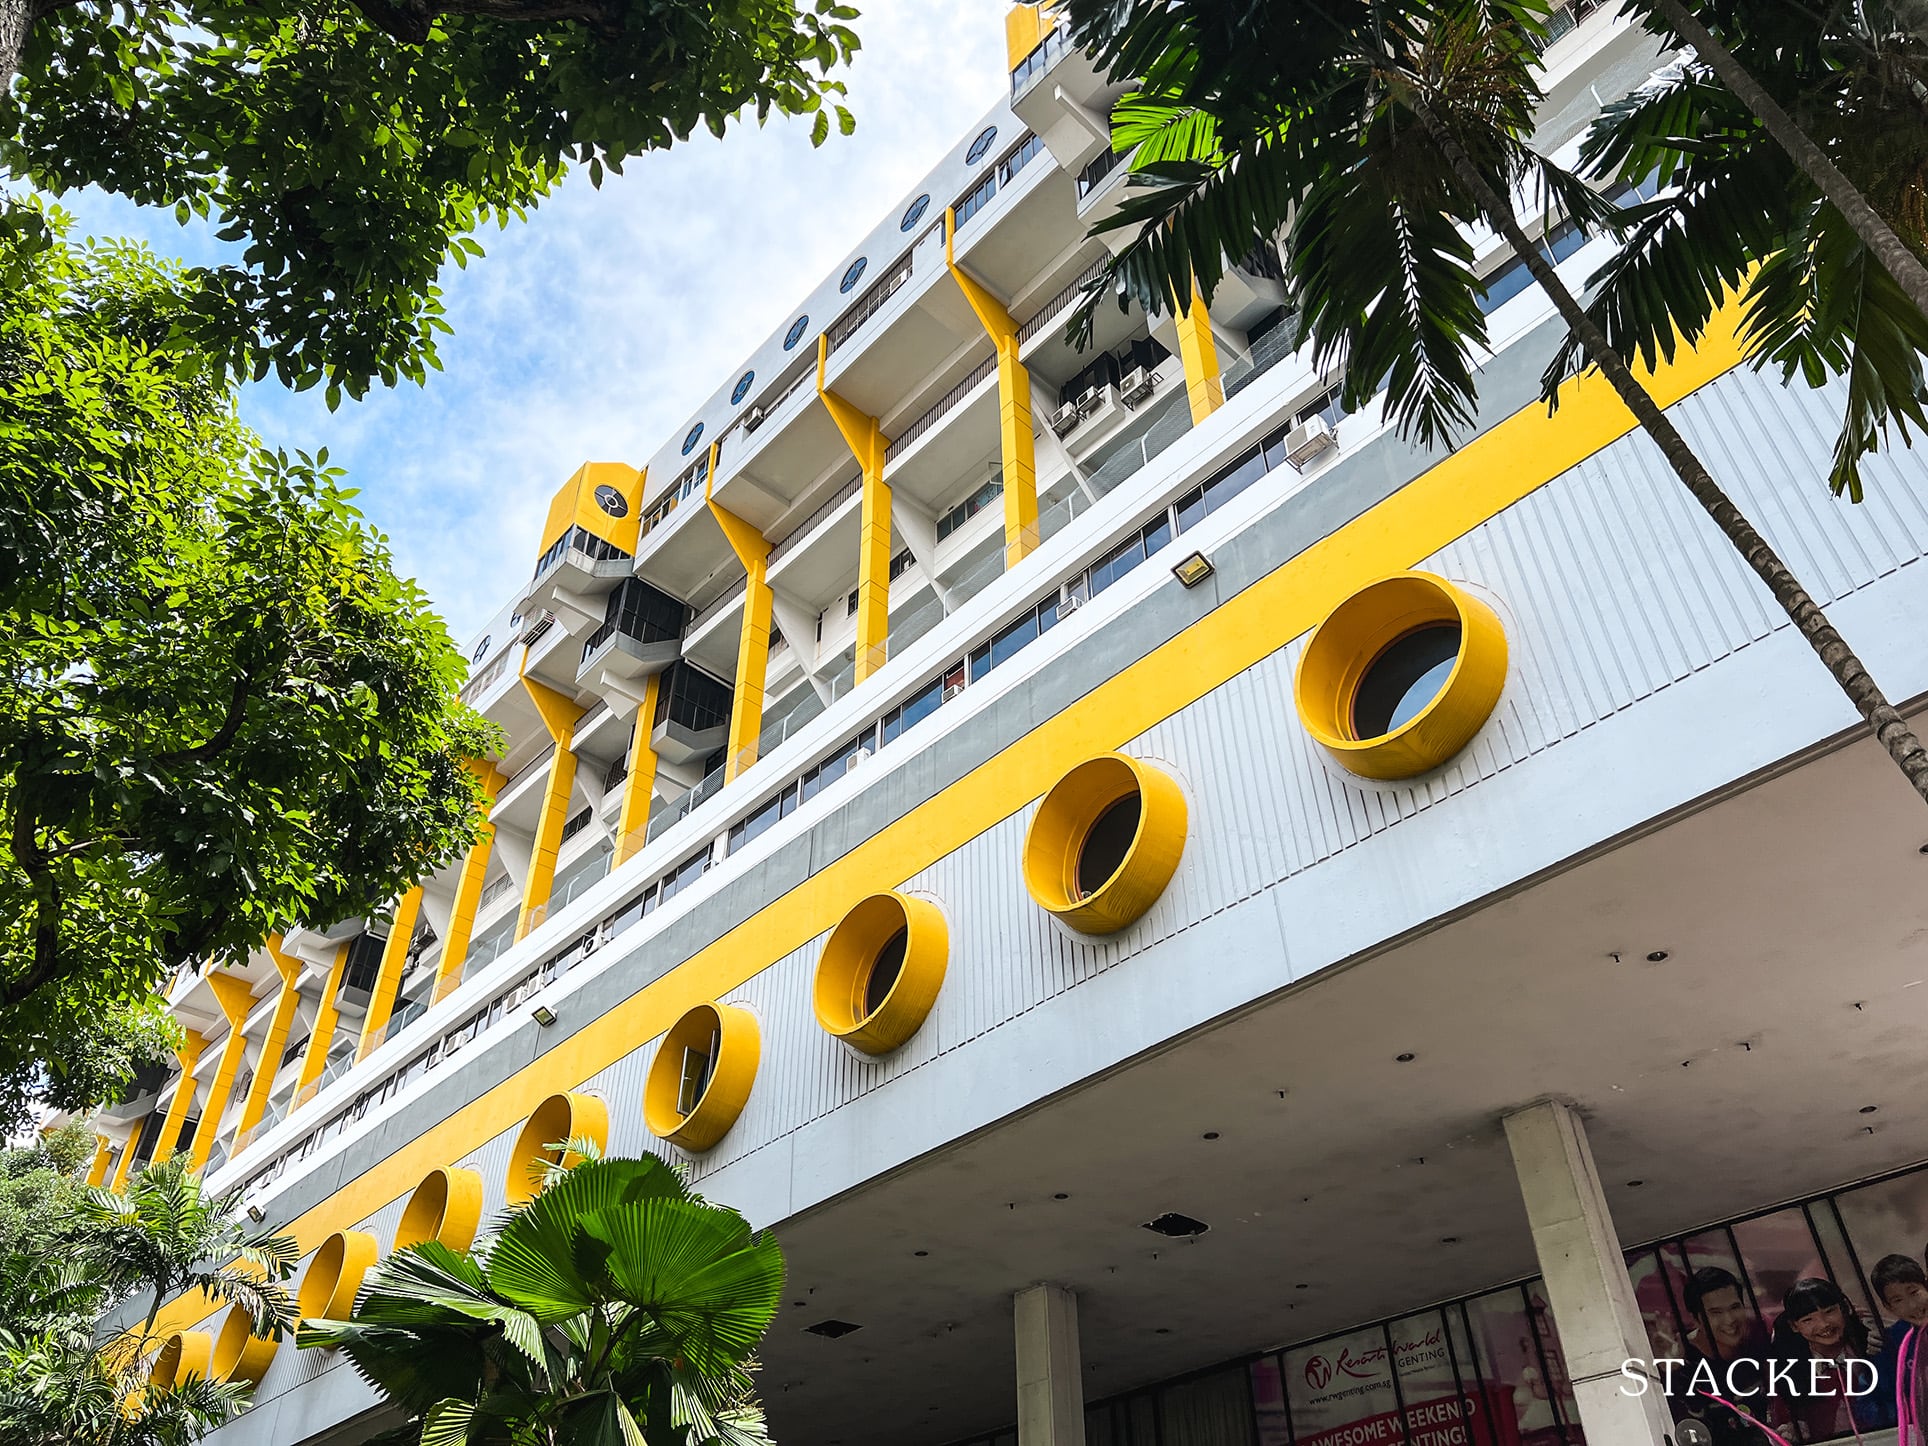
Among top gainers by percentage, the units are mostly freehold or 999-years (which is effectively similar). Only Golden Mile Complex is 99-years, and we note that Golden Mile was recently gazetted for conservation. Among this batch, the newest condo is Balestier Towers, which goes back to 1991.
Likewise, all the top gainers are in small or boutique developments. Yong An Park, which just made the news, is among the largest on the list at 288 units – a number considered small by today’s development standards. Four Seasons Park is the next smallest, at 202 units.
Beyond that, the top gainers typically have fewer than 100 units. Lien Towers, for instance, has only 24 units.
This clarifies, unsurprisingly, that buyers of penthouse units are mainly looking for exclusivity; and that “investment-worthy” penthouses are much harder to find in 500+ unit developments.
2. Top gainers and losers tend to be in prestigious areas
All the top gainers tend to be in districts 7, 9, and 10; no surprise there.
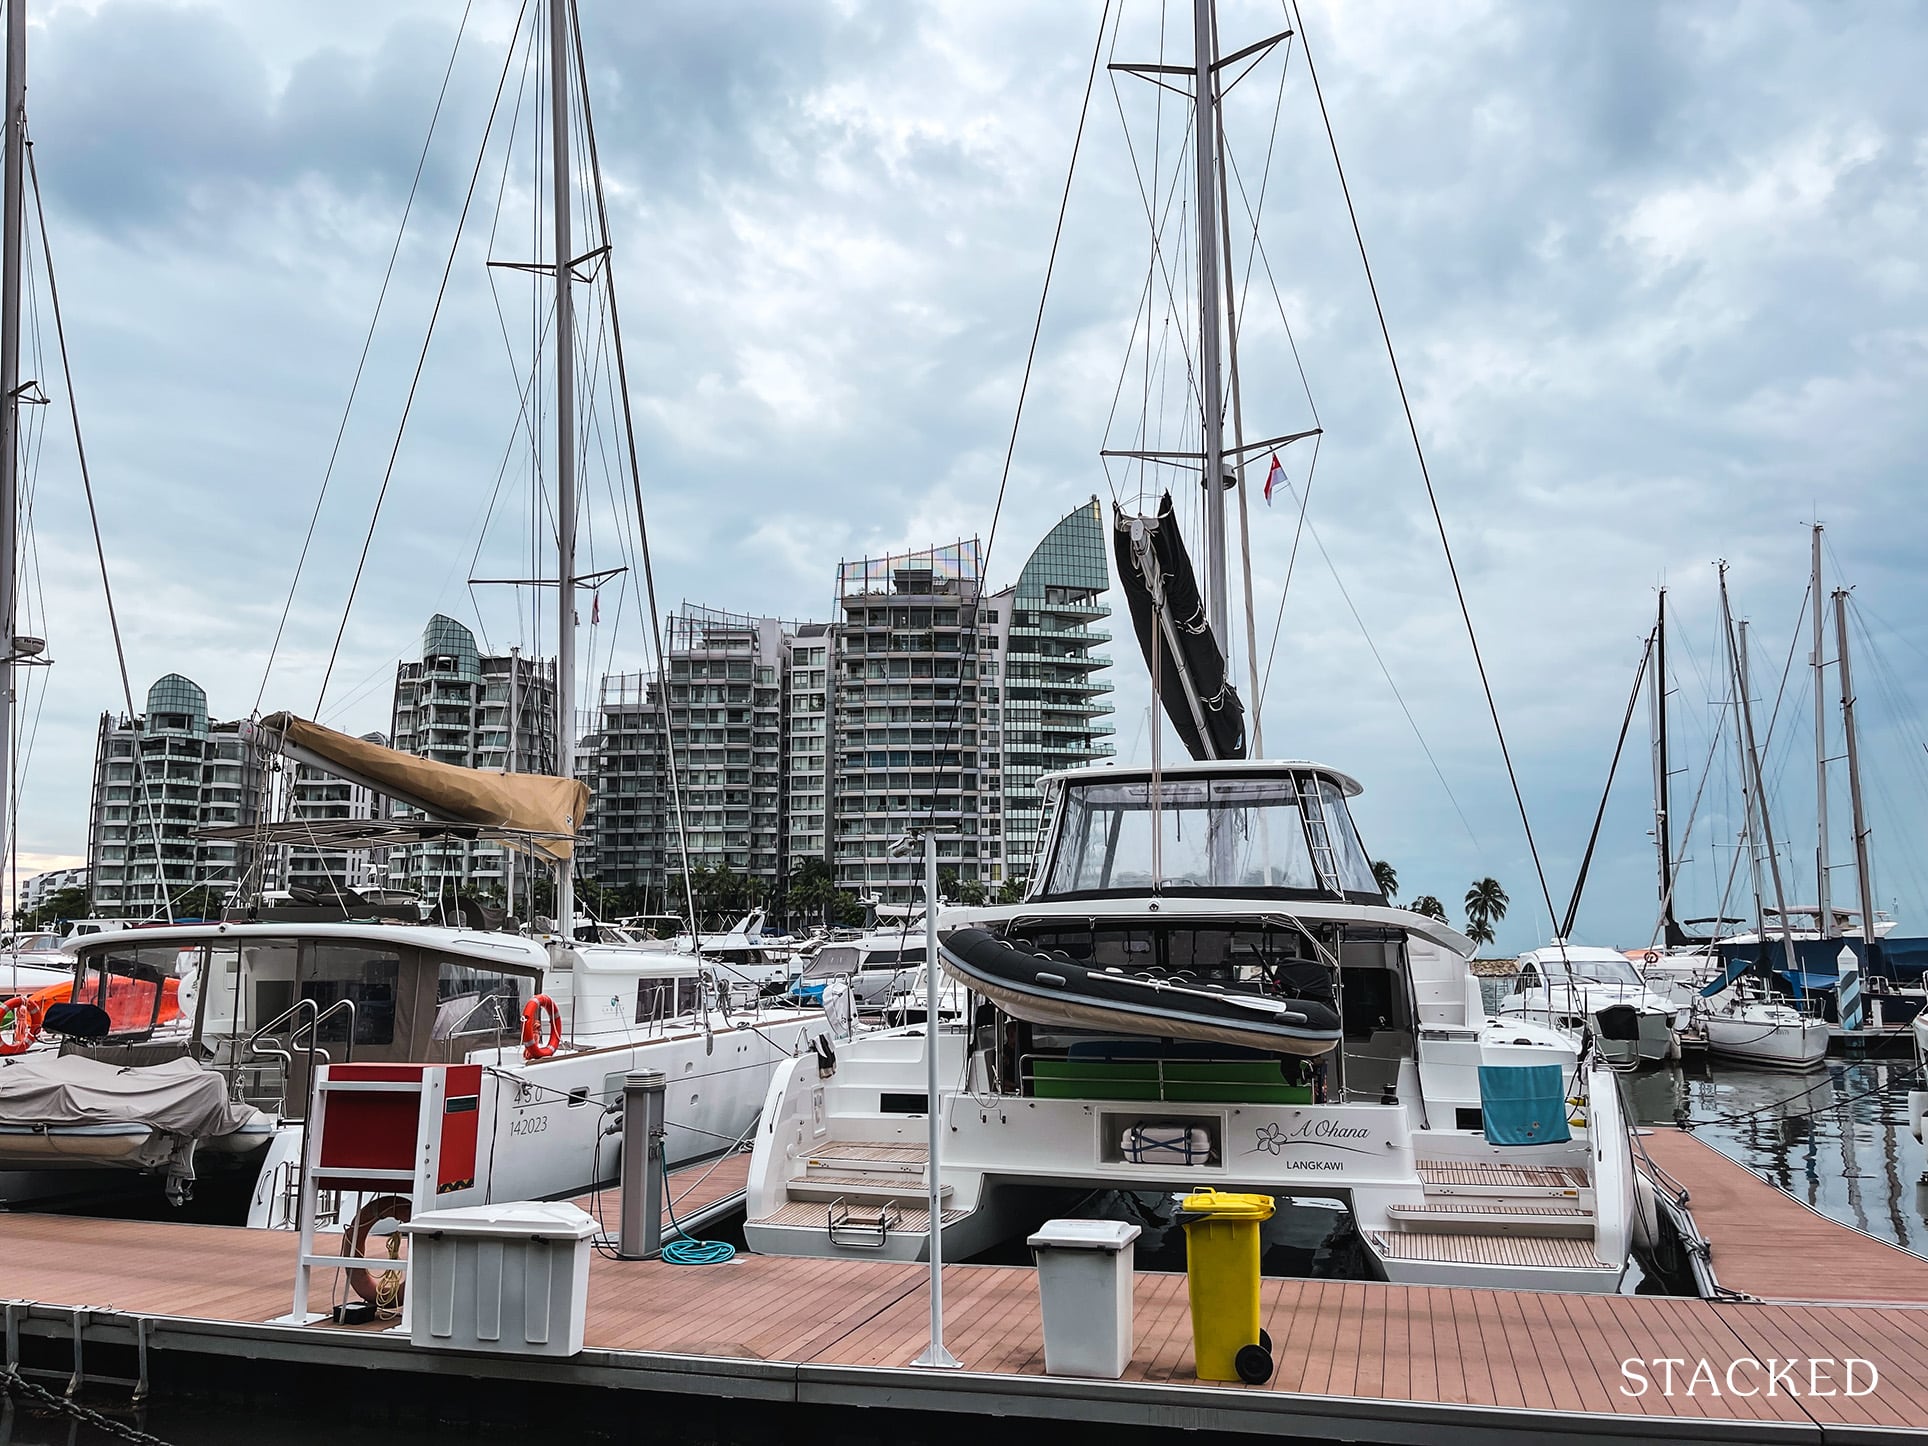
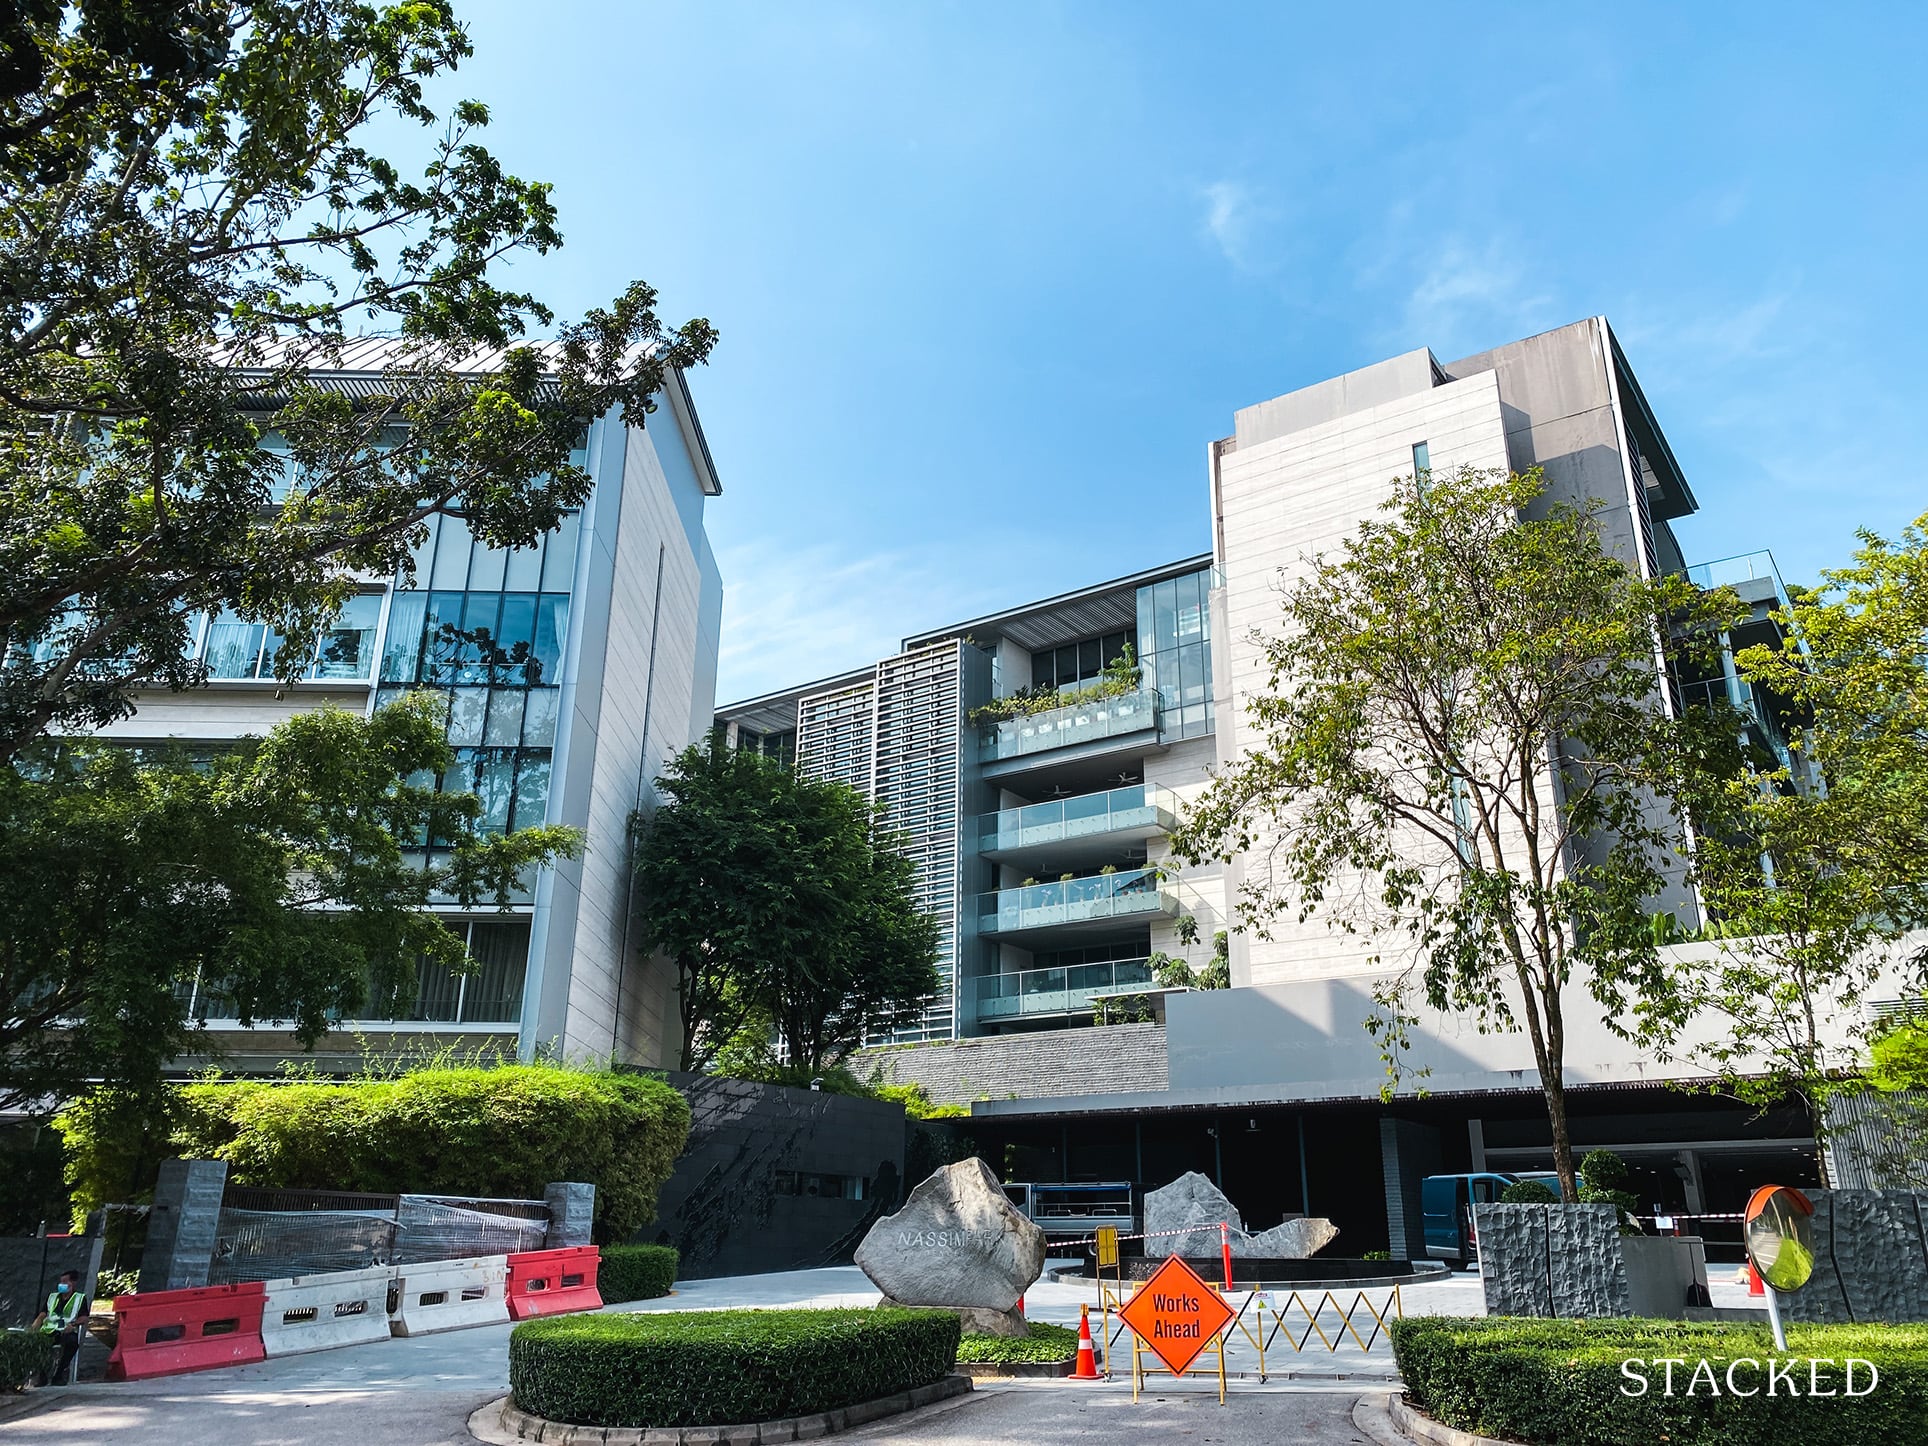
But conversely, almost all of the worst losses seem to be clustered in District 4 (Keppel, Mount Faber, Sentosa); an area that most Singaporeans would consider prestigious too.
This could be due to the decade long stagnation of Sentosa; or it could be because, at the price of a penthouse, buyers in that area would rather a landed property in Sentosa. Turquoise, Reflections at Keppel Bay, and Seascape – all on the highest losses list – are within the Sentosa area.
While Districts 9 and 10 have their share of losing transactions, note that only one (Orchard Scotts) is among the top losers by percentage.
Some of the more contrarian strategies in the past five years, such as buying spacious penthouse units in OCR condos, or buying in Sentosa Cove believing prices had “bottomed out”, don’t seem to have paid off.
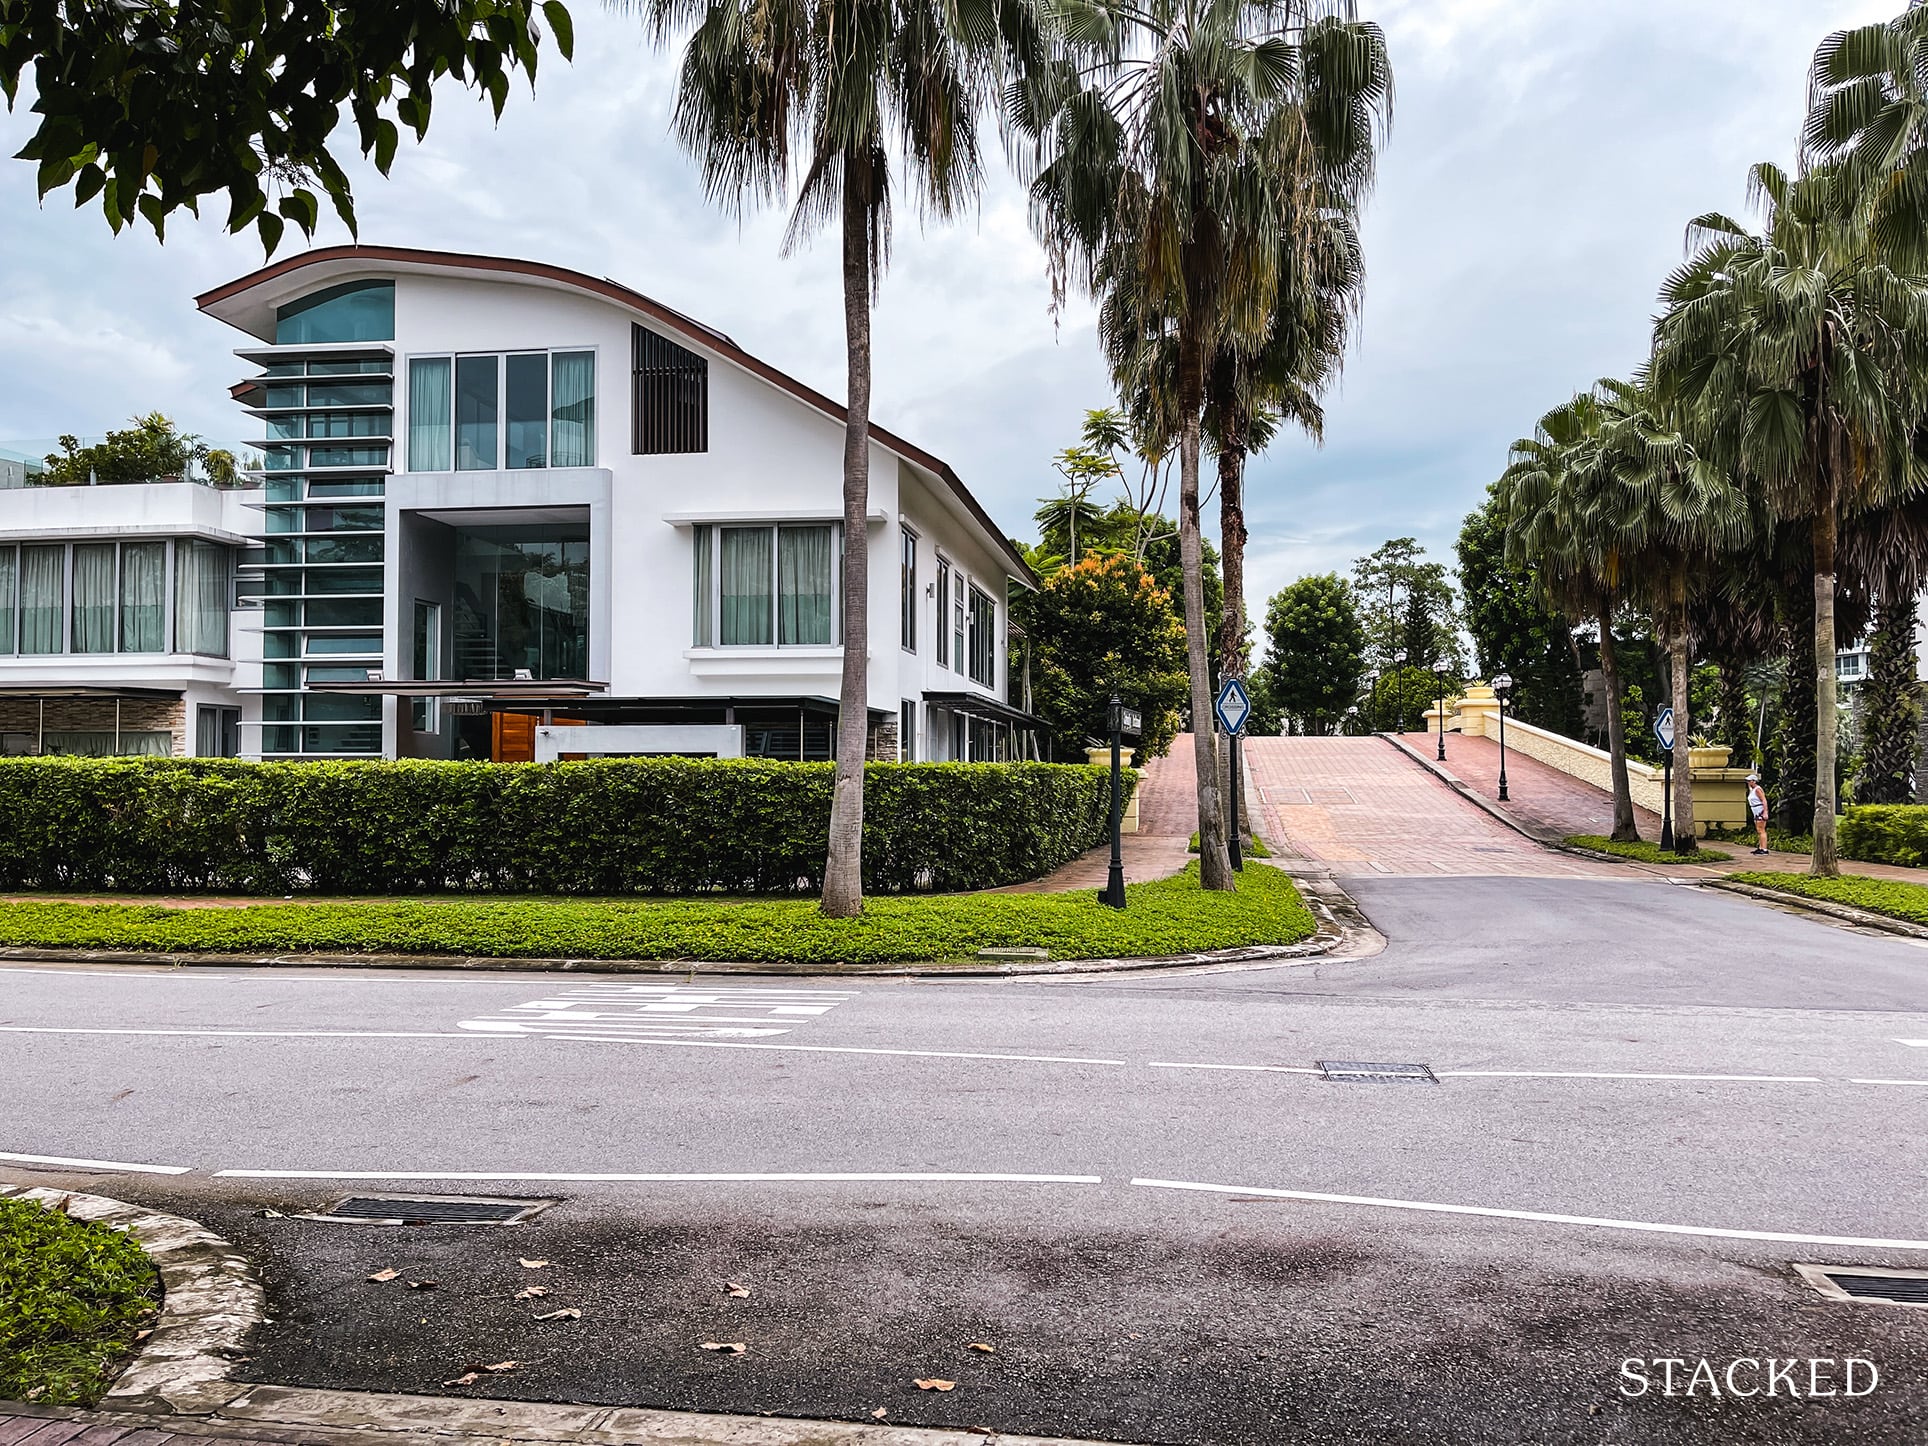
3. For top gains by percentage, the quantum is comparable or less than a landed home
In 2021, the average transaction price for landed (freehold) properties is $4.9 million, island-wide. The majority of top winners, by percentage, have a quantum below this amount.
Golden Mile Complex, for instance, shows the highest percentage gain at 754.5 per cent. However, the transaction price is a mere $940,000; lower than even most mass-market condos. 336 River Valley, the next highest by percentage gain (around 558 per cent), costs $5 million; on par with the average for a landed home.
This could be attractive to some buyers, who want to see comparable spaciousness and luxury, but at a fraction of landed housing costs. Note that most of the top gainers – barring exceptions like Golden Mile – tend to be huge, some exceeding 2,000 sq. ft.
That said, this doesn’t hold true for the top gainers by sheer quantum, which has costs that are comparable to true landed properties.
4. Holding period plays a noticeable role
Jaw-dropping, million-dollar losses are mostly due to short holding periods. For example, in the $4.77 million loss of the Orchard Scotts unit, the original purchase was in October 2013, while the sale was in February 2017.
Some of the top losses did have holding periods of 10 years or more; but in general, it was the quick resales that tended toward bigger losses.
Likewise, you can see that all the top gains are all from the older condos, with the earliest purchase date in the year 2005. The property market has been boosted leaps and bounds since then and it does show that time in the market will always be better than timing the market.
That said, it's important to note that the gains you'd have seen from the past will unlikely ever be repeated again. It's due to a combination of reasons, but a major one would definitely be the various cooling measures placed on the market.
5. Recent gains may be a result of trends rather than fundamentals
While the Yong An Park transaction was an eye-opener, it’s worth considering the context: since last year, practically every segment of the property market has been on the rise.
It’s hard to isolate its location or size as a factor and use it as an argument for or against this specific unit type. That said, we mentioned above that several top gainers have the spaciousness of landed properties but transact at much lower.
There is an ongoing trend for larger units, as the bulk of buyers today are often HDB upgraders (family units prefer at least 1,000+ sq. ft.)
Other contributing factors are a record-low interest rate, and interest in Districts 9 and 10 as safe havens in the Covid storm.
Nonetheless, recent transactions show penthouse units can be more than just indulgences
Small developments, long-term commitment, and a willingness to consider older properties appear to be important, with regard to the top gainers.
Nonetheless, we can’t ignore that many top gainers are large, high-quantum properties. Also, they are often small or boutique projects, which means you need to contend with a much higher maintenance fee on average.
It’s an old irony, but it’s true that you need to have money to make money. Many of the top gainers are not units that would have been within reach of the average buyer.
You can consult one of our experts at Stacked for more details. For alternatives, you can also check out our in-depth reviews of new and resale condos alike.


0 Comments