


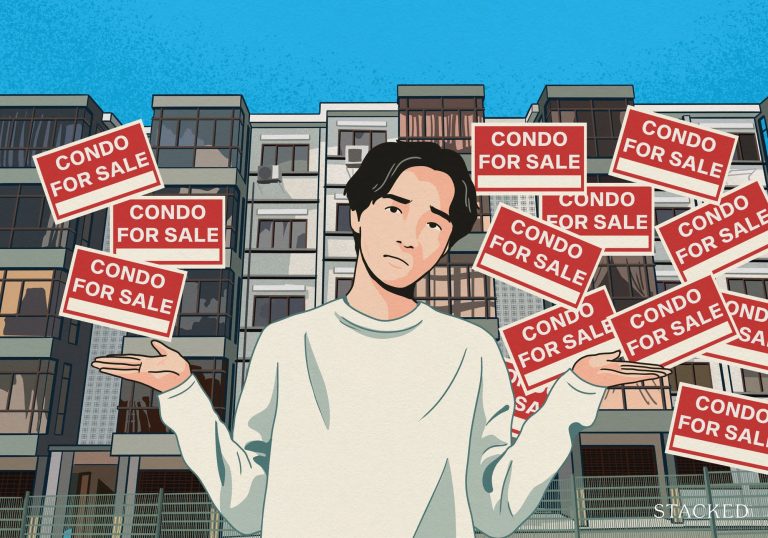


As we reach the end of Q3 2023, more homes are finally being finished, and new cooling measures are starting to bite. This will no doubt have an effect on sales eventually, but for now, it seems as if those who bought earlier for the first batch of new launches from 2017/18 will be happy with their decisions indeed.
From the superior performance of larger units to the unexpected edge of subsales over resales within a four-year holding period, the insights here may provide both buyers and sellers with useful context for their next move.
Dive in as we explore the metrics, delve into the nuances of District 5’s top performance, and understand the subtle differences in gains across various floor levels. Whether you’re an investor, a first-time buyer, or just keenly interested in property trends, this review offers a detailed snapshot of the current condo market landscape.
Here are the profitable ones so far:
The challenge for many buyers today isn't access to information.
It's interpreting that information in a way that makes sense for their finances, goals, and stage of life.
Over time, that's also why we decided to work with agents who shared the same data-driven and advisory-led approach behind our editorial, consultants who could help readers think through decisions more objectively, rather than simply push transactions.
Today, the team has worked with more than 2,000 clients across over $5B in property transactions.
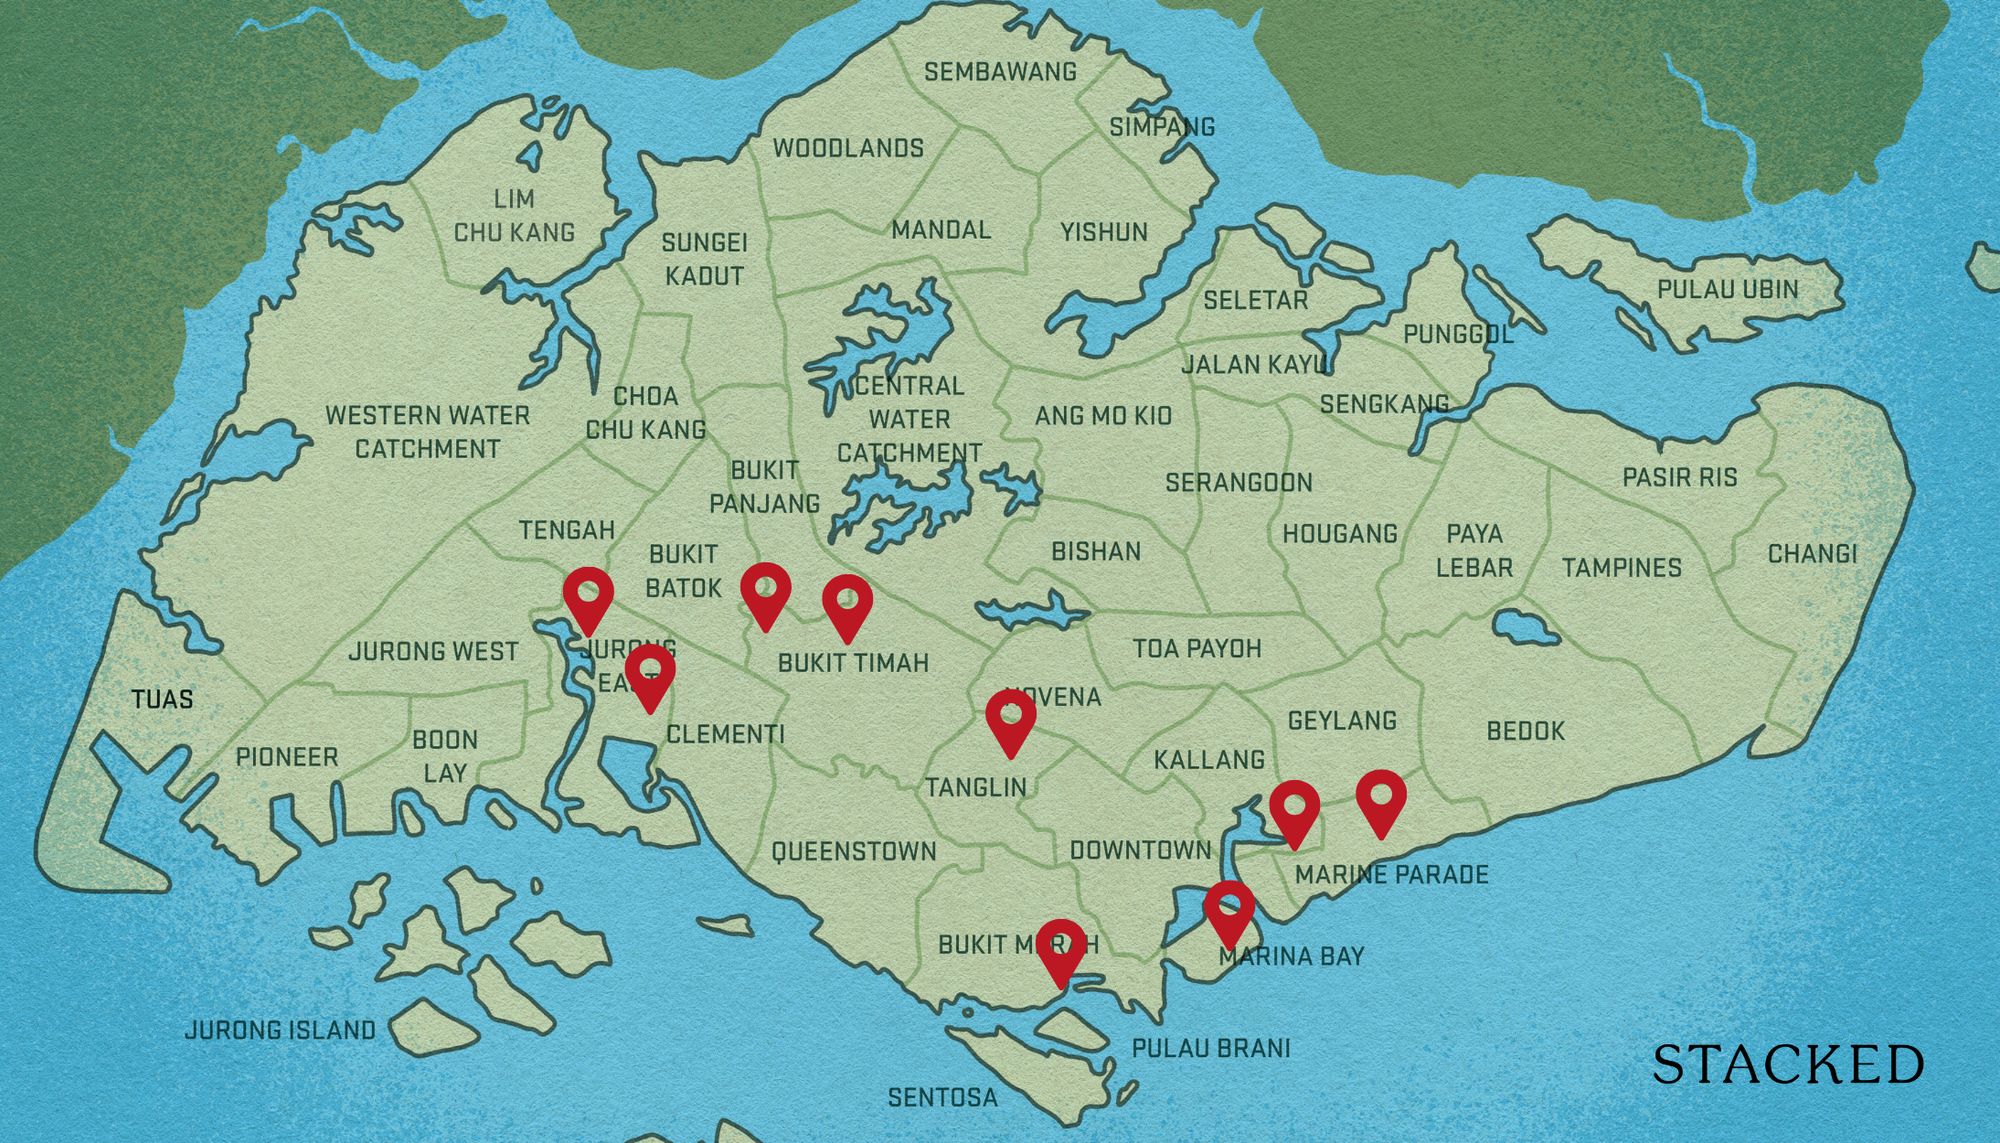
Profitable new launch condos to date:
| Projects | Tenure | Quantum Gains | Percentage Gains | Volume |
| 3 CUSCADEN | Freehold | $220,000 – $220,000 | 13.92% | 1 |
| AFFINITY AT SERANGOON | 99 yrs from 18/05/2018 | $24,000 – $289,000 | 2.93% – 21.95% | 73 |
| AMBER PARK | Freehold | $85,600 – $252,390 | 7.42% – 13.66% | 6 |
| AVENUE SOUTH RESIDENCE | 99 yrs from 14/08/2018 | $65,500 – $306,000 | 4.46% – 22.97% | 5 |
| BOULEVARD 88 | Freehold | $3,460,000 – $3,872,000 | 33.53% – 38.23% | 2 |
| DAINTREE RESIDENCE | 99 yrs from 17/07/2017 | $55,800 – $372,900 | 4.21% – 33.44% | 11 |
| DAIRY FARM RESIDENCES | 99 yrs from 05/12/2018 | $162,188 – $162,188 | 16.57% | 1 |
| FOURTH AVENUE RESIDENCES | 99 yrs from 07/03/2018 | $35,000 – $322,000 | 2.86% – 13.19% | 8 |
| FYVE DERBYSHIRE | Freehold | $255,000 – $255,000 | 13.97% | 1 |
| JADESCAPE | 99 yrs from 19/06/2018 | $45,000 – $720,400 | 2.11% – 32.26% | 63 |
| KENT RIDGE HILL RESIDENCES | 99 yrs from 10/11/2018 | $59,800 – $308,000 | 5.44% – 32.02% | 9 |
| KI RESIDENCES AT BROOKVALE | 999 yrs from 23/03/1885 | $276,000 – $430,000 | 17.25% – 20.85% | 3 |
| KOPAR AT NEWTON | 99 yrs from 22/04/2019 | $127,000 – $235,000 | 8.2% – 14.83% | 3 |
| LEEDON GREEN | Freehold | $34,700 – $34,700 | 2.4% | 1 |
| MARINA ONE RESIDENCES | 99 yrs from 01/07/2011 | $46,470 – $73,780 | 1.31% – 2.89% | 2 |
| MARTIN MODERN | 99 yrs from 28/09/2016 | $24,399 – $1,146,740 | .85% – 33.8% | 31 |
| MAYFAIR GARDENS | 99 yrs from 26/09/2018 | $47,885 – $498,000 | 3.09% – 20.65% | 18 |
| MAYFAIR MODERN | 99 yrs from 18/09/2018 | $145,500 – $533,300 | 10.96% – 23.7% | 6 |
| MIDTOWN BAY | 99 yrs from 02/01/2018 | $56,000 – $56,000 | 2.88% | 1 |
| MIDTOWN MODERN | 99 yrs from 10/12/2019 | $99,200 – $255,620 | 7.59% – 14.65% | 2 |
| MIDWOOD | 99 yrs from 01/10/2018 | $54,000 – $54,000 | 6.78% | 1 |
| MONT BOTANIK RESIDENCE | Freehold | $278,000 – $278,000 | 21.55% | 1 |
| NYON | Freehold | $200,000 – $270,000 | 13.16% – 17.65% | 2 |
| PARC CLEMATIS | 99 yrs from 08/08/2019 | $105,000 – $518,000 | 9.22% – 29.19% | 26 |
| PARC ESTA | 99 yrs from 12/07/2018 | $65,000 – $688,000 | 8.08% – 38.97% | 133 |
| PARC KOMO | Freehold | $89,000 – $504,000 | 8.23% – 19.41% | 3 |
| PARK COLONIAL | 99 yrs from 11/10/2017 | $68,000 – $669,800 | 4.73% – 35.1% | 72 |
| RESIDENCE TWENTY-TWO | Freehold | $525,000 – $525,000 | 28.% | 1 |
| RIVERFRONT RESIDENCES | 99 yrs from 31/05/2018 | $22,000 – $756,000 | 2.66% – 38.46% | 175 |
| ROYALGREEN | Freehold | $162,000 – $162,000 | 6.49% | 1 |
| SENGKANG GRAND RESIDENCES | 99 yrs from 13/11/2018 | $30,400 – $228,900 | 3.2% – 14.36% | 7 |
| SKY EVERTON | Freehold | $23,000 – $283,000 | 1.37% – 11.53% | 4 |
| STIRLING RESIDENCES | 99 yrs from 18/08/2017 | $56,000 – $732,000 | 3.25% – 37.56% | 92 |
| THE FLORENCE RESIDENCES | 99 yrs from 24/12/2018 | $14,000 – $435,000 | 1.98% – 28.85% | 55 |
| THE JOVELL | 99 yrs from 08/03/2018 | $71,000 – $201,500 | 9.9% – 28.68% | 10 |
| THE LANDMARK | 99 yrs from 28/08/2020 | $228,000 – $228,000 | 17.25% | 1 |
| THE LINQ @ BEAUTY WORLD | Freehold | $173,000 – $173,000 | 17.18% | 1 |
| THE M | 99 yrs from 03/07/2019 | $275,700 – $275,700 | 19.16% | 1 |
| THE TAPESTRY | 99 yrs from 31/07/2017 | $8,580 – $522,490 | 1.26% – 31.15% | 57 |
| THE WOODLEIGH RESIDENCES | 99 yrs from 18/09/2017 | $151,000 – $393,000 | 11.19% – 25.% | 10 |
| TREASURE AT TAMPINES | 99 yrs from 29/11/2018 | $58,000 – $676,000 | 7.66% – 35.14% | 85 |
| VIEW AT KISMIS | 99 yrs from 31/05/2019 | $193,000 – $497,000 | 16.4% – 25.22% | 4 |
| WALLICH RESIDENCE | 99 yrs from 21/02/2011 | $44,620 – $44,620 | 1.96% | 1 |
| WATERCOVE | Freehold | $400,000 – $820,000 | 16.81% – 31.54% | 4 |
| WHISTLER GRAND | 99 yrs from 07/05/2018 | $60,800 – $681,600 | 7.42% – 40.35% | 50 |
Some observations from the list:
- 1. Larger units tended to perform better
- 2. Subsales beat resales within a 4+ year holding period
- 3. North and West regions saw the highest percentage gains
- 4. Leasehold properties generally fared better
- 5. District 5 led due to Whistler Grand faring best overall
- 6. Gains across different floors are quite similar, though the high floor units takes the lead
1. Larger units tended to perform better
| Bedrooms | Volume | Holding Period (Years) | Average $ Gain | Average % Gain |
| 1 | 305 | 3.9 | $118,347 | 15.5% |
| 2 | 443 | 3.8 | $220,168 | 19.2% |
| 3 | 236 | 3.7 | $348,235 | 22.4% |
| 4 | 48 | 3.6 | $606,308 | 22.3% |
| 5 | 10 | 3.5 | $559,869 | 24.9% |
In general, larger units tended to do better. And we aren’t talking in terms of average $ gain (because that would be obvious), but from a percentage gain. This isn’t really a surprise, as it’s been part of a trend we’ve seen over the last few years.
Given current prices, it’s rare for a condo buyer to be a first-time buyer. More commonly, buyers are those who have upgraded from HDB properties, and are riding on record-high resale flat prices. As these buyers also tend to be families, there’s a marked preference for larger units.
One of the realtors we spoke to also had another explanation:
“Five-bedders are usually the most expensive units. Buyers who can afford these units are usually high-flyer types, who are maybe not as price-sensitive. If they really want a unit, they are willing to buy even TOP units at higher prices, or buy subsales. They are not really interested in gains. Some are even moving from landed properties, so they are used to a certain amount of space.”
2. Subsales beat resales within a 4+ year holding period
| Type of Sale | Holding Period (Years) | Average $ Gain | Average % Gain |
| New Sale to Resale | 4.37 | $238,639 | 18.63% |
| New Sale to Sub Sale | 3.71 | $240,959 | 19.13% |
This isn’t common, but the gains for new sales to sub-sales won out by a slim margin (a difference of half a percentage point). Usually, new sales to resale will tend to do a bit better just because it would typically be a longer holding period.
Given the very slight gap, however, this is likely just a quirk; and one for which we don’t see any discernible cause.
We wouldn’t count on it to happen very often.
3. North and West regions saw the highest percentage gains
| Region | Volume | Holding Period (Years) | Average $ Gain | Average % Gain |
| Central Region | 492 | 3.8 | $291,601 | 19.7% |
| East Region | 156 | 3.7 | $176,399 | 17.2% |
| North East Region | 310 | 3.9 | $175,966 | 17.5% |
| North Region | 4 | 3.9 | $522,250 | 21.5% |
| West Region | 82 | 3.4 | $288,656 | 24.6% |
Condos in the North and West technically saw the highest percentage gains; but we need to consider the low volume of transactions. In the West region, for example, the strong gains were mostly on the back of Whistler Grand, rather than being indicative of the region as a whole.
Whistler Grand was a rather fast-selling project (100 per cent of available units sold on launch weekend), and CDL had initially priced lower in response to recent cooling measures. This has helped the early phase buyers to recognise stronger gains.
If we take into account the volume, then Central region condos have also seen strong results. Parc Esta may be the driving force behind this:
Parc Esta sold fast from the beginning (73 per cent of available units sold on launch weekend), and several eager buyers may have failed to secure a unit. Given the condo’s location (next to Eunos MRT, and one stop from Paya Lebar Quarter), it’s not surprising if latecomers made high offers for whatever they could get.
4. Leasehold properties generally fared better
| Volume | Holding Period (Years) | Average $ Gain | Average % Gain |
| 31 | 3.3 | $486,660 | 15.6% |
| 1013 | 3.8 | $233,177 | 19.2% |
This isn’t unexpected, given that freehold only shows its advantage over long holding periods. Over a short time period like four years, freehold tends to fare worse than leasehold, as buyers paid a high premium to begin with.
That said, do note that freehold has a much lower volume of transactions (almost always the case, as there are far more leasehold than freehold land parcels). Even if the transaction volumes were comparable though, we’d bet on the leasehold properties outperforming freehold.
5. District 5 fared best overall
| District | Volume | Holding Period (Years) | Average $ Gain | Average % Gain |
| 5 | 85 | 3.6 | $276,925 | 24.3% |
| 14 | 133 | 3.6 | $284,378 | 22.7% |
| 27 | 4 | 3.9 | $522,250 | 21.5% |
| 20 | 63 | 3.7 | $306,129 | 21.5% |
| 3 | 98 | 3.8 | $283,474 | 21.4% |
| 9 | 34 | 4.2 | $483,624 | 18.7% |
| 13 | 82 | 4.0 | $236,400 | 18.0% |
| 19 | 310 | 3.9 | $175,966 | 17.5% |
| 18 | 142 | 3.8 | $176,409 | 17.2% |
| 17 | 13 | 3.5 | $149,477 | 16.2% |
| 21 | 43 | 3.6 | $233,209 | 15.8% |
| 23 | 3 | 2.3 | $164,729 | 15.0% |
| 11 | 1 | 3.4 | $255,000 | 14.0% |
| 15 | 9 | 3.6 | $228,108 | 13.2% |
| 10 | 13 | 3.6 | $696,054 | 12.7% |
| 7 | 4 | 2.7 | $171,630 | 11.1% |
| 2 | 5 | 3.2 | $144,324 | 6.3% |
| 1 | 2 | 4.4 | $60,125 | 2.1% |
This coincides with some of the points we made above.
District 5 (Buona Vista, Clementi, Dover) topped the list, and this is likely due to Whistler Grand (see above). District 14 (Paya Lebar, Eunos, Geylang) came second, and this is probably on the back of Parc Esta’s strong showing.
Do note that most of the stronger gains came from the OCR, except for District 5, which is in the RCR.
Prime regions such as the Orchard area (District 9) often feature luxury units, with less room for gains over such short periods; but some realtors have added that recent cooling measures will worsen gains here, in the years to come.
This is due to the new 60 per cent ABSD levied on foreigners, as well as higher overall stamp duties on second or third homes. Realtors opined that foreigners and investors make up a bigger share of buyers in the CCR; and going forward, there’s an expectation of weaker gains in the region.
6. Gains across different floors are quite similar, though the high-floor units takes the lead
We categorised low, medium and high floors based on the following range:
| Floor Range | Average % Returns | Volume |
| Low | 18.01% | 303 |
| Medium | 19.08% | 579 |
| High | 21.06% | 157 |
Low floors: 5 storeys and below
Medium floors: 6th to 15th storey
High floors: above 15 storeys
From the profitable transactions so far, high-floor units had the highest returns so far – albeit marginally, at 21.06%.
This could be due to the fact that condos with high floors tend to have more units and so the odds of a boutique development being inside the data is reduced. In addition, Boulevard 88 which saw stellar gains form 2 out of the 157 data points here. While it’s insignificant in volume, the gain from the sale is pretty substantial.
As such, the data here may have little to do with gains from floor range but simply have more projects that are profitable.
Overall, we can see that most new launch buyers would be sitting on profits, even if they sold as sub sales or very soon after the launch. This is mostly a matter of timing, as the post-pandemic period has been characterised by a notable housing shortage. It’s uncertain if we’ll see a repeat performance next year, however, as the combination of higher interest rates, new cooling measures, and gradually increasing supply kick in.
At Stacked, we like to look beyond the headlines and surface-level numbers, and focus on how things play out in the real world.
If you’d like to discuss how this applies to your own circumstances, you can reach out for a one-to-one consultation here.
And if you simply have a question or want to share a thought, feel free to write to us at stories@stackedhomes.com — we read every message.


0 Comments