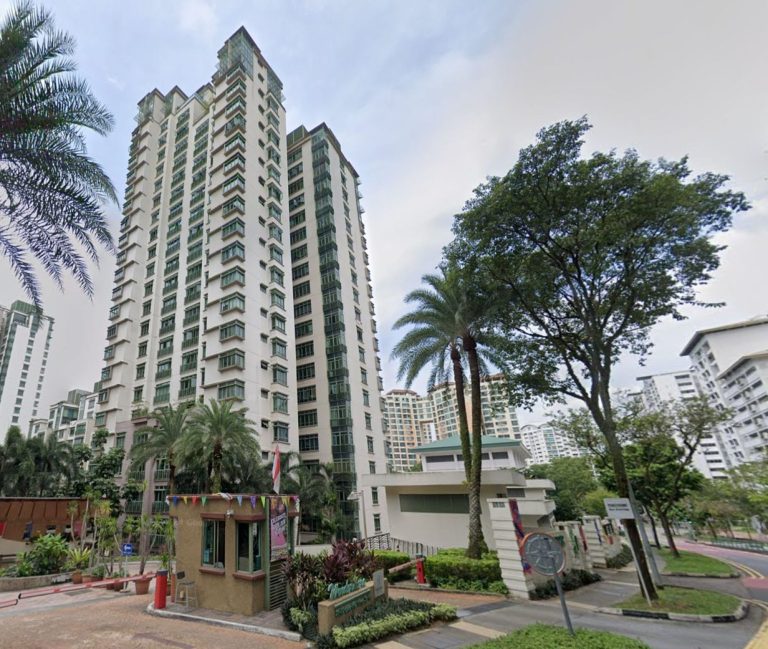
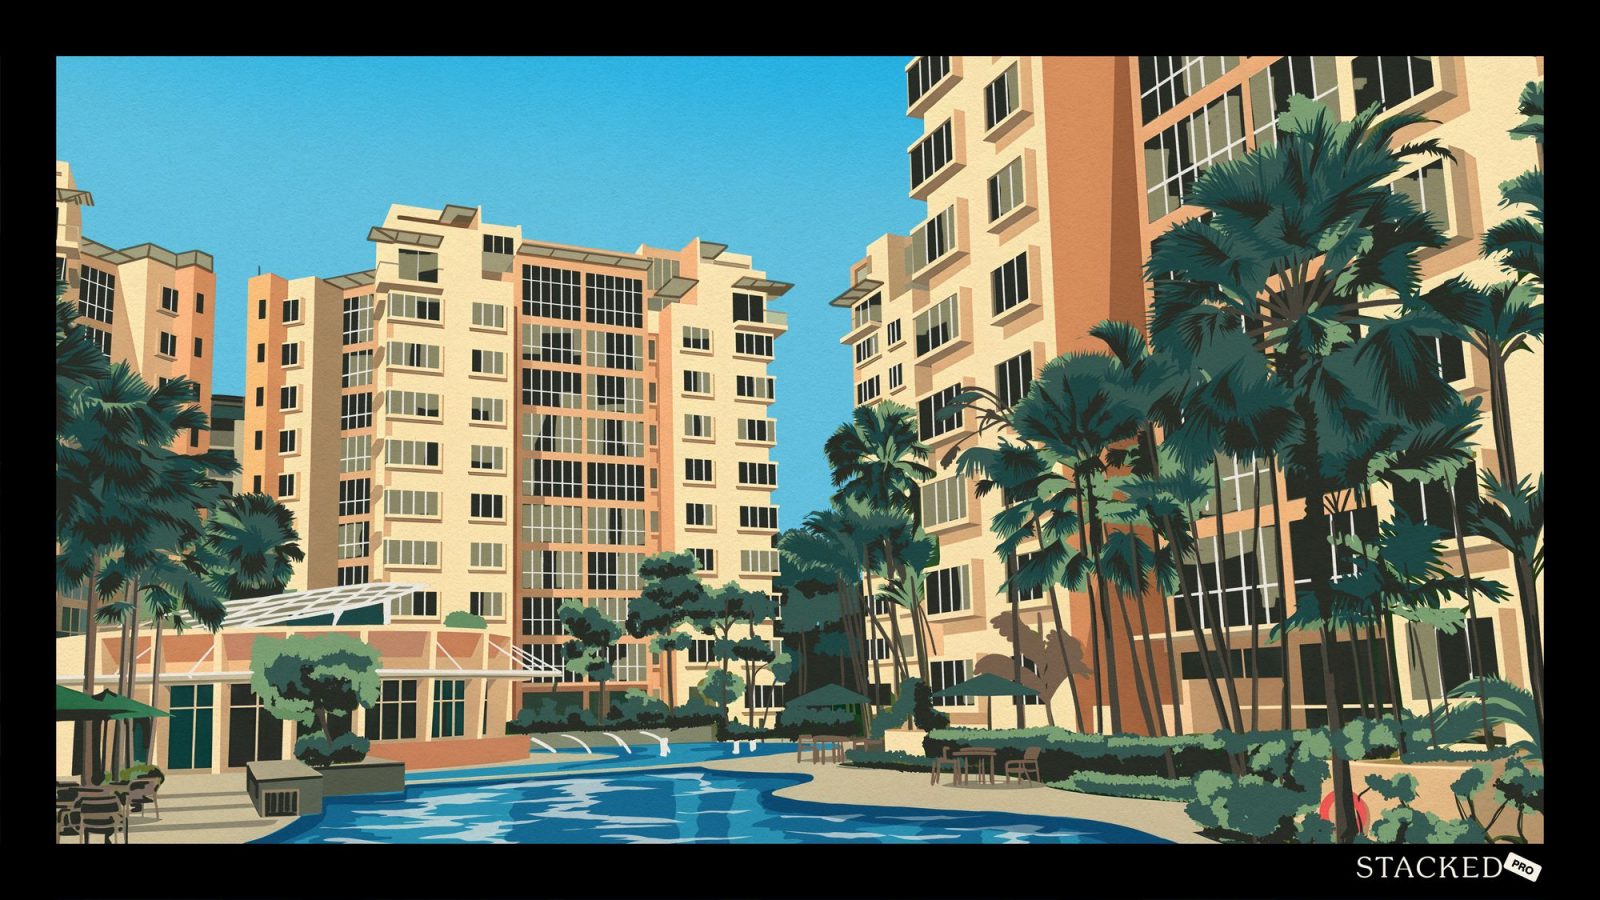
The Eden at Tampines, on Tampines St 34, launched for sale in 2001 and was one part of the early generation Executive Condominiums (ECs) when the scheme was new. Since then, while the intent of ECs have remained the same (catering to the ‘sandwiched’ class of homebuyer) the market has evolved.
ECs still resonate the strongest among owner-occupiers, especially families and young couples. Like many ECs, the unit mix at The Eden consists of three- and four-bedders, with layouts that are relatively large compared to newer ECs today.
Older ECs also tend to be located in neighbourhoods with a less extensive network of public transport options, although ongoing improvements are changing that for the better. At The Eden, the nearest MRT station is Tampines East on the Downtown Line, but this was only operational in 2017, more than a decade after the project was completed in 2003.
So, the initial owners of The Eden had to accept that there was no conveniently located MRT connection for their area at the time.This isn’t true today though, as Tampines East station is about 500m away.
Thus, when The Eden first hit the market, the area was less connected to the public transit network, but the unit sizes were larger and relatively affordable at the time. So, has this translated to strong capital gains?
Let’s take a look at the average prices of The Eden at Tampines today
| Unit type | Average $PSF | Average price | Transaction volume |
| 2-bedroom* | $1,195 | $1,028,800 | 1 |
| 3-bedroom | $1,204 | $1,425,413 | 14 |
| 4-bedroom | $1,139 | $1,821,000 | 5 |
*Note that two-bedders at The Eden at Tampines are around 860 sq ft., which would be considered a three-bedder by today’s standards. We are reflecting a single transaction from 2024, as there were no transactions in 2025.
These prices are impressively attractive and competitive given the size of the units available. In the meantime, this is the likely catchment of buyers.
| Likely buyer profiles | Less suitable for |
| HDB upgraders looking for spaciousness above all | Buyers unwilling to trade better accessibility or newer facilities for more square footage |
| Own-stay families prioritising liveability | Buyers focused on rental or resale gains |
| Buyers who want a more quiet part of Tampines, with a heartland vibe | Buyers who are thinking of Tampines Central with its three malls and offices; this is quite far from that location |
| Buyers who need proximity to East Spring Primary / Secondary, as it’s right next door | Buyers who prefer a project within 1 km of multiple schools, for more options |
So many readers write in because they're unsure what to do next, and don't know who to trust.
If this sounds familiar, we offer structured 1-to-1 consultations where we walk through your finances, goals, and market options objectively.
No obligation. Just clarity.
Learn more here.
To evaluate the resale performance of The Eden at Tampines, we should start with the resale performance of District 18 (D18) where it is located.
This will frame our expectations for the performance of the resale condo market in this area.
All tenures
| Year | D18 | All non-landed private properties |
| 2015 | $897 | $1,180 |
| 2016 | $976 | $1,232 |
| 2017 | $952 | $1,304 |
| 2018 | $1,122 | $1,435 |
| 2019 | $1,197 | $1,560 |
| 2020 | $1,172 | $1,513 |
| 2021 | $1,192 | $1,600 |
| 2022 | $1,223 | $1,712 |
| 2023 | $1,344 | $1,869 |
| 2024 | $1,416 | $1,886 |
| 2025 | $1,866 | $2,092 |
| Annualised | 7.60% | 5.90% |

As The Eden at Tampines is a 99-year leasehold project (as are all ECs), we should pay attention to the 99-year leasehold performance in D18.
99-year leasehold
| Year | D18 | All non-landed private properties |
| 2015 | $907 | $1,104 |
| 2016 | $983 | $1,166 |
| 2017 | $956 | $1,230 |
| 2018 | $1,125 | $1,359 |
| 2019 | $1,199 | $1,474 |
| 2020 | $1,174 | $1,453 |
| 2021 | $1,193 | $1,517 |
| 2022 | $1,223 | $1,595 |
| 2023 | $1,344 | $1,783 |
| 2024 | $1,418 | $1,854 |
| 2025 | $1,868 | $2,092 |
| Annualised | 7.50% | 6.60% |

In terms of the resale condo market, and the sub-market of 99-year leasehold condos, the data suggests that condos in D18 outperform the Singapore private residential market. This is attributed to the growth of Tampines as the regional centre of the East, which has seen significant developments and improvements over the years.
Thus, our general expectation for The Eden can be a little higher, since the D18 project has been around for long enough to capitalise on the price growth the district has recorded to date.
Let’s compare D18 versus the Outside of Central Region (OCR), Rest of Central Region (RCR), and Core Central Region (CCR).
All tenures
| Year | D18 | CCR | RCR | OCR |
| 2015 | $897 | $1,846 | $1,383 | $1,010 |
| 2016 | $976 | $1,968 | $1,390 | $1,008 |
| 2017 | $952 | $1,940 | $1,464 | $1,053 |
| 2018 | $1,122 | $2,161 | $1,594 | $1,139 |
| 2019 | $1,197 | $2,294 | $1,726 | $1,225 |
| 2020 | $1,172 | $2,181 | $1,681 | $1,229 |
| 2021 | $1,192 | $2,318 | $1,808 | $1,252 |
| 2022 | $1,223 | $2,395 | $2,041 | $1,381 |
| 2023 | $1,344 | $2,354 | $2,231 | $1,518 |
| 2024 | $1,416 | $2,332 | $2,159 | $1,652 |
| 2025 | $1,866 | $2,643 | $2,368 | $1,773 |
| Annualised | 7.60% | 3.65% | 5.53% | 5.79% |

As before, let’s focus on the 99-year leasehold projects specifically:
99-year leasehold
| Year | D18 | CCR | RCR | OCR |
| 2015 | $907 | $1,857 | $1,417 | $993 |
| 2016 | $983 | $2,106 | $1,420 | $999 |
| 2017 | $956 | $1,984 | $1,509 | $1,050 |
| 2018 | $1,125 | $2,153 | $1,636 | $1,139 |
| 2019 | $1,199 | $2,319 | $1,739 | $1,225 |
| 2020 | $1,174 | $2,226 | $1,714 | $1,222 |
| 2021 | $1,193 | $2,327 | $1,873 | $1,228 |
| 2022 | $1,223 | $2,300 | $2,007 | $1,354 |
| 2023 | $1,344 | $2,355 | $2,194 | $1,520 |
| 2024 | $1,418 | $2,312 | $2,230 | $1,660 |
| 2025 | $1,868 | $2,731 | $2,469 | $1,785 |
| Annualised | 7.50% | 3.93% | 5.71% | 6.04% |

The OCR is the most relevant point of comparison in this case, as this is where The Eden is located. We can see that the private home market in D18 once again shines when compared to the wider OCR market.
With the context of the performance of the resale condo market in D18 as the backdrop, let’s see if The Eden performs in tandem with this price trend.
The following takes into consideration all transactions (i.e., developer sales as well as resale transactions).
| Year | The Eden At Tampines average $PSF | All EC average $PSF | D18 non-landed private property average $PSF | All non-landed private property average $PSF |
| 2001 | $401 | $389 | $457 | $549 |
| 2002 | $393 | $371 | $442 | $561 |
| 2003 | $410 | $368 | $403 | $549 |
| 2004 | – | $369 | $443 | $579 |
| 2005 | – | $363 | $430 | $636 |
| 2006 | $384 | $348 | $417 | $755 |
| 2007 | $477 | $416 | $506 | $1,022 |
| 2008 | $527 | $487 | $607 | $907 |
| 2009 | $524 | $497 | $605 | $935 |
| 2010 | $627 | $645 | $738 | $1,137 |
| 2011 | $725 | $688 | $824 | $1,146 |
| 2012 | $778 | $729 | $861 | $1,161 |
| 2013 | $862 | $763 | $926 | $1,270 |
| 2014 | $825 | $792 | $987 | $1,290 |
| 2015 | $784 | $792 | $897 | $1,180 |
| 2016 | $784 | $777 | $976 | $1,232 |
| 2017 | $751 | $789 | $952 | $1,304 |
| 2018 | $810 | $877 | $1,122 | $1,435 |
| 2019 | $781 | $940 | $1,197 | $1,560 |
| 2020 | $814 | $970 | $1,172 | $1,513 |
| 2021 | $803 | $1,051 | $1,192 | $1,600 |
| 2022 | $929 | $1,194 | $1,223 | $1,712 |
| 2023 | $1,078 | $1,283 | $1,344 | $1,869 |
| 2024 | $1,140 | $1,385 | $1,416 | $1,886 |
| 2025 | $1,187 | $1,546 | $1,866 | $2,092 |
| Annualised | 4.62% | 5.92% | 6.04% | 5.73% |

Overall, based on our compilation of the transaction data, price growth at The Eden at Tampines lags the wider private resale market. In the early years prices at the project moved in tandem with the broader EC segment, and at times it edged slightly ahead. But from the mid-2010s, we can see that prices began to trail its sub-market average.
Competition was a key factor here: Tampines Trilliant (2011) and Citylife @ Tampines (2013) offered newer developments with more efficient layouts, and the developments boasted better positioning near amenities. While The Eden did benefit from the completion of Tampines East station, this came later in 2017 when it had already been privatised and its days of strongest price growth were behind it.
During the Covid-19 pandemic and its aftermath (starting from 2020), The Eden also benefited from rising resale prices, but its growth of 4.62% during this period still trails the overall private home market.
Overall, our analysis indicates that The Eden has delivered slow and steady gains, but has never quite reached an exceptional level of market outperformance in terms of resale price.
How do nearby projects compare to The Eden at Tampines?
Let’s start by comparing prices at The Eden to nearby alternatives, using the average among all sales (new launch, sub sale, and resale):
| Project | Property type | Completion year | Tenure | No. of units | Unit mix | Avg size (based on units transacted) | Avg $PSF | Avg price | No. of units sold |
| PINEVALE | EC | 1999 | 99-years | 322 | 3, 4 | 1372 | $1,102 | $1,510,689 | 10 |
| THE EDEN AT TAMPINES | EC | 2003 | 99-years | 430 | 2, 3, 4 | 1299 | $1,187 | $1,529,515 | 19 |
| THE TROPICA | Condo | 2000 | 99-years | 537 | 2, 3, 4 | 1328 | $1,315 | $1,747,361 | 8 |
| ARC AT TAMPINES | EC | 2014 | 99-years | 574 | 2, 3, 4 | 1067 | $1,380 | $1,468,837 | 29 |
| THE SANTORINI | Condo | 2017 | 99-years | 597 | 1, 2, 3, 4, 5 | 865 | $1,466 | $1,268,824 | 29 |
| WATERVIEW | Condo | 2014 | 99-years | 696 | 2, 3, 4, 5, 6 | 991 | $1,480 | $1,468,582 | 29 |
| Q BAY RESIDENCES | Condo | 2016 | 99-years | 630 | 1, 2, 3, 4, 5 | 847 | $1,490 | $1,273,241 | 38 |
| CITYLIFE@TAMPINES | EC | 2016 | 99-years | 514 | 1, 2, 3, 4, 5 | 1544 | $1,516 | $2,194,119 | 31 |
| THE ALPS RESIDENCES | Condo | 2019 | 99-years | 626 | 1, 2, 3, 4, 5 | 751 | $1,520 | $1,139,965 | 46 |
| THE TAMPINES TRILLIANT | EC | 2015 | 99-years | 670 | 3, 4 | 1183 | $1,656 | $1,928,320 | 47 |
| THE TAPESTRY | Condo | 2021 | 99-years | 861 | 1, 2, 3, 4, 5 | 727 | $1,702 | $1,235,669 | 72 |
| TREASURE AT TAMPINES | Condo | 2023 | 99-years | 2203 | 1, 2, 3, 4, 5 | 886 | $1,768 | $1,571,002 | 168 |
Based on average $PSF, The Eden at Tampines sits toward the lower end of the Tampines private home market. This is expected given that its $PSF is slightly above older ECs like Pinevale, but below newer ECs and private condos.
In terms of absolute price (quantum), The Eden is within the same price range as several nearby projects, despite its lower $PSF. This is attributed to the fact that its units are relatively larger. This is an advantage given that the price quantum is still affordable for most HDB upgraders (which typically have a budget of below $2 million), while offering unit sizes that are much larger than most new units today.
The Eden is not the cheapest condo in Tampines (in terms of price quantum) despite being an older EC, but it is one of the most affordable ways to get a larger unit in Tampines.
Next, let’s break down the price performance by specific unit sizes:
2-bedroom units
| Project | Avg $PSF | Avg price | No. of tnx |
| THE EDEN AT TAMPINES | $1,195 | $1,028,800 | 1 |
| THE ALPS RESIDENCES | $1,506 | $1,049,979 | 17 |
| THE TAPESTRY | $1,707 | $1,057,901 | 27 |
| TREASURE AT TAMPINES | $1,746 | $1,138,719 | 63 |
| ARC AT TAMPINES | $1,440 | $1,156,667 | 3 |
| THE SANTORINI | $1,443 | $1,208,091 | 11 |
| Q BAY RESIDENCES | $1,487 | $1,248,432 | 9 |
| WATERVIEW | $1,450 | $1,276,346 | 17 |
| CITYLIFE@TAMPINES | $1,703 | $1,338,000 | 1 |
More from Stacked
This 130-Unit Condo Launched 40% Above Its District — And Prices Struggled To Grow
When the 130-unit Kandis Residence launched for sale in 2017, it was an interesting project that garnered some conflicting opinions.…
3-bedroom units
| Project | Avg $PSF | Avg price | No. of tnx |
| THE EDEN AT TAMPINES | $1,204 | $1,425,413 | 14 |
| ARC AT TAMPINES | $1,368 | $1,461,577 | 23 |
| PINEVALE | $1,102 | $1,510,689 | 10 |
| THE ALPS RESIDENCES | $1,513 | $1,511,859 | 15 |
| Q BAY RESIDENCES | $1,495 | $1,665,646 | 10 |
| THE SANTORINI | $1,482 | $1,682,500 | 8 |
| THE TROPICA | $1,294 | $1,682,698 | 7 |
| TREASURE AT TAMPINES | $1,790 | $1,717,983 | 60 |
| WATERVIEW | $1,519 | $1,729,182 | 11 |
| THE TAPESTRY | $1,704 | $1,777,269 | 23 |
| THE TAMPINES TRILLIANT | $1,648 | $1,837,530 | 38 |
| CITYLIFE@TAMPINES | $1,601 | $1,855,854 | 13 |
4-bedroom units
| Project | Avg $PSF | Avg price | No. of tnx |
| THE EDEN AT TAMPINES | $1,139 | $1,821,000 | 5 |
| ARC AT TAMPINES | $1,413 | $1,836,667 | 3 |
| WATERVIEW | $1,565 | $1,870,000 | 1 |
| THE SANTORINI | $1,494 | $2,010,000 | 2 |
| THE ALPS RESIDENCES | $1,552 | $2,188,888 | 1 |
| THE TROPICA | $1,460 | $2,200,000 | 1 |
| Q BAY RESIDENCES | $1,602 | $2,258,250 | 4 |
| CITYLIFE@TAMPINES | $1,538 | $2,298,906 | 14 |
| THE TAMPINES TRILLIANT | $1,692 | $2,311,654 | 9 |
| TREASURE AT TAMPINES | $1,811 | $2,332,049 | 28 |
The Eden at Tampines is the most affordable condo in terms of its $PSF across all unit sizes. The newer projects command a higher $PSF but – because their units are smaller – the price gap with The Eden is not as wide as we might assume.
Overall, the average price of The Eden positions it as a relative value buy in terms of the spaciousness its units offer. This development is one of the most affordable ways to get a resale three-bedder in Tampines for less than $1.5 million.
Now let’s take a closer look at the size of units.
We’ll compare the minimum unit sizes across nearby projects. This shows how The Eden achieves its pricing, and where the project stands out in its locale.
2-bedroom units
| Project | Min. size (sqft) |
| TREASURE AT TAMPINES | 581 |
| THE TAPESTRY | 603 |
| THE ALPS RESIDENCES | 689 |
| THE SANTORINI | 721 |
| ARC AT TAMPINES | 775 |
| WATERVIEW | 786 |
| CITYLIFE@TAMPINES | 786 |
| Q BAY RESIDENCES | 797 |
| THE EDEN AT TAMPINES | 861 |
| THE TROPICA | 990 |

3-bedroom units
| Project | Min. size (sqft) |
| TREASURE AT TAMPINES | 818 |
| THE TAMPINES TRILLIANT | 872 |
| Q BAY RESIDENCES | 904 |
| THE TAPESTRY | 926 |
| THE ALPS RESIDENCES | 936 |
| ARC AT TAMPINES | 958 |
| THE EDEN AT TAMPINES | 1012 |
| THE SANTORINI | 1044 |
| CITYLIFE@TAMPINES | 1098 |
| WATERVIEW | 1109 |
| THE TROPICA | 1195 |
| PINEVALE | 1281 |

4-bedroom units
| Project | Min. size (sqft) |
| ARC AT TAMPINES | 1173 |
| WATERVIEW | 1195 |
| THE SANTORINI | 1238 |
| TREASURE AT TAMPINES | 1238 |
| THE TAMPINES TRILLIANT | 1302 |
| CITYLIFE@TAMPINES | 1313 |
| THE EDEN AT TAMPINES | 1356 |
| Q BAY RESIDENCES | 1378 |
| THE ALPS RESIDENCES | 1410 |
| THE TAPESTRY | 1432 |
| THE TROPICA | 1496 |
| PINEVALE | 2486 |

The Eden’s two-bed, two-bath units are 861 sq ft. and are the smallest, but this is already as large as some three-bedders today. As for three- and four-bedders, The Eden is at a comfortable mid-range: more sizable than newer counterparts, but still small enough to keep the quantum manageable.
Now let’s compare how the nearby projects have performed, against The Eden at Tampines
We’ll look at the price movements since 2001, when The Eden launched:
| Year | PINEVALE | THE TROPICA | THE EDEN AT TAMPINES | WATERVIEW | ARC AT TAMPINES | THE TAMPINES TRILLIANT | CITYLIFE@TAMPINES | Q BAY RESIDENCES | THE SANTORINI | THE ALPS RESIDENCES | THE TAPESTRY | TREASURE AT TAMPINES |
| 2001 | $403 | $543 | $401 | |||||||||
| 2002 | – | $425 | $393 | |||||||||
| 2003 | $372 | $433 | $410 | |||||||||
| 2004 | $376 | $430 | – | |||||||||
| 2005 | $342 | $417 | – | |||||||||
| 2006 | $346 | $426 | $384 | |||||||||
| 2007 | $463 | $520 | $477 | |||||||||
| 2008 | $504 | $593 | $527 | |||||||||
| 2009 | $509 | $598 | $524 | |||||||||
| 2010 | $579 | $668 | $627 | $888 | ||||||||
| 2011 | $650 | $793 | $725 | $863 | $728 | |||||||
| 2012 | $727 | $840 | $778 | $893 | $732 | $786 | ||||||
| 2013 | $776 | $885 | $862 | $1,027 | $769 | $788 | $797 | $1,041 | ||||
| 2014 | $766 | $864 | $825 | $1,036 | $819 | $865 | $815 | $1,046 | $1,123 | |||
| 2015 | $721 | $803 | $784 | $978 | $769 | $727 | $844 | $1,043 | $1,136 | |||
| 2016 | $701 | $782 | $784 | $945 | – | $821 | – | $1,142 | $1,080 | $1,080 | ||
| 2017 | $654 | $796 | $751 | $965 | $856 | $866 | – | $1,130 | $1,037 | $1,065 | ||
| 2018 | $705 | $853 | $810 | $999 | $921 | $1,021 | – | $1,118 | $1,159 | $1,157 | $1,384 | |
| 2019 | $711 | $867 | $781 | $1,037 | $934 | $988 | – | $1,110 | $1,135 | $1,222 | $1,336 | $1,339 |
| 2020 | $725 | $863 | $814 | $1,017 | $907 | $1,042 | $1,023 | $1,100 | $1,151 | $1,188 | $1,376 | $1,369 |
| 2021 | $745 | $911 | $803 | $1,042 | $947 | $1,102 | $1,087 | $1,151 | $1,171 | $1,273 | $1,490 | $1,410 |
| 2022 | $893 | $1,024 | $929 | $1,130 | $1,097 | $1,266 | $1,224 | $1,239 | $1,253 | $1,344 | $1,578 | $1,540 |
| 2023 | $949 | $1,137 | $1,078 | $1,271 | $1,227 | $1,409 | $1,301 | $1,366 | $1,373 | $1,414 | $1,646 | $1,646 |
| 2024 | $990 | $1,246 | $1,140 | $1,431 | $1,338 | $1,521 | $1,446 | $1,424 | $1,397 | $1,488 | $1,680 | $1,698 |
| 2025 | $1,102 | $1,315 | $1,187 | $1,480 | $1,380 | $1,656 | $1,516 | $1,490 | $1,466 | $1,520 | $1,702 | $1,768 |
| Annualised (since 2001 or project launch year for newer developments) | 4.29% | 3.75% | 4.62% | 3.47% | 4.67% | 5.90% | 5.50% | 3.03% | 2.45% | 3.87% | 3.00% | 4.74% |

While price growth is not exceptional, The Eden remains one of the better performers among the older condos in this residential cluster.
At its sales launch in 2001, the project commanded an average $PSF that was in line with older ECs like Pinevale, but below private developments such as The Tropica. But when it reached MOP in 2008, its prices had moved closer to match the price of most surrounding developments – although it still trailed The Tropica, a 537-unit development on Tampines Ave 1.
When it privatised, resale prices at The Eden matched older resale projects in the vicinity. This was also when we saw a wave of new projects enter the market, such as Arc at Tampines, The Tampines Trilliant, and Citylife @ Tampines. This introduced newer EC units into the area’s housing inventory, often at competitive prices.
We also saw the introduction of a series of property cooling measures in 2008 that slowed price growth across the private residential property market. During this period some of these newer ECs pulled ahead, with stronger growth and higher end pricing; and The Eden fell behind the top performers.
Still, thanks to its lower initial pricing. The Eden still managed to outperform several newer, pricier private condos along Tampines Avenue 10. Since then, The Eden has mainly moved in line with the average price trend of the resale property market.
Next, we’ll focus on sub sale and resale transactions from 2021 to 2025.
This focuses our analysis on its resale performance, and is also the period of time when Treasure at Tampines (a 2,203-unit condo that launched for sale in 2019) hit the market, and a recovery period for the property market after the Covid-19 pandemic.
Treasure at Tampines is the largest condo project in Singapore to date, and its mega-sized unit count makes it a relevant benchmark for resale prices in this locale.
| Year | PINEVALE | THE TROPICA | THE EDEN AT TAMPINES | WATERVIEW | ARC AT TAMPINES | THE TAMPINES TRILLIANT | CITYLIFE@TAMPINES | Q BAY RESIDENCES | THE SANTORINI | THE ALPS RESIDENCES | THE TAPESTRY | TREASURE AT TAMPINES |
| 2021 | $745 | $911 | $803 | $1,042 | $947 | $1,102 | $1,087 | $1,151 | $1,171 | $1,273 | $1,505 | $1,472 |
| 2022 | $893 | $1,024 | $929 | $1,130 | $1,097 | $1,266 | $1,224 | $1,239 | $1,253 | $1,344 | $1,578 | $1,564 |
| 2023 | $949 | $1,137 | $1,078 | $1,271 | $1,227 | $1,409 | $1,301 | $1,366 | $1,373 | $1,414 | $1,646 | $1,646 |
| 2024 | $990 | $1,246 | $1,140 | $1,431 | $1,338 | $1,521 | $1,446 | $1,424 | $1,397 | $1,488 | $1,680 | $1,698 |
| 2025 | $1,102 | $1,315 | $1,187 | $1,480 | $1,380 | $1,656 | $1,516 | $1,490 | $1,466 | $1,520 | $1,702 | $1,768 |
| Annualised | 10.30% | 9.59% | 10.28% | 9.17% | 9.87% | 10.73% | 8.67% | 6.67% | 5.79% | 4.54% | 3.14% | 4.69% |

The Eden at Tampines is among the strongest performers during this volatile period. Its annualised price growth stayed comparable to older ECs like Pinevale, and was not far off newer ECs such as The Tampines Trilliant. This suggests that despite its age, The Eden was still able to benefit from the overall market rally.
Some newer developments also saw moderate price growth. A likely reason is their higher starting prices: with a shorter runway for price growth to accelerate, their upside was more limited during this period. Nonetheless, we can see The Eden was resilient and able to keep pace in a tough market despite being an older development.
It’s spacious for its price, but what’s a viable exit strategy for buyers of The Eden at Tampines?
First, let’s get a sense of who is buying in this part of Tampines, and whether they’re HDB upgraders, or already owned a private property previously:
| Year | HDB | Unknown | Private | % HDB Upgraders | % of existing private property owners |
| 2021 | 1642 | 407 | 1239 | 50% | 38% |
| 2022 | 891 | 69 | 709 | 53% | 42% |
| 2023 | 587 | 29 | 623 | 47% | 50% |
| 2024 | 589 | 6 | 698 | 46% | 54% |
| 2025 | 1265 | 426 | 1374 | 41% | 45% |
In 2021, HDB upgraders made up a larger share of buyers in D18, but this has shifted. By 2025, the split between HDB upgraders and existing private property owners is much more even. This is reflective of prices in the area increasing, such as due to the improved DTL connectivity.
This matters when it comes to exit strategy. HDB upgraders tend to be more sensitive to price; but with more buyers coming from the private side, demand might come with bigger budgets.
Let’s look at the price ranges that these buyers seem comfortable with:
HDB upgraders
| Price range | No. of transactions |
| Under $1M | 37 |
| Between $1M – $1.5M | 156 |
| Between $1.6M – $2M | 152 |
| Between $2.1M – $2.5M | 44 |
| Between $2.6M – $3M | 10 |
| Above $3M | 5 |
Existing private property owners
| Price range | No. of transactions |
| Under $1M | 54 |
| Between $1M – $1.5M | 173 |
| Between $1.6M – $2M | 150 |
| Between $2.1M – $2.5M | 59 |
| Between $2.6M – $3M | 25 |
| Above $3M | 12 |

Across both HDB upgraders and existing private property owners, most transactions fall within the $1 million to $2 million range. Within this range, the most commonly transacted amounts were between $1 million to $1.5 million.
This closely matches the price points we’re seeing for The Eden, with its three-bedders falling just under the $1.5 million mark on average.
Across the whole of D18, these are the typical transaction prices:
Average resale prices in D18 for transactions done in 2025 by bedroom type
| Unit type | Average price in 2025 |
| 1-bedroom | $802,813 |
| 2-bedroom | $1,166,433 |
| 3-bedroom | $1,582,387 |
| 4-bedroom | $2,117,668 |
| 5-bedroom | $2,804,642 |

As we saw earlier, The Eden has largely tracked the market – and we can see here that its average prices are also closely aligned with the averages in D18.
What does the supply of condo units in D18 say about the exit strategy?
This is what the rough supply of units looks like across Singapore, as of 2026:
| Bedrooms | CCR | RCR | OCR |
| 1BR | 18% | 17% | 9% |
| 2BR | 28% | 30% | 24% |
| 3BR | 36% | 43% | 52% |
| 4BR | 17% | 9% | 13% |
| 5BR | 1% | 1% | 2% |

Now let’s look at the supply situation in D18:
| No. of bedrooms | 1BR | 2BR | 3BR | 4BR | 5BR |
| Unit supply in D18 (estimated) | 1951 | 6479 | 13957 | 4507 | 579 |
| Percentage of unit supply in the vicinity of The Eden At Tampines (includes resale projects that we were looking at at the beginning of the article + new launches nearby) against the supply in D18 (estimated) | 53% | 43% | 40% | 46% | 52% |
Three-bedders form the largest supply in D18, followed by two-bedders. This is in line with the wider OCR. But in the immediate cluster around Eden, we see that close to half of the district’s one- and five-bedders are concentrated here. In contrast, the share of three-bedroom units in this area is lower relative to the wider district.
This generally bodes well for The Eden, as three-bedders are the most common size of family units; and it has several of these units in an area where the supply is a bit lower.
Next, let’s look at a quick breakdown of profitability between the different unit sizes.
For this analysis, transactions are split into two periods: the first covers 2001 to 2012, from MOP to just before full privatisation. The second covers 2013 to 2025, after the development became fully privatised.
2-bedroom units
| Project | Gains | Losses | ||||||
| Average ROI | Average profit | Average holding period (years) | No. of units | Average ROI | Average profit | Average holding period (years) | No. of units | |
| WATERVIEW | 17.07% | $119,571 | 1.5 | 7 | ||||
| THE TROPICA | 22.33% | $121,000 | 2.8 | 9 | -10.51% | -$60,000 | 3.6 | 2 |
| THE EDEN AT TAMPINES | 47.55% | $177,612 | 6.2 | 26 | ||||
3-bedroom units
| Project | Gains | Losses | ||||||
| Average ROI | Average profit | Average holding period (years) | No. of units | Average ROI | Average profit | Average holding period (years) | No. of units | |
| WATERVIEW | 11.14% | $116,571 | 1.7 | 7 | -20.00% | -$216,200 | 0.3 | 1 |
| THE TROPICA | 33.37% | $213,619 | 5.2 | 78 | -16.83% | -$115,200 | 4.7 | 14 |
| PINEVALE | 40.07% | $222,297 | 2.9 | 25 | -20.35% | -$120,500 | 5.2 | 1 |
| THE EDEN AT TAMPINES | 46.68% | $232,358 | 7.5 | 113 | -3.69% | -$16,183 | 2.9 | 3 |
4-bedroom units
| Project | Gains | Losses | ||||||
| Average ROI | Average profit | Average holding period (years) | No. of units | Average ROI | Average profit | Average holding period (years) | No. of units | |
| PINEVALE | 13.33% | $100,000 | 1.8 | 1 | ||||
| WATERVIEW | 22.05% | $271,000 | 1.9 | 1 | ||||
| THE EDEN AT TAMPINES | 39.39% | $242,180 | 6.9 | 52 | -11.83% | -$69,120 | 5.5 | 1 |
| THE TROPICA | 39.51% | $277,622 | 5.3 | 10 | -25.23% | -$207,500 | 4.2 | 1 |
Between 2001 and 2012, The Eden at Tampines was one of the stronger performers across all unit sizes. This is unsurprising, as it’s well-established that ECs tend to see their strongest gains right after crossing the five-year MOP.
We see that The Eden experienced high ROI and relatively limited losses across every unit type; and the biggest benefits for this project would have been with the earliest buyers.
Now let’s look at the performance between 2013 to 2025, when The Eden was fully privatised:
2-bedroom units
| Project | Gains | Losses | ||||||
| Average ROI | Average profit | Average holding period (years) | No. of units | Average ROI | Average profit | Average holding period (years) | No. of units | |
| THE TAPESTRY | 16.95% | $153,601 | 5.0 | 88 | -8.11% | -$68,800 | 2.7 | 1 |
| Q BAY RESIDENCES | 17.36% | $154,276 | 7.8 | 84 | -3.45% | -$33,786 | 6.5 | 7 |
| THE TROPICA | 17.94% | $156,445 | 7.0 | 7 | -2.59% | -$23,000 | 8.1 | 1 |
| THE SANTORINI | 19.40% | $169,572 | 6.1 | 66 | ||||
| TREASURE AT TAMPINES | 19.93% | $180,831 | 4.2 | 249 | ||||
| THE ALPS RESIDENCES | 26.73% | $197,946 | 5.7 | 82 | ||||
| WATERVIEW | 30.29% | $266,682 | 6.3 | 29 | -4.90% | -$44,727 | 5.7 | 11 |
| ARC AT TAMPINES | 31.16% | $206,611 | 6.9 | 27 | ||||
| THE EDEN AT TAMPINES | 31.90% | $248,800 | 8.0 | 1 | ||||
| CITYLIFE@TAMPINES | 43.05% | $320,525 | 7.5 | 8 | ||||
3-bedroom units
| Project | Gains | Losses | ||||||
| Average ROI | Average profit | Average holding period (years) | No. of units | Average ROI | Average profit | Average holding period (years) | No. of units | |
| THE TAPESTRY | 16.95% | $153,601 | 5.0 | 88 | -8.11% | -$68,800 | 2.7 | 1 |
| Q BAY RESIDENCES | 17.36% | $154,276 | 7.8 | 84 | -3.45% | -$33,786 | 6.5 | 7 |
| THE TROPICA | 17.94% | $156,445 | 7.0 | 7 | -2.59% | -$23,000 | 8.1 | 1 |
| THE SANTORINI | 19.40% | $169,572 | 6.1 | 66 | ||||
| TREASURE AT TAMPINES | 19.93% | $180,831 | 4.2 | 249 | ||||
| THE ALPS RESIDENCES | 26.73% | $197,946 | 5.7 | 82 | ||||
| WATERVIEW | 30.29% | $266,682 | 6.3 | 29 | -4.90% | -$44,727 | 5.7 | 11 |
| ARC AT TAMPINES | 31.16% | $206,611 | 6.9 | 27 | ||||
| THE EDEN AT TAMPINES | 31.90% | $248,800 | 8.0 | 1 | ||||
| CITYLIFE@TAMPINES | 43.05% | $320,525 | 7.5 | 8 | ||||
4-bedroom units
| Project | Gains | Losses | ||||||
| Average ROI | Average profit | Average holding period (years) | No. of units | Average ROI | Average profit | Average holding period (years) | No. of units | |
| THE TROPICA | 21.17% | $267,500 | 5.9 | 6 | -7.14% | -$100,000 | 4.4 | 1 |
| THE SANTORINI | 26.19% | $349,561 | 5.2 | 15 | ||||
| THE TAPESTRY | 26.51% | $461,751 | 4.3 | 13 | ||||
| TREASURE AT TAMPINES | 29.71% | $510,231 | 3.7 | 78 | ||||
| WATERVIEW | 29.75% | $372,400 | 4.7 | 5 | 0.00% | $0 | 6.8 | 1 |
| Q BAY RESIDENCES | 29.76% | $422,557 | 8.2 | 20 | -6.57% | -$98,500 | 3.3 | 1 |
| THE ALPS RESIDENCES | 30.26% | $459,481 | 5.5 | 6 | ||||
| PINEVALE | 31.43% | $550,000 | 3.0 | 1 | ||||
| THE EDEN AT TAMPINES | 36.61% | $490,519 | 5.4 | 6 | ||||
| ARC AT TAMPINES | 46.19% | $526,835 | 4.2 | 9 | ||||
| THE TAMPINES TRILLIANT | 50.99% | $782,178 | 4.4 | 5 | ||||
| CITYLIFE@TAMPINES | 57.06% | $673,255 | 9.2 | 76 | ||||
From 2013 to 2025, The Eden at Tampines delivered middle-of-the road results across all unit types. While it did not top the newer ECs like The Tampines Trilliant and Citylife @ Tampines, it remained broadly in line with surrounding projects.
As such, full privatisation doesn’t appear to have been a major turning point for The Eden at Tampines. Even though prices continued to rise after 2013, this performance largely tracked the broader market.
Finally, let’s look at the difference in affordability when we separate new launch sales from sub sales or resale:
| Sale type | Gains | Losses | ||||||
| Average ROI | Average profit | Average holding period (years) | No. of units | Average ROI | Average profit | Average holding period (years) | No. of units | |
| New sale to resale | 73.08% | $372,757 | 12.1 | 255 | -8.86% | -$47,715 | 5.3 | 2 |
| Resale to resale | 40.78% | $304,101 | 7.0 | 138 | -2.82% | -$29,133 | 6.8 | 9 |
Units bought at launch and later sold on the resale market recorded significantly stronger returns. In contrast, resale-to-resale transactions saw more moderate gains. This reflects a simple transaction pattern applicable to most condos: The later you buy a project, the higher the price you buy at; and as a result, your room for gains becomes smaller.
This holds true whether it’s an EC or a private condominium.
Potential future developments in the area
The immediate surroundings of The Eden at Tampines are largely built up, with little to no land available for new residential projects nearby. Most future supply in Tampines will come from areas like Tampines North and Tampines West, not the Tampines East enclave where The Eden sits.
As such, there’s unlikely to be much future competition for The Eden. Its price movements are likely to follow broader market trends, rather than be affected by any new residential development nearby.
This places The Eden in a relatively stable pocket, with mostly indirect competition. We don’t see anything that would drastically lower prices, but we don’t see anything that would significantly raise them either; not for the time being.
Conclusion:
The Eden at Tampines has moved past its years of strongest growth. However, that doesn’t mean it’s unappealing, in fact it can be quite attractive for owner-occupiers and homeowners right now.
This project offers an accessible entry price across two-, three-, and four-bedders; that’s true in both its price quantum as well as the project’s relatively lower $PSF. This is one of the few ways a budget-sensitive upgrader – or possibly even a first-time buyer – might still be able to secure a three-bedder in the private housing market in 2026. This is because its pricing matches the average transaction price range of $1 million to $2 million based on sales by buyers in this locale.
In terms of resale performance, The Eden has been very resilient. Thanks to the lower initial price, it has kept pace with the broader housing market and even outperformed some newer projects. This is unlikely to change in future, and capital gains will probably track the wider private housing market rather than outperform it.
Overall, The Eden has delivered on its original positioning as a spacious, family-oriented development. Its strongest gains were seen by early buyers who entered at a low base, and held through its EC lifecycle.
At Stacked, we like to look beyond the headlines and surface-level numbers, and focus on how things play out in the real world.
If you’d like to discuss how this applies to your own circumstances, you can reach out for a one-to-one consultation here.
And if you simply have a question or want to share a thought, feel free to write to us at stories@stackedhomes.com — we read every message.
Frequently asked questions
What is the size of the two-bedroom units at The Eden at Tampines?
How do the prices of two-bedroom units at The Eden compare to nearby projects?
What is the average price of a three-bedroom unit at The Eden at Tampines?
How has the resale price of The Eden at Tampines changed since 2001?
How does the price growth of The Eden compare to the wider private residential market in Singapore?
Joey Peh
Joey is a data analyst and licensed real estate agent with a passion for storytelling through numbers.Need help with a property decision?
Speak to our team →Read next from Property Investment Insights
PRO New Launch Condo Analysis Tengah Garden Residences Starts From $980K — How Its Pricing Compares In Tengah
PRO Property Investment Insights How Condo Prices Differ Across Tampines — And Where Buyers May Still Find Value In 2026
Property Investment Insights How Experienced Buyers Shortlist Condos In A Neighbourhood
PRO Property Investment Insights Bishan Loft EC Price Review: Why This Older Executive Condominium Saw Strong Gains
Latest Posts
Singapore Property News Ang Mo Kio And Bedok Four-Room Flats Hit Record $1.15M And $1.12M After MOP
Overseas Property Investing FM Investment Japan Review: Osaka Property Projects and a Full-Suite Ecosystem Explained
New Launch Condo Reviews Tengah Garden Residences Review: New 863-Unit Tengah Condo From $980,000 Near Hong Kah MRT
0 Comments