

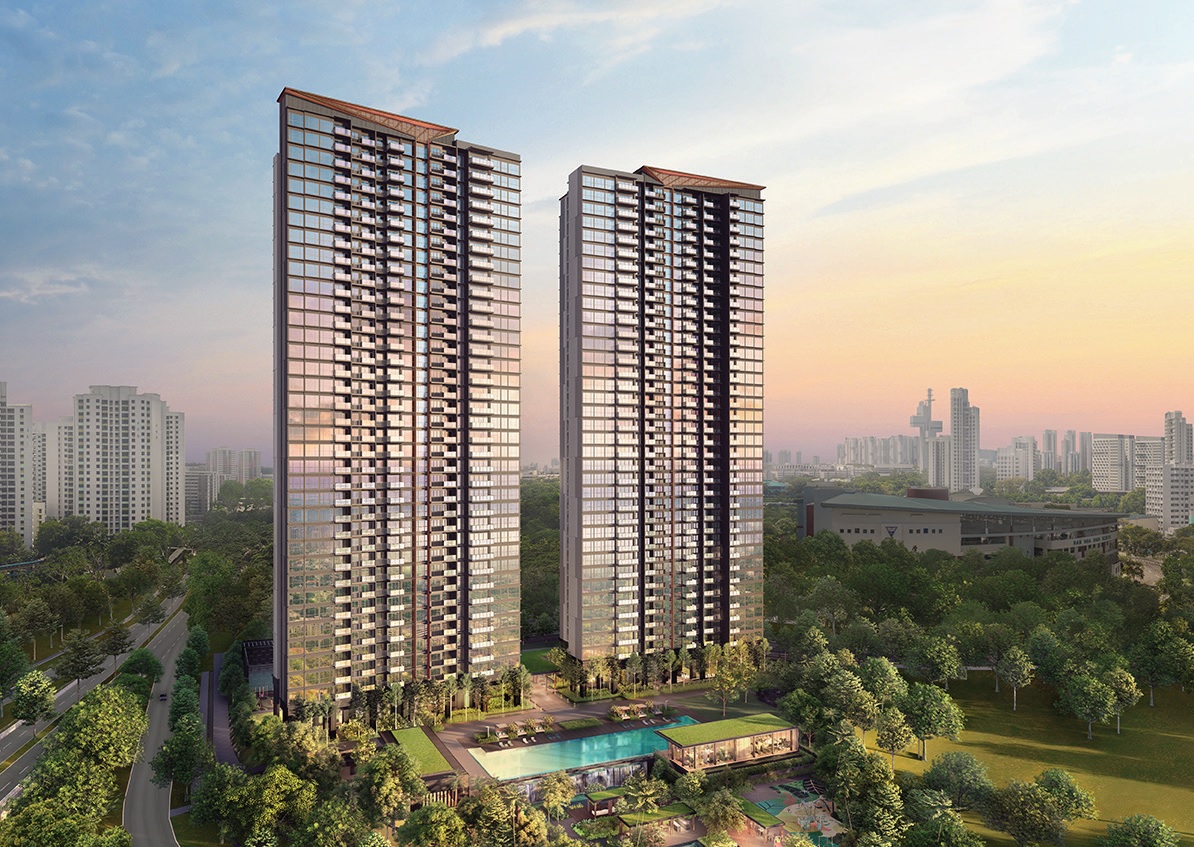
My wife and I have been a long time reader of Stacked home and we enjoyed the multiple analysis articles released. We are currently exploring housing options and would greatly appreciate your expertise in providing an analysis of the current market.
Both my spouse and I in our 30s, with one young child. Currently we own a two-bedder at Clavon together in our names (i.e., 50 per cent ownership each). Our combined household income is around $21,000 and we have a mortgage loan of around $500,000.
Our combined liquid assets are about $520,000 in cash and around $120,000 in CPF (we have used quite a fair bit of our CPF in our current property). We wanted to check which option below is more suitable for us:
(1) Decouple, and buy a resale three-bedder condo in Canberra area (e.g., the Commodore/Watergardens at Canberra) or other resale condos along the North-South Line (NSL), that are close to MRT stations and primary schools. The intent is to upgrade and to be nearby to support my family. We can rent out our current condo if we decouple.
(2) Sell our current property, and buy a resale three-bedder condo in Canberra/Yishun area along the NSL under one of our names, and a new launch unit under another. However, the prices of new launches are so high now, and consequently the purchase requires a large cash outlay. As such, we are not sure whether our current liquid assets are sufficient to do so.
Thank you very much for your time and assistance, and we look forward to your detailed analysis.
Hi there,
Thank you for reaching out, and thank you for the support thus far!
To answer your question properly, we broke the analysis into four parts.
First, we ran through the selling and decoupling calculations to understand the relevant liquidity issues.
Next, we examined your financing issues as individuals, since both scenarios involve buying a second property under each of your names.
We also compared the performance of your existing property (Clavon) and the projects you’ve shortlisted, and finally, we modelled the potential gains for both options over a ten-year horizon.
Based on the profile you’ve given us above, we will work on the assumption that your combined financial position appears to be as such, or close to it:
- A combined monthly income of $21,000,
- An outstanding home loan of $500,000,
- Cash savings of $520,000, and
- CPF balances totalling $120,000.
This is a good position for your next move: you have a stable income, strong liquidity, and the ability to consider more than one approach to upgrading. It’s just a question of which approach would position them better financially over the next decade.
The challenge for many buyers today isn't access to information.
It's interpreting that information in a way that makes sense for their finances, goals, and stage of life.
Over time, that's also why we decided to work with agents who shared the same data-driven and advisory-led approach behind our editorial, consultants who could help readers think through decisions more objectively, rather than simply push transactions.
Today, the team has worked with more than 2,000 clients across over $5B in property transactions.
Our working assumptions about the current Clavon property
As we don’t have the full breakdown of your original purchase, we’ve made a few assumptions for our calculations:
- The Clavon two-bedder was bought at launch
- We’ll use the average new sale price of a Clavon two-bedder at launch: $1,229,961
- We’ve assumed a lower loan quantum and a larger CPF-funded downpayment
As always, these figures are simply a modelling example; other readers can adjust the numbers to their situation, based on their actual purchase details. Based on these assumptions, the initial breakdown would look like this:
| Purchase price | $1,229,961 |
| 60% loan | $737,977 |
| 5% cash downpayment | $61,498 |
| 35% CPF downpayment | $430,486 |
Next, let’s consider the numbers if they sell
To understand what you might receive if you choose to sell the Clavon unit, we examined recent resale transactions.
Based on sales of two-bedroom units between January and October 2025, the average transacted price is $1,520,665. In the absence of the exact unit size, we’ll use this figure as a reasonable benchmark for the selling price.
The CPF refund figure is also an estimate; this can be adjusted if the exact principal and accrued interest used are known (if you ever need to check these sorts of details, you can login to MyCPF with your SingPass to have a look.)
Nonetheless, here’s what the sale would look like under our assumptions:
| Selling price | $1,520,665 |
| Outstanding loan | $500,000 |
| CPF to be refunded to OA (Principal + Interest) | $755,000 |
| Estimated cash proceeds | $265,665 |
These are the numbers if they choose to decouple
Decoupling means one of you sells their share of the Clavon unit to the other. This means one partner will now own no properties, and thus won’t incur ABSD upon purchasing a residential property.
For simplicity, we’ve assumed an even split across all components: income, CPF usage, cash, and ownership share. This mirrors most joint-tenancy arrangements in Singapore.
Under this approach, each of you is treated as owning 50 per cent of the property. The selling price and loan are therefore divided evenly, and the CPF refund is prorated as well.
We’ll work with the following numbers:
- Selling price: $1,520,665
- Outstanding loan: $500,000
- CPF refunded to each spouse’s OA: $377,500
Using these assumptions, the decoupling breakdown looks like this:
| Selling price | $1,520,665 |
| Outstanding loan | $500,000 |
| CPF to be refunded to the individual's OA | $377,500 |
| Seller | Buyer | |
| Shares | 50% | 50% |
| Valuation | $760,333 | $760,333 |
| Outstanding loan | $250,000 | $250,000 |
| CPF usage | $377,500 | N.A |
| BSD | - | $17,409 |
| Option fees | $38,017 (received) | $38,017 (paid) |
| Completion fees | - | $152,067 |
| Legal fees | $3,000 | $3,000 |
| New loan | - | $820,249 |
| CPF + cash proceeds | $507,333 | - |
From here, let’s look at the two upgrading paths we’re considering:
Option 1: Decouple, buy a resale three-bedder in Canberra/Yishun, and rent out the Clavon unit
The key here is to assess whether each of you can comfortably finance a property on your own. Decoupling only works if both sides can shoulder an entire mortgage individually. Here are the numbers:
Affordability Calculations
We again assume that everything is split evenly: income, CPF funds, and cash. This means each of you is evaluated with a monthly income of $10,500, supplemented by your share of CPF refunds and cash proceeds.
In this scenario, we also consider your existing $500,000 in cash savings and the proceeds generated from the decoupling of Clavon.
(CPF funds include both the refunded CPF from the sale transaction, as well as half of whatever remains in their OA balances.)
Based on a 29-year loan tenure at the floor interest rate of four per cent, a buyer in their 30s with a monthly income of $10,500 qualifies for a maximum loan amount of:
- Maximum loan: $1,188,336
- CPF funds available: $437,500
- Cash available: $649,833
This is a combined purchasing power of (total loan + CPF + cash): $2,275,669
After factoring in the Buyer’s Stamp Duty (BSD), we get:
- BSD on $2,275,669: $83,383
- Estimated affordability: $2,192,286
This puts you comfortably within the price range of resale three-bedders in both Canberra and Yishun, as well as other projects along the North–South Line.
So is decoupling feasible?
Based on the numbers above, yes. The person taking over Clavon can service the new loan of $820,249 independently, while the other has more than enough CPF and cash to purchase another property under their own name.
This forms the basis of Option 1, where you end up holding two properties: one for rental income (Clavon) and one for your own stay.
With that settled, our next question to tackle is this: Does it make sense to buy in Canberra or Yishun, even if they can?
To get a clearer picture, we went back 10 years and tracked how District 27 (Canberra and Yishun are within this district) performed against the broader resale market, both for overall condo prices and specifically for three-bedroom units.
| Year | Average $PSF of resale condos in D27 | Average $PSF of all resale condos |
| 2015 | $861 | $1,197 |
| 2016 | $809 | $1,248 |
| 2017 | $814 | $1,293 |
| 2018 | $855 | $1,323 |
| 2019 | $892 | $1,346 |
| 2020 | $865 | $1,280 |
| 2021 | $1,005 | $1,354 |
| 2022 | $1,129 | $1,473 |
| 2023 | $1,249 | $1,595 |
| 2024 | $1,269 | $1,681 |
| 2025 (Up to Q3) | $1,354 | $1,753 |
| Annualised | 4.64% | 3.89% |
Over the past decade, resale condos in D27 have consistently outperformed the islandwide average, so it’s a good sign so far.
Since you plan to upgrade to a three-bedroom unit though, we examined how that segment performed:
| Year | Average $PSF of resale 3-bedders in D27 | Average $PSF of all resale 3-bedders |
| 2015 | $791 | $1,086 |
| 2016 | $789 | $1,134 |
| 2017 | $784 | $1,154 |
| 2018 | $830 | $1,201 |
| 2019 | $869 | $1,227 |
| 2020 | $866 | $1,164 |
| 2021 | $966 | $1,253 |
| 2022 | $1,100 | $1,375 |
| 2023 | $1,241 | $1,493 |
| 2024 | $1,270 | $1,578 |
| 2025 (Up to Q3) | $1,345 | $1,669 |
| Annualised | 5.45% | 4.39% |
We see the same pattern here: three-bedroom units in D27 have grown faster than the islandwide average. In fact, the performance gap is even wider in the three-bedder segment. That said, past performance isn’t a guarantee of future results, and buyers should still assess upcoming supply and changing demand drivers.
With that benchmark price in mind, we modelled what buying a typical three-bedder in D27 would look like. Using the average 2025 transacted price of $1,412,159, this is how the numbers look:
| Purchase price | $1,412,159 |
| BSD | $41,086 |
| CPF + cash | $1,087,333 |
| Loan required | $365,912 |
We will assume a holding period of 10 years
| Interest expense (Assuming a 29-year tenure and 4% interest) | $223,255 |
| BSD | $41,086 |
| Property tax | $23,540 |
| Maintenance fees (Assuming $350/month) | $42,000 |
| Total cost | $329,881 |
Next, we want to forecast the likely price growth over the next 10 years. However, we can’t just use the recent transaction history - especially since the post-COVID period was exceptional and characterised by a supply crunch. It’s a bit over-optimistic to assume that will be the norm going forward.
The standard approach here is to use an exponential trendline, based on URA’s non-landed private home price index. This is the norm in property analysis, because home prices usually grow in a compounding way, not in a straight line.
We also relied on data from 2009 - 2025, reflecting Singapore’s modern cooling measures and credit-constrained era. While no forecast is perfect, this approach provides a statistically stable long-run growth estimate while smoothing out short-term volatility.
From this, we note that different housing types appreciate at different rates. Here’s the data:
- HDB (~2.59 per cent a year)
- Private Non-Landed Condos (~2.91 per cent a year)
- Landed Homes (~3.34 per cent a year)
For our forecasting, we used the long-run annualised growth rate of 2.91 per cent. This gives our baseline projection.
| Year | Property price | Gains |
| 0 | $1,412,159 | $0 |
| 1 | $1,453,253 | $41,094 |
| 2 | $1,495,542 | $83,383 |
| 3 | $1,539,063 | $126,904 |
| 4 | $1,583,849 | $171,690 |
| 5 | $1,629,940 | $217,781 |
| 6 | $1,677,371 | $265,212 |
| 7 | $1,726,182 | $314,023 |
| 8 | $1,776,414 | $364,255 |
| 9 | $1,828,108 | $415,949 |
| 10 | $1,881,306 | $469,147 |
| Potential profits from property 1: | $469,147 (gains) - $329,881 (total cost) = $139,265 |
This is a simplified forecasting model; actual performance will depend on market conditions, project selection, and other wider factors. But here’s what we have:
Taking the projected 10-year return of $469,147 and subtracting the estimated total holding costs of $329,881, the resale three-bedder yields an estimated gain of $139,265.
This represents the upside from the upgraded home in D27.
Next, we look at the second half of Option 1: retaining Clavon and renting it out.
First, we looked at Clavon’s profitability.
| Average % gains | Average gains | Average holding period (years) |
| 26.06% | $380,243 | 4.2 |
Now, we compare this to other 99-year leasehold condos launched in the same period:
| Project | Gain | Loss | ||||||
| Average % gains | Average gains | Average holding period (years) | Total number of units | Average % gains | Average gains | Average holding period (years) | Total number of units | |
| PENROSE | 33.19% | $475,324 | 4.3 | 80 | ||||
| CLAVON | 26.06% | $380,243 | 4.2 | 59 | ||||
| VERDALE | 12.98% | $163,920 | 4.0 | 5 | ||||
| KOPAR AT NEWTON | 11.27% | $264,708 | 4.2 | 13 | ||||
| THE LANDMARK | 6.76% | $102,000 | 4.6 | 1 | -1.81% | -$19,000 | 4.5 | 1 |
| THE M | 6.18% | $95,880 | 5.2 | 10 | -0.19% | -$4,000 | 3.1 | 1 |
With the exception of Penrose, which started at the lowest price point, Clavon has seen the highest percentage growth rate.
Again, assuming an annualised growth rate of 2.91 per cent, the property price could potentially be:
| Year | Property price | Gains |
| 0 | $1,520,665 | $0 |
| 1 | $1,564,916 | $44,251 |
| 2 | $1,610,455 | $89,790 |
| 3 | $1,657,320 | $136,655 |
| 4 | $1,705,548 | $184,883 |
| 5 | $1,755,179 | $234,514 |
| 6 | $1,806,255 | $285,590 |
| 7 | $1,858,817 | $338,152 |
| 8 | $1,912,908 | $392,243 |
| 9 | $1,968,574 | $447,909 |
| 10 | $2,025,860 | $505,195 |
At this pace, Clavon reaches an estimated $2.025 million in Year 10, translating into $505,195 in capital gains over the decade. This forms the capital appreciation component of Option 1; so next, we add the rental returns.
Rent calculations
From 2024 to Q3 2025, the average rent of a 2-bedder in Clavon is $4402
For calculation purposes, we will assume the rent stays constant throughout the 10 years
| Rental income | $528,240 |
| Mortgage interest | $293,982 |
| Agency fee (Assuming it's paid once every 2 years) | $23,990 |
| Upkeeping cost (Assuming $1000/year) | $10,000 |
| Gains | $200,268 |
| Potential profits from property 2: | $505,195 (gains from property appreciation) + $200,268 (rental gains) - $20,409 (decoupling cost - BSD + legal fee) = $685,053 |
| Total potential profits from both properties in 10 years' time: | $824,318 |
Total Projected Gains Under Option 1
Adding together the projected profits from the D27 upgrade ($139,265) and the updated Clavon investment component ($685,053), the combined potential upside over 10 years is: $824,318
This forms the complete financial picture for Option 1.
Up next is Option 2, where you sell Clavon entirely and reinvest in a resale home plus a new launch unit.
For option 2, let’s begin by looking at affordability after the sale of Clavon:
| Selling price | $1,520,665 |
| Outstanding loan | $500,000 |
| CPF to be refunded to OA (Principal + Interest) | $755,000 |
| Estimated cash proceeds | $265,665 |
Now, let’s see what can be manageable with this amount:
For simplicity, we again assume everything is split evenly between the two of you. Based on an individual monthly income of $10,500, being in your 30s, and a 29 year loan tenure at four per cent interest, the maximum loan quantum works out to:
| Maximum loan based on the buyer being in their 30s with a monthly income of $10,500 (at a 4% interest rate with a 29 year tenure) | $1,188,336 |
| CPF funds | $437,500 |
| Cash | $392,833 |
| Total loan + CPF + cash | $2,018,669 |
| BSD based on $2,018,669 | $70,533 |
| Estimated affordability | $1,948,136 |
Individually, this means each of you can afford a property of up to $1,948,136. In practice though, this ceiling is flexible: because of your strong cash position, your affordability can be adjusted upward or downward, depending on how you choose to structure CPF versus cash usage across both purchases.
For your own-stay unit, we’ll keep the assumptions consistent with Option 1.
That means using the same price benchmarks for a three-bedroom resale home in the desired area.
Our next step is to examine the investment property under Option 2: specifically, what a second new launch might cost.
To do that, we looked at the average new-sale prices for units transacted in the first three quarters of 2025 (excluding Executive Condominiums), broken down by bedroom type:
| Unit type | 1-bedroom | 2-bedroom | 3-bedroom | 4-bedroom |
| Average transacted price | $1,287,270 | $1,779,725 | $2,496,517 | $3,554,429 |
These are the new launch two-bedder prices in the different districts, as of Q3 2025:
| District | 1-bedroom | 2-bedroom | 3-bedroom | 4-bedroom |
| 1 | $1,259,983 | $2,065,660 | $3,155,709 | $4,979,629 |
| 2 | $1,320,231 | $1,964,921 | $3,716,167 | |
| 3 | $1,447,282 | $1,933,844 | $2,819,005 | $3,932,814 |
| 5 | $1,282,188 | $1,746,153 | $2,333,483 | $3,108,754 |
| 6 | $1,507,667 | $3,587,500 | $5,557,333 | |
| 7 | $1,665,000 | $2,045,423 | $3,266,848 | $5,306,592 |
| 9 | $1,340,930 | $1,838,069 | $2,621,710 | $7,578,750 |
| 10 | $1,734,500 | $2,053,891 | $2,907,228 | $5,495,726 |
| 11 | $2,773,240 | $7,966,500 | ||
| 12 | $1,415,000 | $1,845,770 | $2,609,661 | $3,307,144 |
| 14 | $2,407,900 | |||
| 15 | $1,456,219 | $2,029,032 | $3,141,015 | $3,812,857 |
| 16 | $1,284,778 | $1,878,595 | $2,373,052 | $3,098,130 |
| 17 | $1,160,000 | $1,568,554 | $1,935,000 | $2,571,500 |
| 18 | $1,190,014 | $1,632,802 | $2,422,724 | $3,179,065 |
| 19 | $1,425,000 | $1,983,612 | $2,753,362 | $3,268,090 |
| 20 | $1,028,000 | $1,669,000 | $2,459,571 | $2,628,000 |
| 21 | $1,394,000 | $2,016,434 | $2,839,650 | $3,645,331 |
| 22 | $1,345,633 | $1,639,708 | $2,388,166 | $3,112,248 |
| 23 | $1,342,000 | $1,692,675 | $2,158,211 | $2,715,264 |
| 25 | $2,720,333 | |||
| 26 | $1,083,728 | $1,464,121 | $2,035,871 | $2,741,224 |
| 27 | $880,000 | $1,288,034 | $1,685,812 | $2,302,860 |
One advantage of going the new-launch route is the Progressive Payment Scheme (PPS), which keeps interest costs lower during the construction years. This can make a new launch feel more manageable on a month-to-month basis.
(On the flip side, mind you, a new launch unit comes with construction time and cannot be rented out as soon as a resale unit.)
That said, it’s also important to stay grounded: not every new launch is guaranteed to be profitable, nor do they automatically outperform the resale market.
Ultimately, the outcome depends heavily on the specific project you pick; its entry price, future supply in the area, layout efficiency, and the broader market cycle at the point of exit.
With that in mind, we modelled a typical investment path using the average prices of new launches sold in 2025.
Let’s assume you buy a two-bedroom new launch at the average price of $1,779,725. You rent it out once the project obtains TOP.
For consistency, we’ll model this over a 10-year holding period, accounting for PPS, rental income, and typical ownership costs.
| Purchase price | $1,779,725 |
| BSD | $58,586 |
| CPF + cash | $830,333 |
| Loan required | $1,007,978 |
We will assume the longest completion stages for each point of the PPS:
| Stage | % of purchase price | Disbursement amount | Monthly estimated interest | Monthly estimated principal | Monthly estimated repayment | Duration | Total interest cost |
| Completion of foundation | 5% | $0 | $0 | $0 | $0 | 6-9 months (from launch) | $0 |
| Completion of reinforced concrete | 10% | $0 | $0 | $0 | $0 | 6-9 months | $0 |
| Completion of brick wall | 5% | $29,129 | $97 | $44 | $141 | 3-6 months | $582 |
| Completion of ceiling/roofing | 5% | $118,116 | $394 | $180 | $574 | 3-6 months | $2,364 |
| Completion of electrical wiring/plumbing | 5% | $207,102 | $690 | $316 | $1,006 | 3-6 months | $4,140 |
| Completion of roads/car parks/drainage | 5% | $296,088 | $987 | $452 | $1,439 | 3-6 months | $5,922 |
| Issuance of TOP | 25% | $741,019 | $2,470 | $1,131 | $3,601 | Usually a year before CSC | $29,640 |
| Certificate of Statutory Completion (CSC) | 15% | $1,007,978 | $3,360 | $1,539 | $4,899 | Monthly repayment until property is sold | $221,760 |
| Total interest paid in 10 years | $264,408 |
Note that in practice, not all construction proceeds at this exact pace. It can be quicker or slower at times, and in some cases, multiple phases may be completed at once.
For rental modelling, we used a conservative three per cent yield, which is in line with today’s typical returns for compact non-central units. Because the new launch will only be rentable after TOP, the effective rental period over a 10-year horizon is 6.5 years. Before TOP, there will be no property tax or maintenance costs incurred.
Here’s how the numbers stack up:
- Rental income: $347,046
- Interest expense (29-year tenure, 4% interest): $264,408
- Buyer’s Stamp Duty (BSD): $58,586
- Property tax: $58,169
- Maintenance fees (estimated $250/month): $19,500
- Agency fees (paid every 2 years): $19,396
- Upkeep allowance ($1,000/year): $6,500
After accounting for all these expenses, this comes to a total cost of $79,512. We will use this amount as the basis for the investment property's eventual profits.
Assuming an appreciation of 2.91 per cent again, our projected value would be:
| Year | Property price | Gains |
| 0 | $1,779,725 | $0 |
| 1 | $1,831,515 | $51,790 |
| 2 | $1,884,812 | $105,087 |
| 3 | $1,939,660 | $159,935 |
| 4 | $1,996,104 | $216,379 |
| 5 | $2,054,191 | $274,466 |
| 6 | $2,113,968 | $334,243 |
| 7 | $2,175,484 | $395,759 |
| 8 | $2,238,791 | $459,066 |
| 9 | $2,303,940 | $524,215 |
| 10 | $2,370,984 | $591,259 |
| Potential profits from property 2: | $591,259 (gains from property appreciation) - $79,512 (total cost) = $511,747 | |
| Total potential profits from both properties in 10 years' time: | $651,012 |
Our conclusion based on the above:
Because some inputs are based on assumptions, their actual results will vary once real CPF usage, cash outlay, and loan details are factored in. Still, the comparison gives a good sense of the trade-offs.
Both options are workable, but Option 1 is possibly stronger
This option shows higher projected gains for you, mainly because you will:
- Start earning rent from Clavon immediately
- Buy into a district that has outperformed the resale market
- Hold two appreciating assets over the same period
If maximising long-term returns is the goal, Option 1 is the better financial choice.
As for Option 2, this path still works, and progressive payments help cash flow. But it only catches up if the new launch significantly outperforms the broader market, because rental income starts coming in only after construction.
So the bottom line is that Option 1 has the edge, thanks mainly to immediate rental income and stronger projected gains.
At Stacked, we like to look beyond the headlines and surface-level numbers, and focus on how things play out in the real world.
If you'd like to discuss how this applies to your own circumstances, you can reach out for a one-to-one consultation here.
And if you simply have a question or want to share a thought, feel free to write to us at stories@stackedhomes.com. We read every message.





0 Comments