

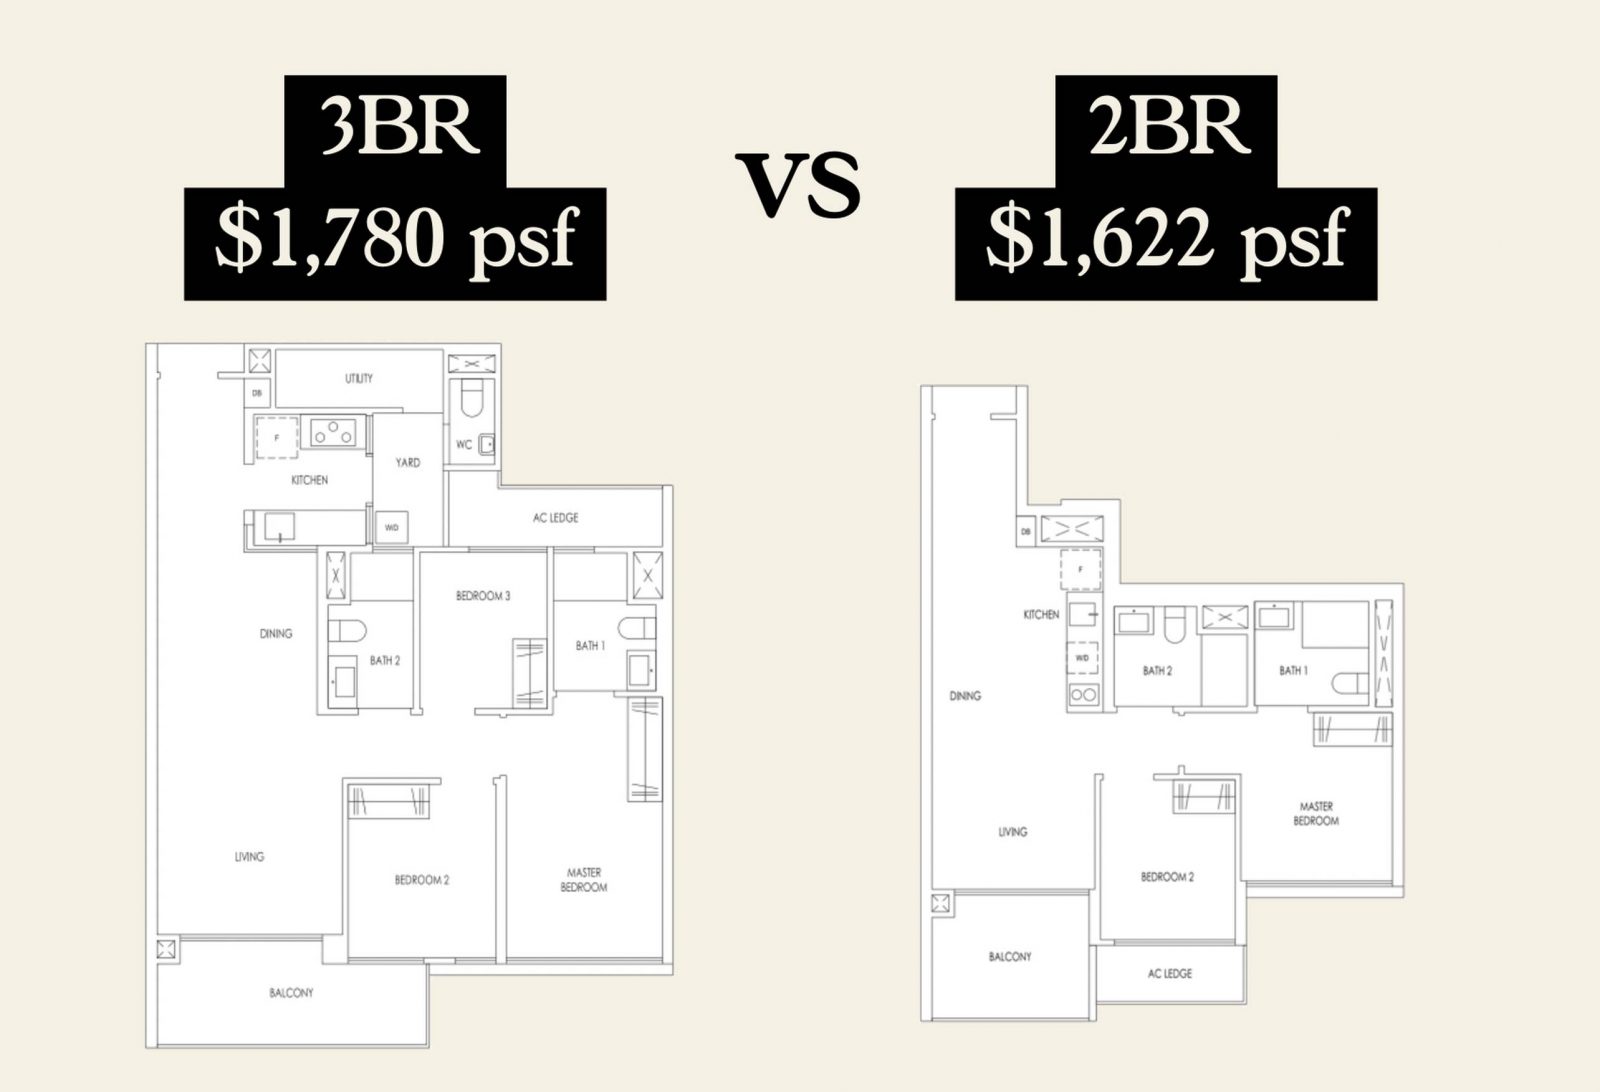
With the exception of some penthouses or very special premium units, the rule of thumb is “Smaller unit = higher price psf”. Condos like Piccadilly Grand, for example, had one-bedders which were priced at close to $2,200 psf at launch, while the biggest 5-bedders were just below $1,900 psf.
Conversely, some of the biggest Sentosa Cove bungalows may have a price psf as low as $1,200, although they’re so big the overall quantum could well be $15 million or more. So it’s unusual that, over the past year or so, we’ve seen a trend where bigger units seem to show a higher price psf, sometimes even surpassing smaller ones. What’s happening? Let’s have a closer look:
The challenge for many buyers today isn't access to information.
It's interpreting that information in a way that makes sense for their finances, goals, and stage of life.
Over time, that's also why we decided to work with agents who shared the same data-driven and advisory-led approach behind our editorial, consultants who could help readers think through decisions more objectively, rather than simply push transactions.
Today, the team has worked with more than 2,000 clients across over $5B in property transactions.
A snapshot of the overall pattern
First, we want to see what we can learn from the data, and see if there’s some kind of emerging pattern. Second, we’ll try to identify when exactly the trend began, as that might also give some clue as to what’s going on. To wit, here’s a general look at the price movements, based on the following size categories:
- 500 sq. ft. or under (Shoeboxes)
- 850 sq. ft. or under
- 1,200 sq. ft. or under
- 1,800 sq. ft. or under
- Anything above 1,800 sq. ft.
Divided this way, these are the prices psf of private non-landed homes (excluding ECs) since 1995:
| Year | 1) Less Than 500 Sq Ft | 2) Less Than 850 Sq Ft | 3) Less Than 1,200 Sq Ft | 4) Less Than 1,800 Sq Ft | 5) More Than 1,800 Sq Ft |
| 1995 | $730 | $794 | $686 | $675 | $682 |
| 1996 | $964 | $908 | $770 | $764 | $918 |
| 1997 | $838 | $996 | $726 | $743 | $849 |
| 1998 | $738 | $629 | $518 | $511 | $533 |
| 1999 | $691 | $789 | $632 | $604 | $607 |
| 2000 | $732 | $849 | $684 | $690 | $699 |
| 2001 | $785 | $741 | $589 | $558 | $572 |
| 2002 | $709 | $767 | $574 | $560 | $571 |
| 2003 | $689 | $695 | $571 | $530 | $539 |
| 2004 | $683 | $736 | $600 | $547 | $617 |
| 2005 | $701 | $812 | $628 | $618 | $670 |
| 2006 | $992 | $900 | $700 | $692 | $997 |
| 2007 | $1,128 | $1,237 | $925 | $933 | $1,408 |
| 2008 | $1,263 | $1,156 | $836 | $848 | $1,210 |
| 2009 | $1,282 | $1,153 | $888 | $859 | $1,168 |
| 2010 | $1,453 | $1,404 | $1,084 | $1,018 | $1,384 |
| 2011 | $1,545 | $1,355 | $1,076 | $1,083 | $1,421 |
| 2012 | $1,398 | $1,334 | $1,113 | $1,122 | $1,357 |
| 2013 | $1,541 | $1,503 | $1,258 | $1,269 | $1,475 |
| 2014 | $1,496 | $1,454 | $1,287 | $1,210 | $1,469 |
| 2015 | $1,405 | $1,378 | $1,206 | $1,145 | $1,444 |
| 2016 | $1,520 | $1,486 | $1,264 | $1,214 | $1,397 |
| 2017 | $1,651 | $1,560 | $1,326 | $1,231 | $1,455 |
| 2018 | $1,621 | $1,645 | $1,367 | $1,332 | $1,670 |
| 2019 | $1,777 | $1,755 | $1,461 | $1,393 | $1,818 |
| 2020 | $1,808 | $1,747 | $1,463 | $1,352 | $1,602 |
| 2021 | $1,969 | $1,851 | $1,547 | $1,496 | $1,760 |
| 2022 | $1,885 | $1,974 | $1,670 | $1,681 | $1,980 |
| 2023 | $2,017 | $2,138 | $1,831 | $1,780 | $2,075 |
| 2024 | $1,900 | $2,018 | $1,835 | $1,733 | $1,831 |
This table shows the percentage premium or discount, compared to the 500 sq. ft. or smaller shoeboxes:
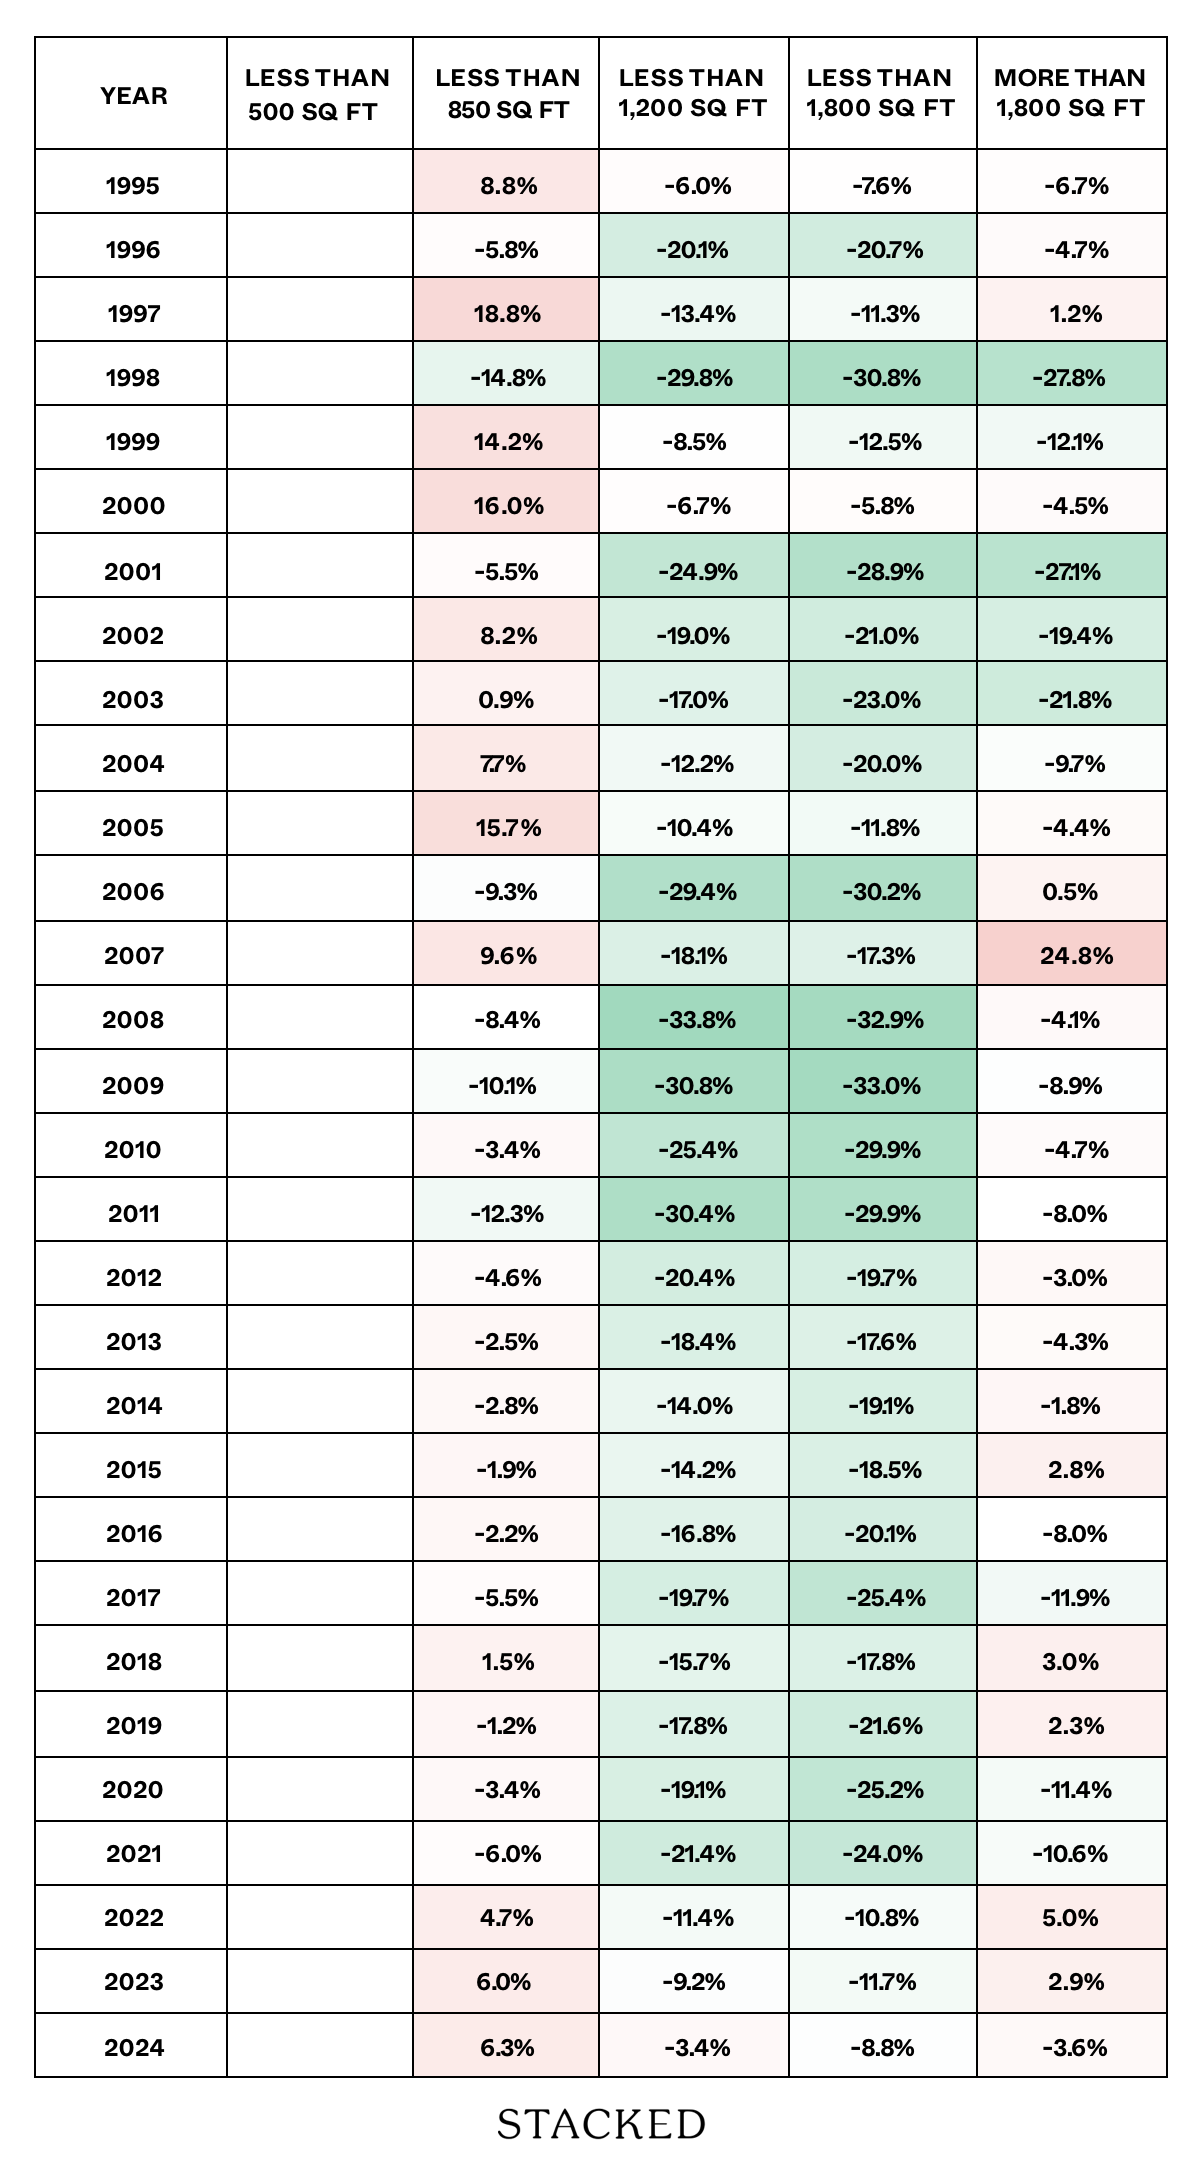
The discounts in the 850 and 1,800 sq. ft. categories are the largest, in relation to the shoeboxes. But the important thing is that, since 2022, there’s been a premium rather than a discount, for units in the 500 and 850 sq. ft. categories. The trend is clearly upward for these smaller units.
Next, we’ll look specifically at new launches, and see how the prices have moved there:
| Year | 1) Less Than 500 Sq Ft | 2) Less Than 850 Sq Ft | 3) Less Than 1,200 Sq Ft | 4) Less Than 1,800 Sq Ft | 5) More Than 1,800 Sq Ft |
| 1995 | $1,515 | $764 | $701 | $696 | $835 |
| 1996 | $1,475 | $898 | $756 | $741 | $1,149 |
| 1997 | $876 | $1,051 | $717 | $762 | $1,059 |
| 1998 | $879 | $608 | $504 | $495 | $438 |
| 1999 | $694 | $841 | $626 | $598 | $598 |
| 2000 | $920 | $710 | $709 | $754 | |
| 2001 | $785 | $732 | $591 | $571 | $559 |
| 2002 | $741 | $827 | $581 | $578 | $585 |
| 2003 | $738 | $606 | $581 | $653 | |
| 2004 | $757 | $790 | $667 | $617 | $795 |
| 2005 | $770 | $849 | $716 | $723 | $836 |
| 2006 | $1,020 | $933 | $791 | $797 | $1,349 |
| 2007 | $1,151 | $1,364 | $1,093 | $1,079 | $1,802 |
| 2008 | $1,296 | $1,188 | $956 | $935 | $1,641 |
| 2009 | $1,305 | $1,146 | $961 | $931 | $1,329 |
| 2010 | $1,457 | $1,440 | $1,270 | $1,206 | $1,637 |
| 2011 | $1,537 | $1,323 | $1,080 | $1,175 | $1,619 |
| 2012 | $1,370 | $1,300 | $1,087 | $1,125 | $1,368 |
| 2013 | $1,518 | $1,496 | $1,268 | $1,326 | $1,478 |
| 2014 | $1,472 | $1,446 | $1,368 | $1,357 | $1,785 |
| 2015 | $1,375 | $1,365 | $1,257 | $1,208 | $1,578 |
| 2016 | $1,517 | $1,461 | $1,354 | $1,352 | $1,739 |
| 2017 | $1,639 | $1,565 | $1,439 | $1,425 | $1,429 |
| 2018 | $1,658 | $1,710 | $1,578 | $1,689 | $2,238 |
| 2019 | $1,860 | $1,814 | $1,637 | $1,864 | $2,914 |
| 2020 | $2,025 | $1,836 | $1,667 | $1,717 | $2,449 |
| 2021 | $2,456 | $2,062 | $1,896 | $1,921 | $3,018 |
| 2022 | $2,669 | $2,393 | $2,131 | $2,244 | $2,925 |
| 2023 | $2,740 | $2,507 | $2,426 | $2,479 | $3,119 |
| 2024 | $2,453 | $2,365 | $2,270 | $2,359 | $3,285 |
And the relevant premium/discounts:
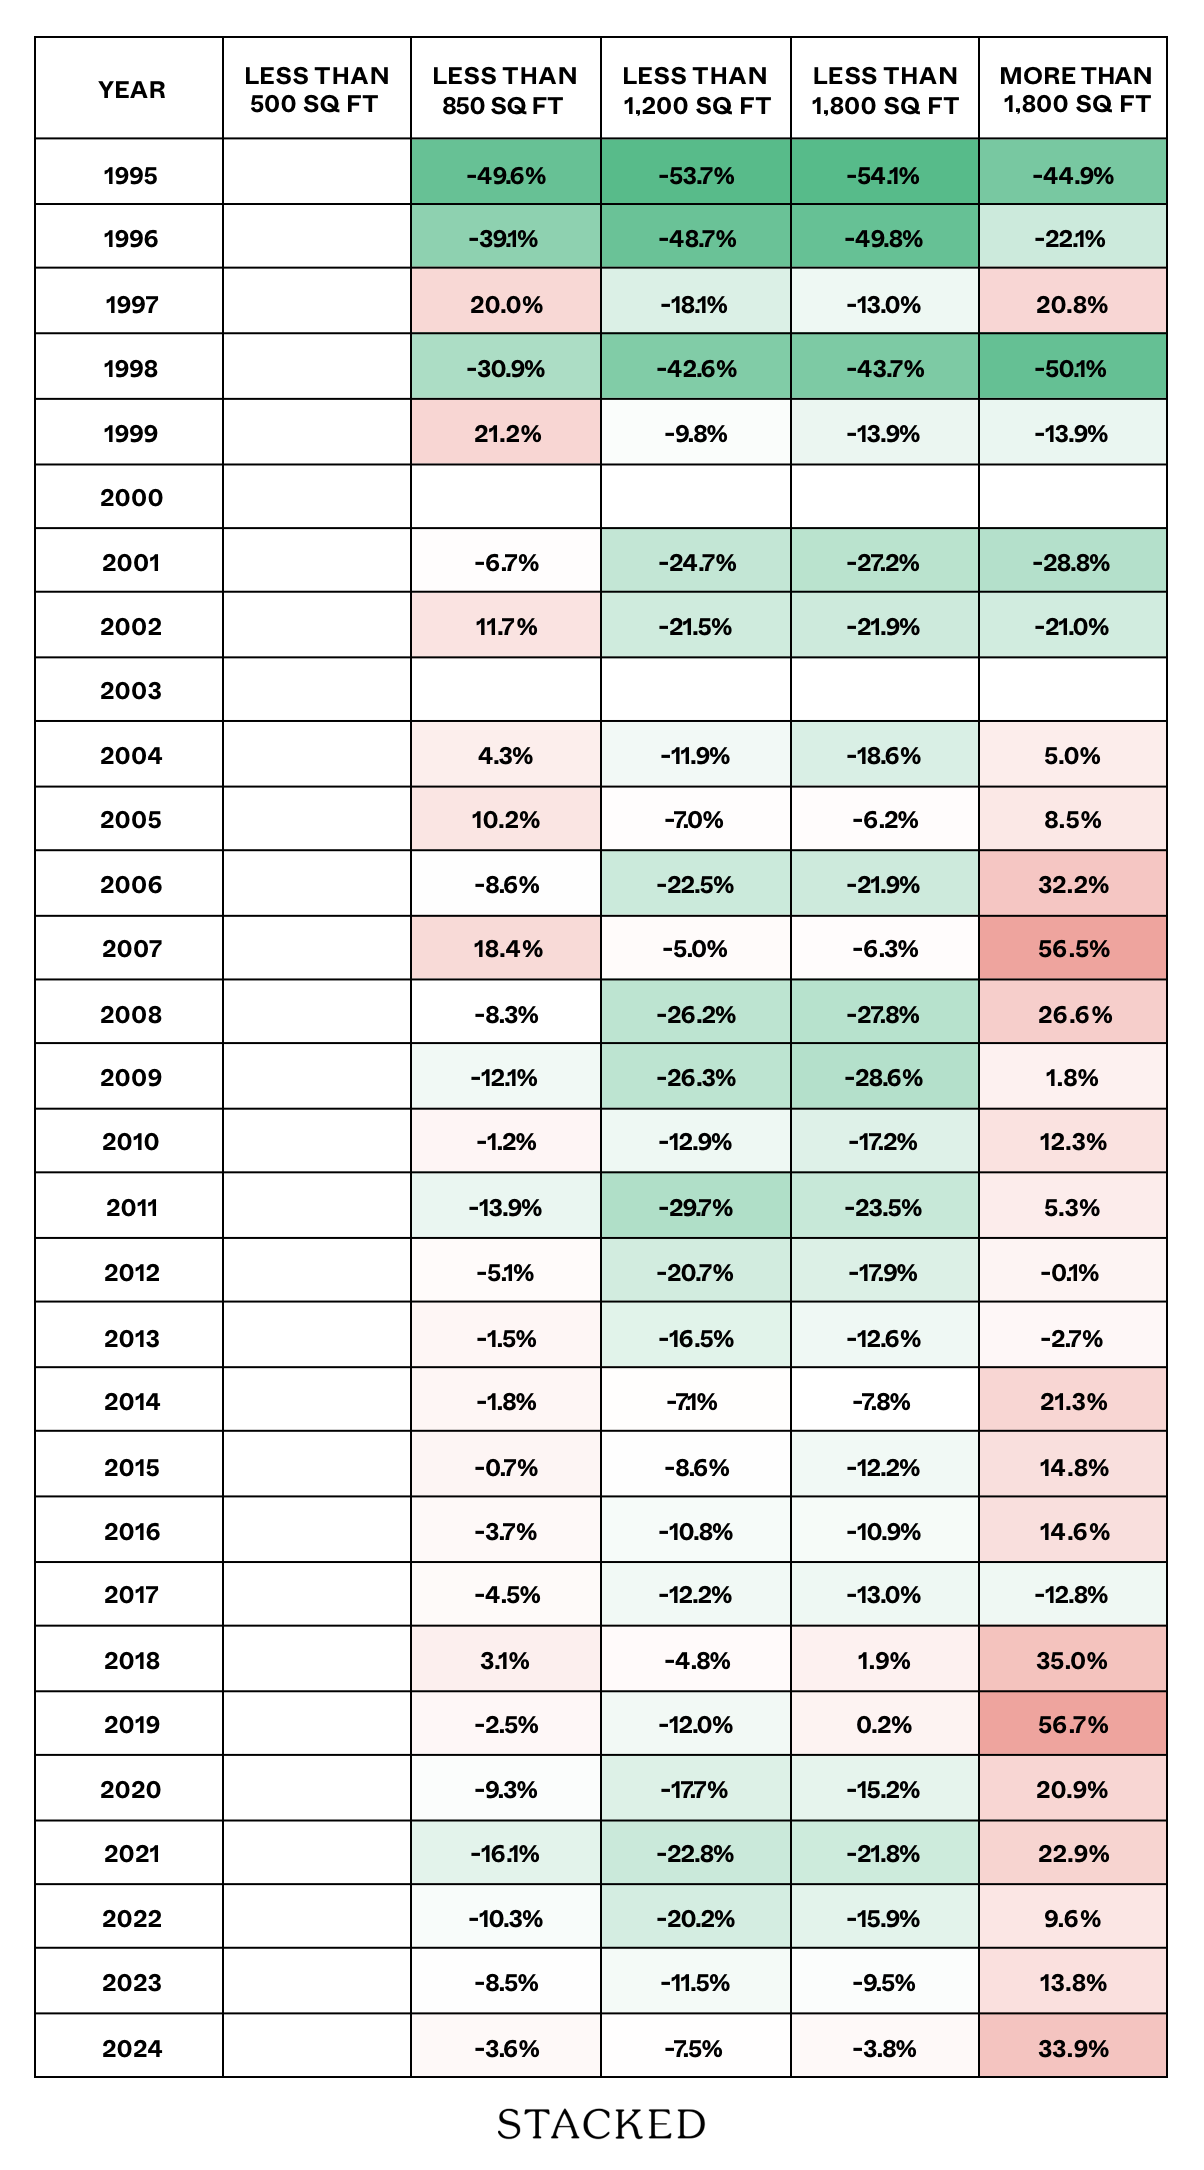
While the pattern is generally similar, a difference is that the greatest premium comes from the largest units, which are 1,800+ sq. ft. This is different from the 500 to 1,800 sq. ft. category, where discounts can still be found.
This quirk may be due to the very largest units, such as penthouses or other special units, having a different pricing model. It’s possible for a penthouse to be both bigger and have a higher price psf, for instance, as the developer is pricing in added luxury features (high ceiling, etc).
Perhaps the trend is not universal though, but only in certain regions; so we need to check this out too.
The market for different unit sizes can vary significantly by region. Some landlords, for instance, believe that shoebox units can only do well in the CCR but not the OCR, as the CCR has a higher composition of single expatriate tenants.
Now it’s not our intent to prove or disprove that theory right now - the point is that unit sizes weigh differently based on region. So let’s break it down this way, starting with just the CCR:
| Year | 1) Less Than 500 Sq Ft | 2) Less Than 850 Sq Ft | 3) Less Than 1,200 Sq Ft | 4) Less Than 1,800 Sq Ft | 5) More Than 1,800 Sq Ft |
| 1995 | $1,515 | $852 | $911 | $984 | $1,271 |
| 1996 | $1,475 | $1,216 | $1,071 | $1,071 | $1,711 |
| 1997 | $1,267 | $1,229 | $1,262 | $1,718 | |
| 1998 | $859 | $790 | $723 | $718 | |
| 1999 | $992 | $1,047 | $886 | $855 | $997 |
| 2000 | $1,208 | $1,004 | $1,008 | $1,099 | |
| 2001 | $927 | $891 | $859 | $879 | |
| 2002 | $959 | $877 | $812 | $804 | |
| 2003 | $757 | $831 | $820 | $908 | |
| 2004 | $777 | $905 | $929 | $852 | $1,028 |
| 2005 | $815 | $1,011 | $911 | $997 | $1,062 |
| 2006 | $1,145 | $1,197 | $1,171 | $1,220 | $1,692 |
| 2007 | $1,481 | $1,887 | $1,707 | $1,777 | $2,140 |
| 2008 | $1,496 | $1,515 | $1,579 | $1,901 | $2,766 |
| 2009 | $1,859 | $1,462 | $1,480 | $1,526 | $1,756 |
| 2010 | $2,112 | $2,036 | $1,945 | $1,930 | $2,114 |
| 2011 | $2,159 | $2,207 | $2,133 | $2,041 | $2,365 |
| 2012 | $2,234 | $2,304 | $1,969 | $1,920 | $2,186 |
| 2013 | $2,263 | $2,256 | $2,000 | $1,626 | $2,005 |
| 2014 | $2,324 | $2,269 | $2,184 | $1,992 | $2,166 |
| 2015 | $2,359 | $2,180 | $2,088 | $1,989 | $1,964 |
| 2016 | $2,299 | $2,271 | $2,259 | $2,372 | $2,230 |
| 2017 | $2,349 | $2,135 | $2,270 | $2,218 | $2,310 |
| 2018 | $3,041 | $2,952 | $2,655 | $2,625 | $2,715 |
| 2019 | $2,947 | $2,700 | $2,548 | $2,935 | $3,474 |
| 2020 | $2,567 | $2,501 | $2,506 | $2,795 | $3,172 |
| 2021 | $2,789 | $2,631 | $2,613 | $2,896 | $3,670 |
| 2022 | $2,955 | $2,775 | $2,734 | $2,930 | $3,344 |
| 2023 | $3,229 | $2,905 | $2,893 | $3,047 | $3,393 |
| 2024 | $3,342 | $3,129 | $3,090 | $3,194 | $3,487 |
And the relevant premium/discount:
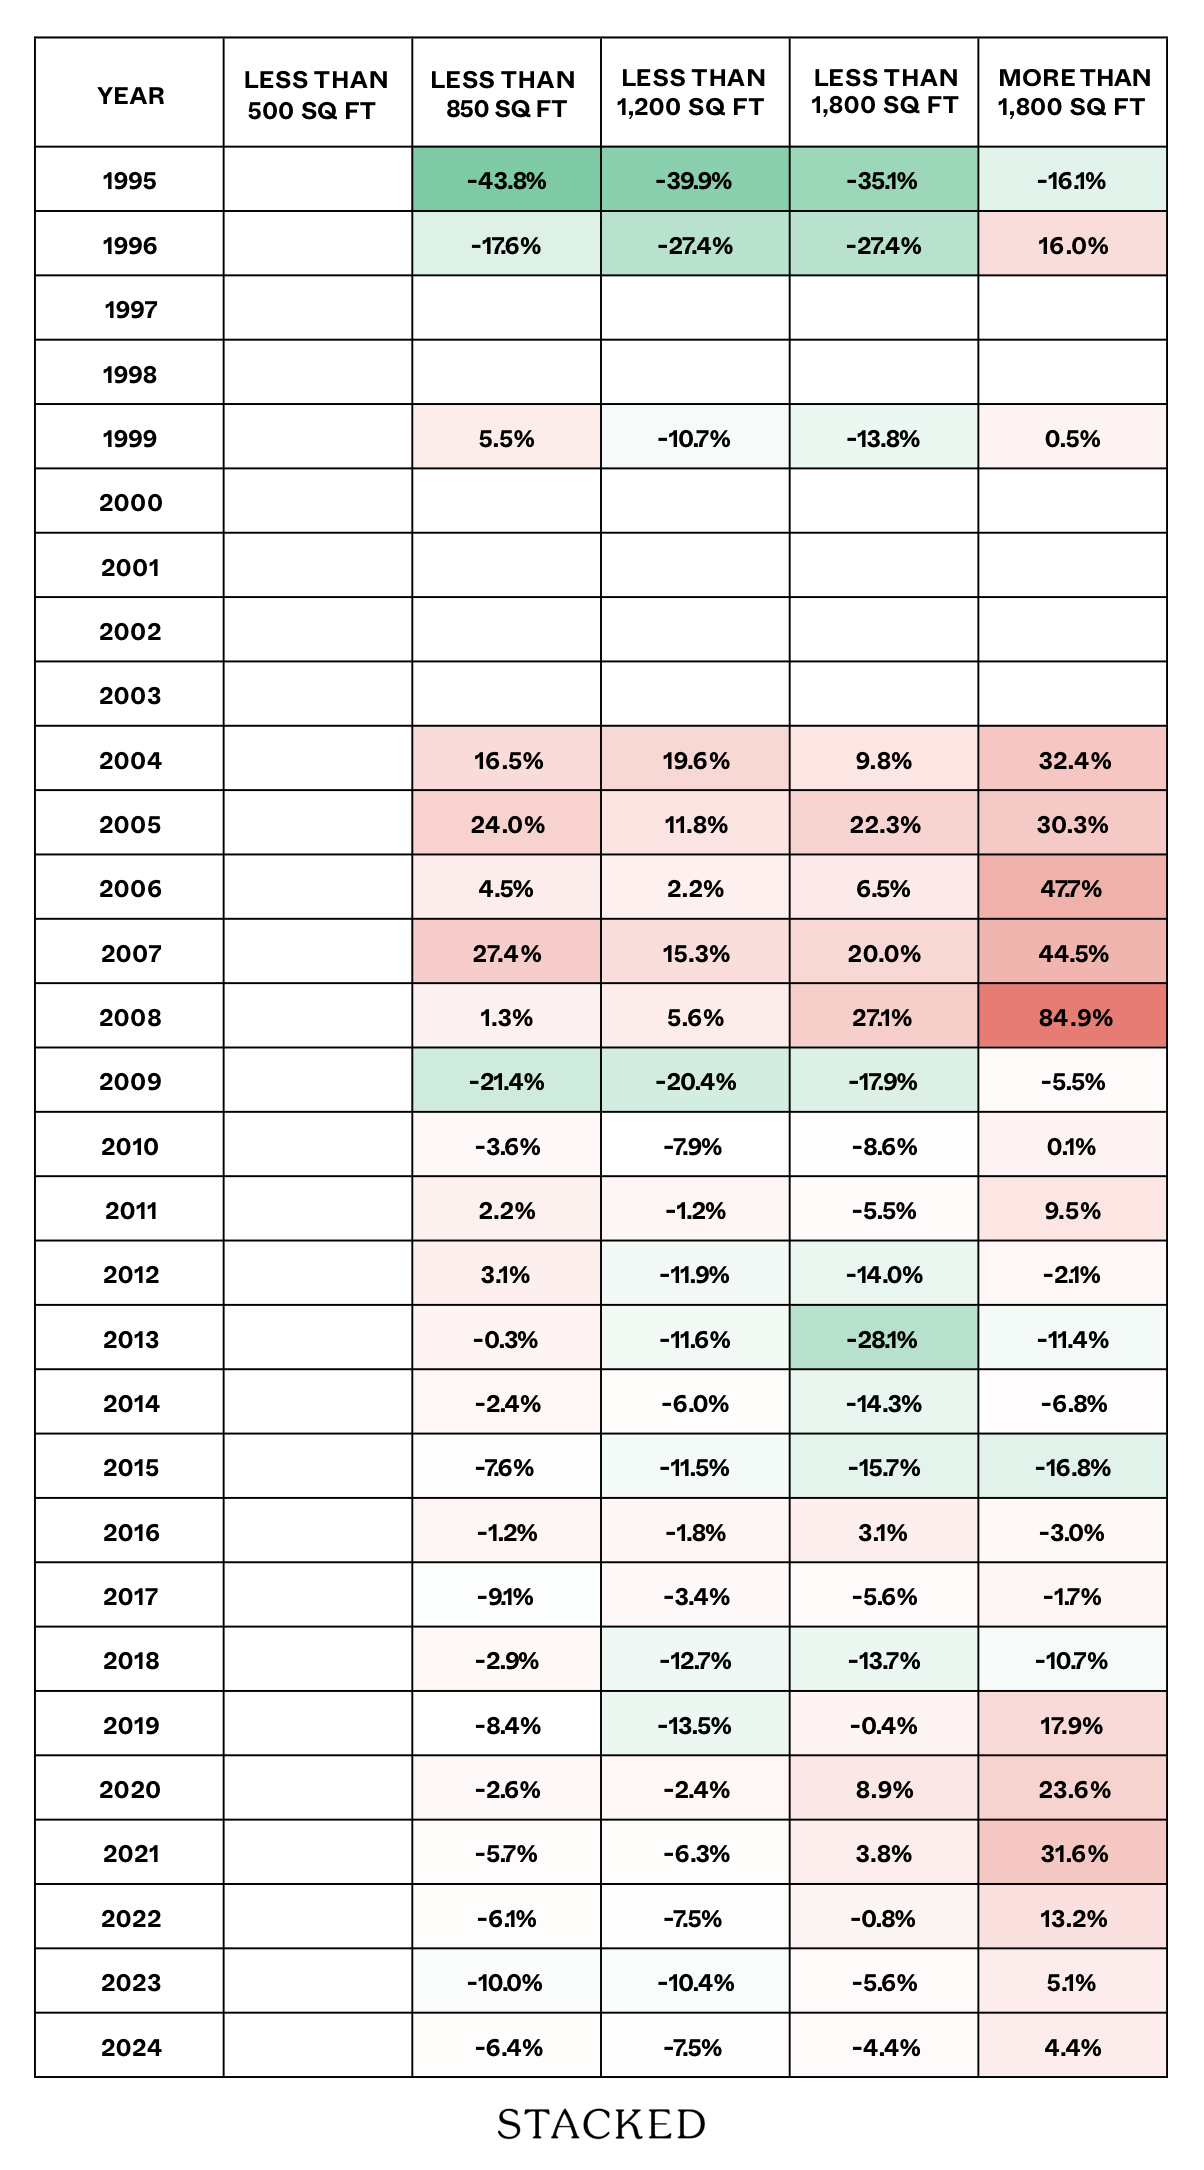
As matches the general overview, the largest 1,800+ sq. ft. units seem to seeing a premium, compared to smaller counterparts.
Next, let’s look at the RCR:
| Year | 1) Less Than 500 Sq Ft | 2) Less Than 850 Sq Ft | 3) Less Than 1,200 Sq Ft | 4) Less Than 1,800 Sq Ft | 5) More Than 1,800 Sq Ft |
| 1995 | $819 | $725 | $700 | $745 | |
| 1996 | $977 | $796 | $806 | $773 | |
| 1997 | $876 | $1,094 | $852 | $849 | $963 |
| 1998 | $879 | $730 | $570 | $546 | $584 |
| 1999 | $677 | $781 | $617 | $576 | $663 |
| 2000 | $902 | $728 | $779 | $752 | |
| 2001 | $775 | $748 | $631 | $649 | $553 |
| 2002 | $687 | $674 | $581 | $581 | $449 |
| 2003 | $701 | $590 | $553 | $416 | |
| 2004 | $718 | $654 | $630 | $605 | $483 |
| 2005 | $720 | $696 | $625 | $651 | $568 |
| 2006 | $782 | $726 | $661 | $701 | $578 |
| 2007 | $928 | $1,001 | $1,067 | $1,163 | $1,441 |
| 2008 | $1,137 | $1,042 | $1,024 | $920 | $1,082 |
| 2009 | $1,170 | $999 | $968 | $942 | $948 |
| 2010 | $1,329 | $1,359 | $1,322 | $1,266 | $1,226 |
| 2011 | $1,496 | $1,484 | $1,396 | $1,456 | $1,576 |
| 2012 | $1,419 | $1,474 | $1,345 | $1,412 | $1,593 |
| 2013 | $1,587 | $1,566 | $1,443 | $1,527 | $1,242 |
| 2014 | $1,484 | $1,531 | $1,518 | $1,418 | $1,608 |
| 2015 | $1,539 | $1,551 | $1,520 | $1,443 | $1,490 |
| 2016 | $1,604 | $1,548 | $1,516 | $1,483 | $1,339 |
| 2017 | $1,788 | $1,703 | $1,590 | $1,527 | $1,713 |
| 2018 | $1,822 | $1,789 | $1,720 | $1,691 | $1,548 |
| 2019 | $2,012 | $1,945 | $1,800 | $1,883 | $2,050 |
| 2020 | $2,031 | $1,907 | $1,763 | $1,847 | $1,890 |
| 2021 | $2,429 | $2,115 | $2,013 | $2,101 | $2,568 |
| 2022 | $2,554 | $2,326 | $2,127 | $2,295 | $2,695 |
| 2023 | $2,639 | $2,551 | $2,489 | $2,415 | $2,605 |
| 2024 | $3,038 | $2,657 | $2,534 | $2,473 | $2,745 |
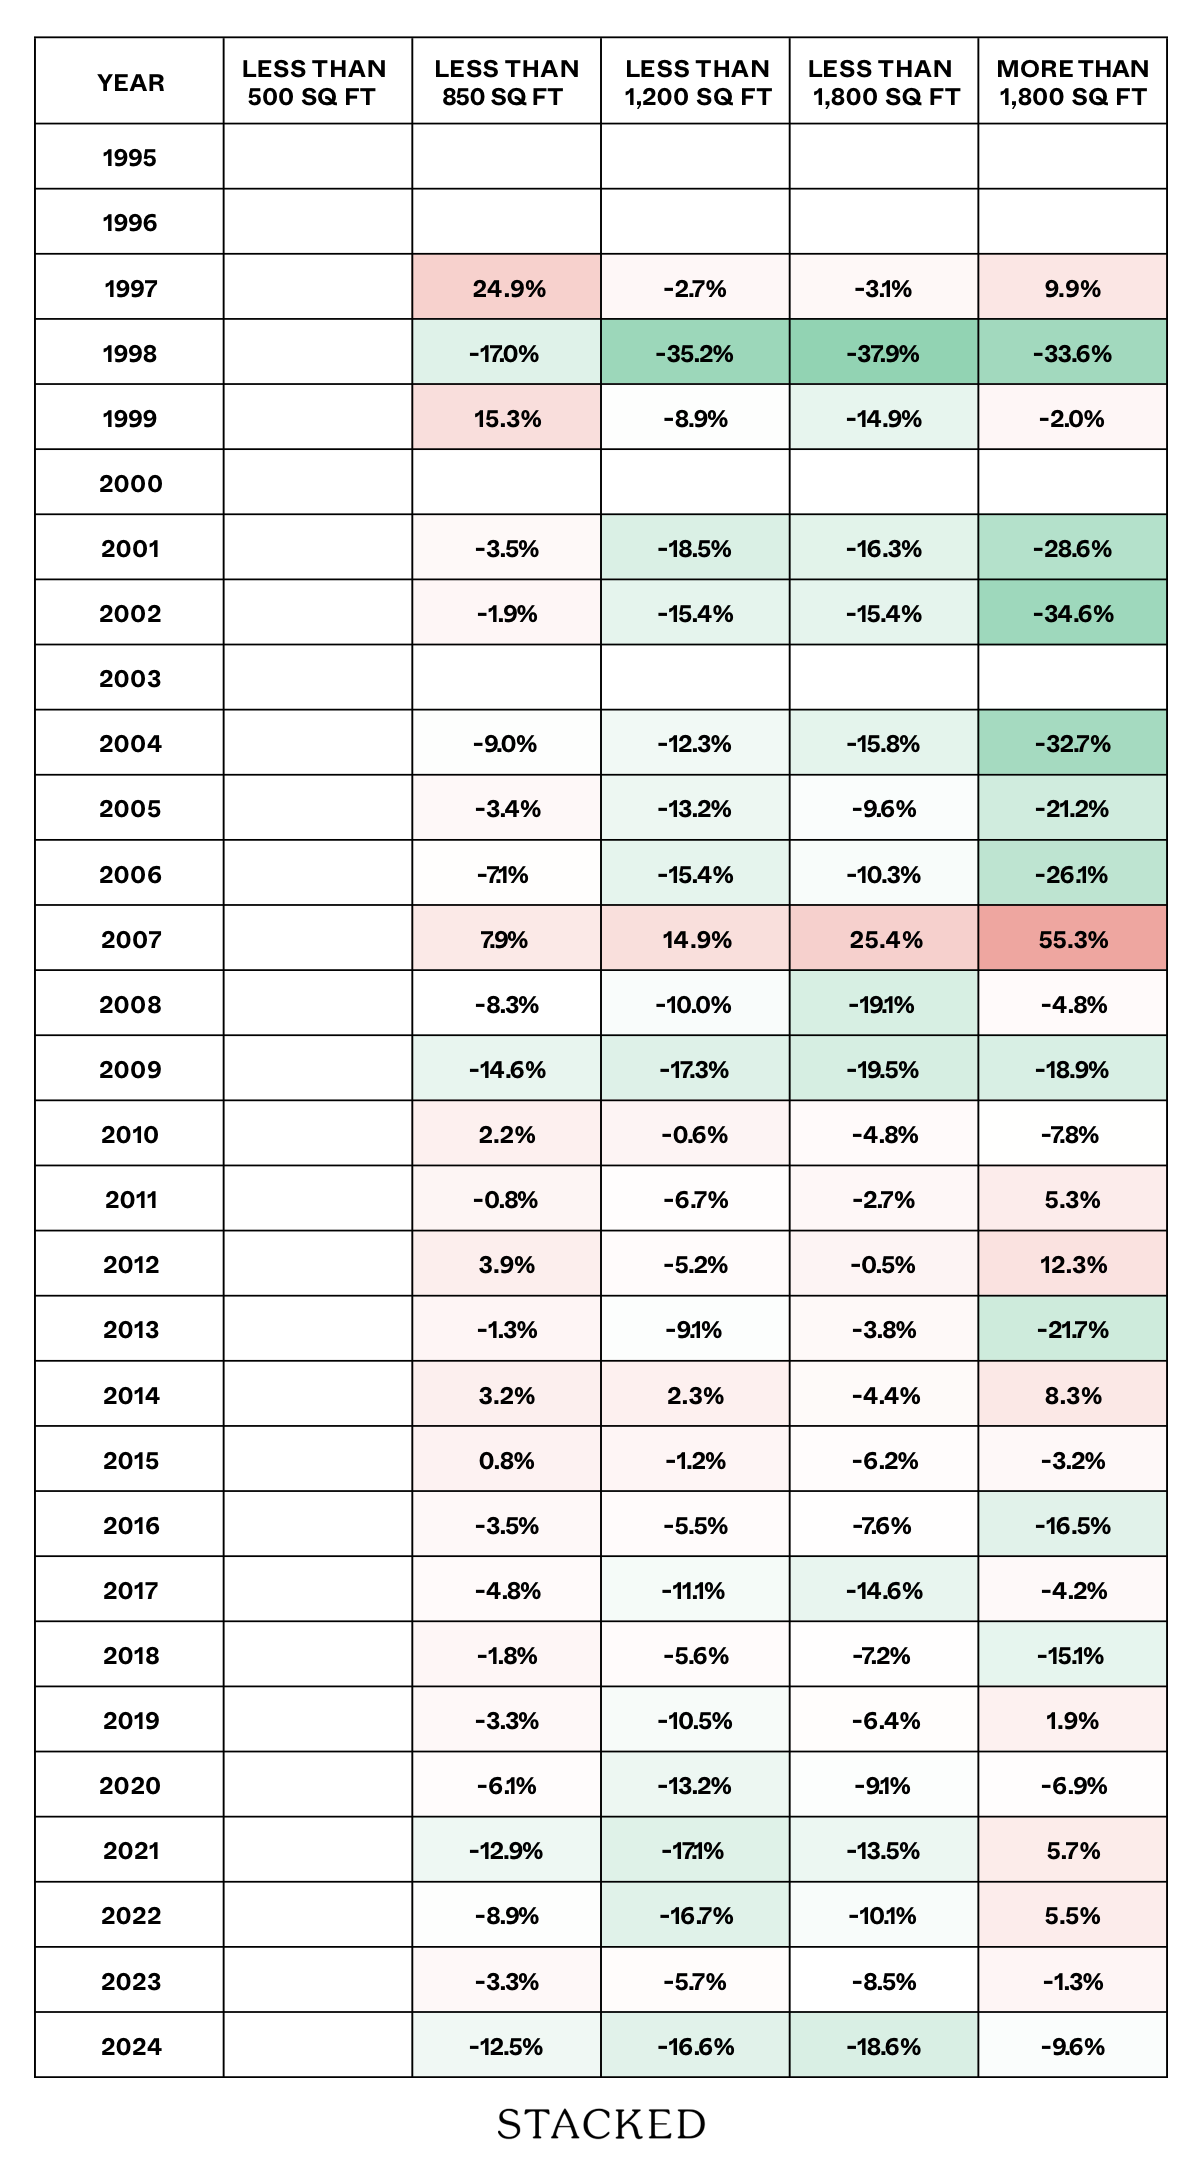
Again, the results suggest the same trend as our overview. The largest 1,800+ sq. ft. units have a premium (or at least show the lowest discount) versus the shoeboxes. It’s also worth noting the recency of the trend, and that this totally wasn’t the case between 1988 to 2006.
Finally, let’s look at the most important region to the average homeowner, the OCR:
| Year | 1) Less Than 500 Sq Ft | 2) Less Than 850 Sq Ft | 3) Less Than 1,200 Sq Ft | 4) Less Than 1,800 Sq Ft | 5) More Than 1,800 Sq Ft |
| 1995 | $630 | $621 | $608 | $596 | |
| 1996 | $687 | $708 | $673 | $575 | |
| 1997 | $688 | $634 | $678 | $589 | |
| 1998 | $522 | $463 | $450 | $377 | |
| 1999 | $577 | $557 | $540 | $413 | |
| 2000 | $660 | $628 | $633 | $547 | |
| 2001 | $929 | $584 | $542 | $539 | $433 |
| 2002 | $867 | $667 | $498 | $515 | $435 |
| 2003 | $614 | $491 | $513 | $417 | |
| 2004 | $633 | $521 | $518 | $392 | |
| 2005 | $584 | $548 | $518 | $418 | |
| 2006 | $615 | $568 | $540 | $484 | |
| 2007 | $747 | $781 | $690 | $686 | $609 |
| 2008 | $884 | $894 | $797 | $769 | $742 |
| 2009 | $1,041 | $937 | $741 | $697 | $695 |
| 2010 | $1,268 | $1,063 | $977 | $859 | $752 |
| 2011 | $1,326 | $1,106 | $974 | $944 | $826 |
| 2012 | $1,211 | $1,154 | $999 | $974 | $840 |
| 2013 | $1,367 | $1,293 | $1,090 | $1,054 | $886 |
| 2014 | $1,313 | $1,240 | $1,148 | $1,145 | $903 |
| 2015 | $1,218 | $1,222 | $1,145 | $1,069 | $994 |
| 2016 | $1,279 | $1,297 | $1,216 | $1,128 | $1,053 |
| 2017 | $1,433 | $1,402 | $1,228 | $1,246 | $1,044 |
| 2018 | $1,438 | $1,437 | $1,348 | $1,357 | $1,244 |
| 2019 | $1,510 | $1,482 | $1,403 | $1,405 | $1,645 |
| 2020 | $1,621 | $1,558 | $1,492 | $1,471 | $1,625 |
| 2021 | $1,739 | $1,643 | $1,589 | $1,529 | $1,473 |
| 2022 | $2,249 | $2,064 | $1,894 | $1,747 | $1,655 |
| 2023 | $2,227 | $2,187 | $2,108 | $2,049 | $1,846 |
| 2024 | $2,025 | $2,196 | $2,113 | $2,099 | $1,954 |
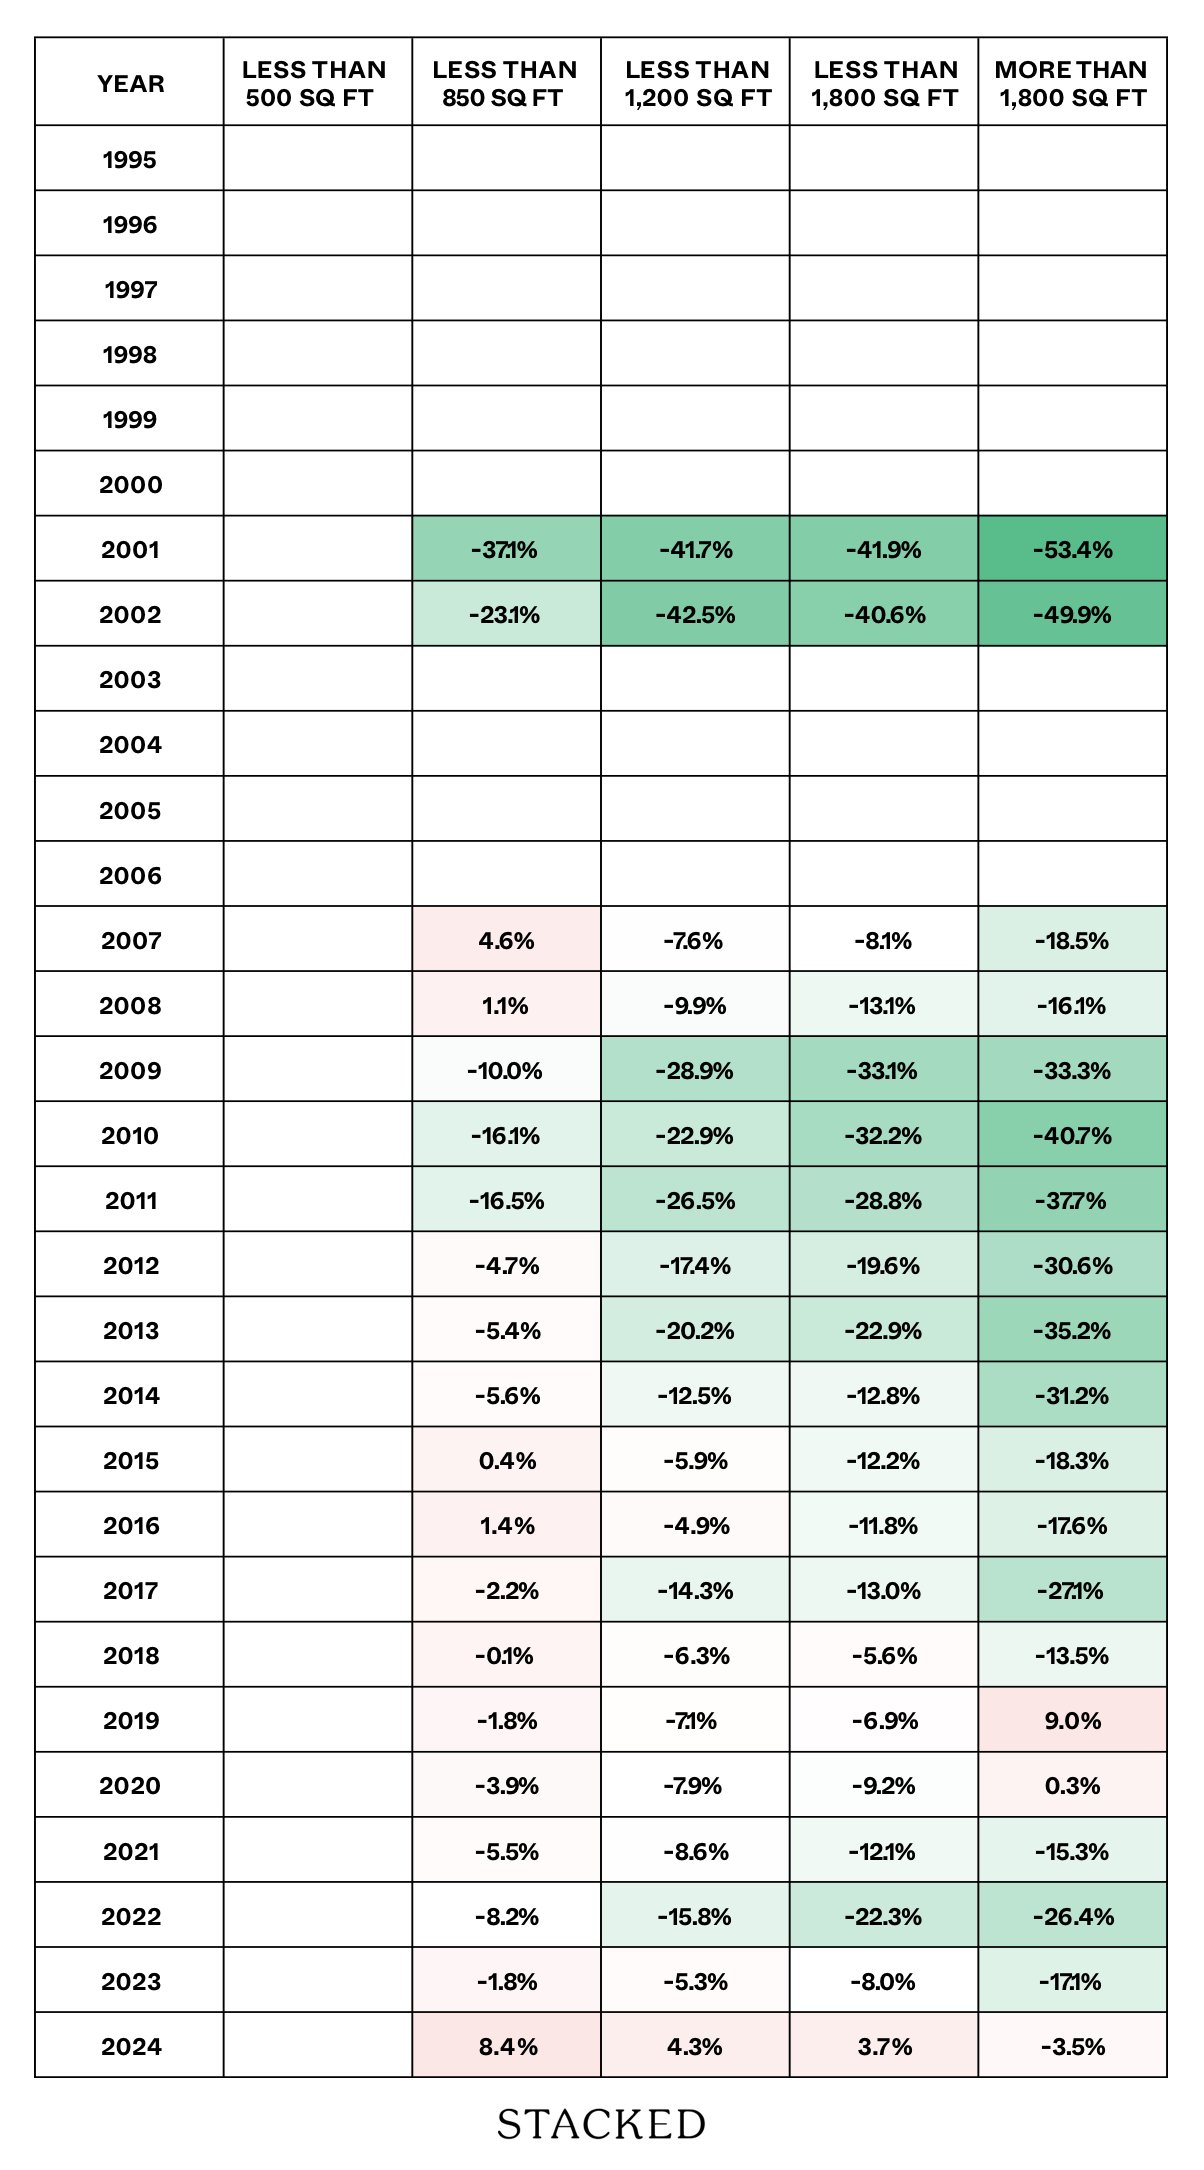
Here we finally see a difference from the general view. The OCR seems slower to pick up on the trend, and units here have maintained the “Bigger unit = lower price psf” expectation.
To veteran market watchers though, this may not come as a surprise. The OCR is where most mass-market condos are located, and perhaps the buying trend here is related to an affordability issue.
This suggests the phenomenon of bigger units costing more psf may be a regional one
While there’s no objectively accurate way to determine why, we can go by what we’ve seen on the ground. Some possible reasons are:
- The CCR and RCR have a greater proportion of high-end or luxury buyers, and developers cater to this. The biggest units in these regions aren’t just attractive because they’re big, they’re marketed with other features too (e.g., high ceilings for a loft feel, private lifts and rooftop terraces, etc.) Buyers in more prime areas may simply be willing to pay more, whereas OCR buyers exhibit a more practical approach.
- It may simply be a matter of prestige. Having a small one-bedder along Orchard Road may give the impression you can barely afford to live there, whereas having a huge five-bedder on Orchard shows real purchasing power. Some people do flaunt it.
- One could argue that even condos in the OCR are barely affordable to HDB upgraders these days. And given that most upgraders are families who need bigger units (most want at least a three-bedder), there are natural constraints on the prices of bigger units in fringe regions.
That being said, notice that new launches in the OCR, as of this year, have shown signs of a potential change. The discount for 1,800+ sq. ft. units has dipped from 17.1 per cent last year, to just 3.5 per cent of late; so whilst it’s nowhere near its RCR and CCR counterpart, larger units here do seem to be getting pricier as well. We’ve also seen how that trend has bucked even in new launches like Sora, where the 3-bedders were priced at a higher psf than the 1-bedroom units.
At Stacked, we like to look beyond the headlines and surface-level numbers, and focus on how things play out in the real world.
If you'd like to discuss how this applies to your own circumstances, you can reach out for a one-to-one consultation here.
And if you simply have a question or want to share a thought, feel free to write to us at stories@stackedhomes.com. We read every message.





0 Comments