

The EC scheme is the most successful and long-lived of the “sandwich housing” solutions; and has done much better than attempts like the DBSS. In 2024, with million-dollar flats becoming increasingly more common, buyers often question whether purchasing an EC - with its full suite of facilities - might be a better deal than paying so much for an ageing flat. This week, we took a look at the price gap between the two:
The challenge for many buyers today isn't access to information.
It's interpreting that information in a way that makes sense for their finances, goals, and stage of life.
Over time, that's also why we decided to work with agents who shared the same data-driven and advisory-led approach behind our editorial, consultants who could help readers think through decisions more objectively, rather than simply push transactions.
Today, the team has worked with more than 2,000 clients across over $5B in property transactions.
A few quick notes on ECs
Executive Condominiums (ECs) are built and sold by private developers but have eligibility conditions and ownership restrictions in the first 5 years. They have the full range of facilities common to private housing, like the gym, pool, BBQ pits, etc. After 10 years, ECs can be bought and sold like private properties (which includes being sold to foreigners and entities, or being put up for en-bloc sales).
For ECs, the five-year MOP only applies to the first batch of buyers, not subsequent ones. All ECs are all 99-year lease condos.
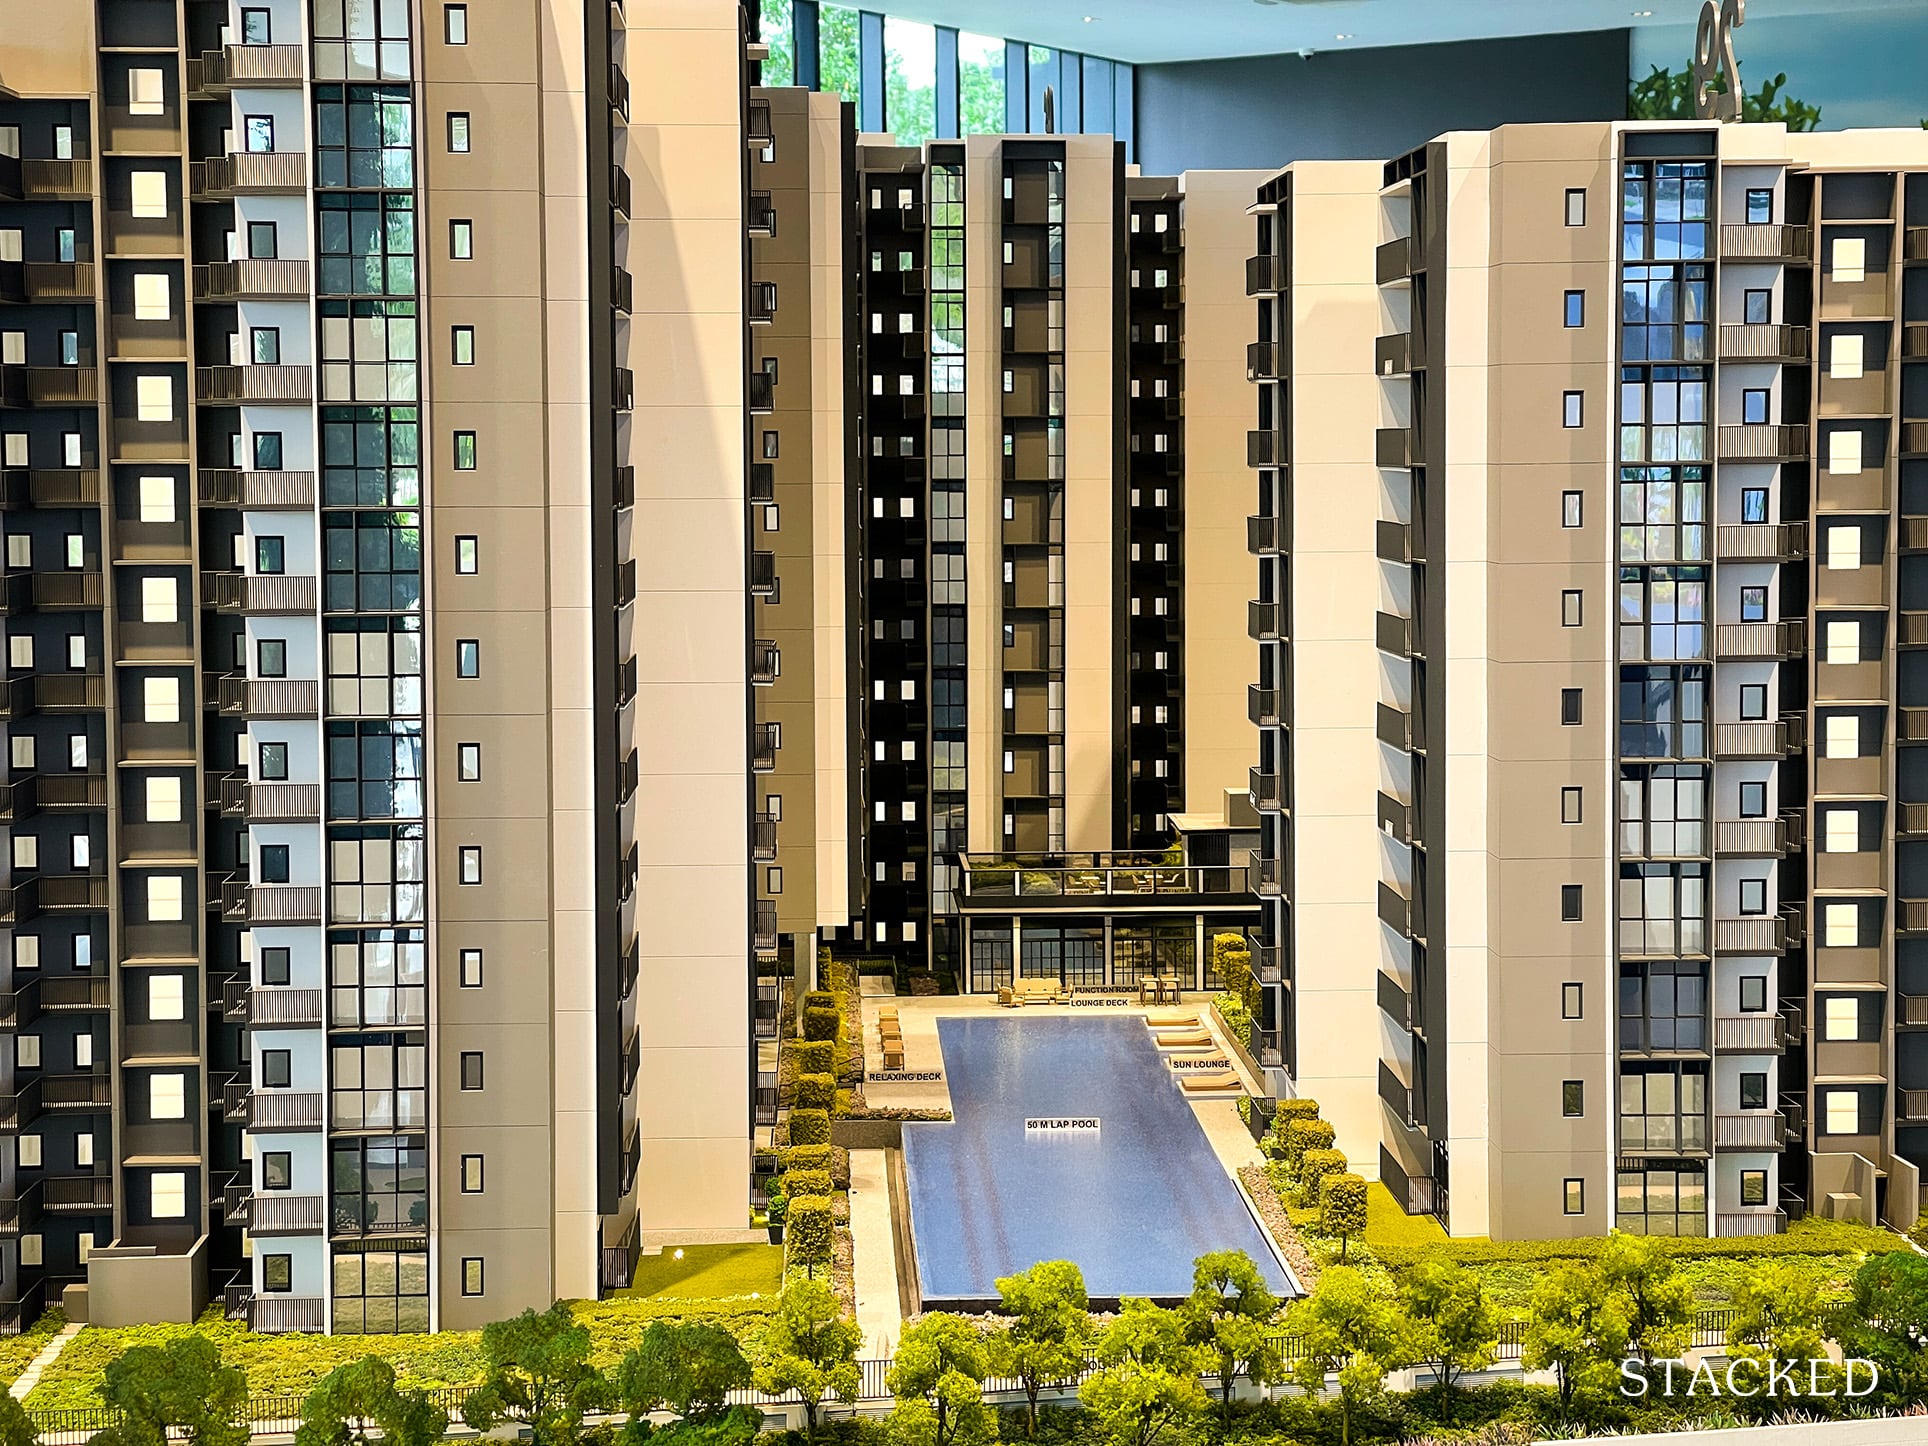
Another vital difference is that ECs cannot be bought with HDB loans, only bank loans - as such, they’re much more impacted by rising interest rates than regular HDB flats. However, they’re still subject to the Mortgage Servicing Ratio (MSR) until they’re fully privatised. This means buyers need to meet both the MSR and the Total Debt Servicing Ratio (TDSR).
ECs tend to be much more standardised in size, compared to private condos. And with some exceptions, most ECs tend to be further from MRT stations. Some of the newest neighbourhoods though, such as Canberra and Tengah, have ECs close to the train station.
At the moment, ECs are all in the Outside of Central Region (OCR), with Bishan Loft being the only EC in the Rest of Central Region (RCR). The Core Central Region (CCR) has no ECs and likely never will.
How do EC prices compare to HDB flats today?
If we go by overall quantum and region, here’s what they look like:
HDB average prices by market segment
| Year | HDB CCR | HDB RCR | HDB OCR |
| 2013 | $524,100 | $514,932 | $466,604 |
| 2014 | $500,429 | $486,702 | $431,865 |
| 2015 | $710,411 | $492,999 | $417,281 |
| 2016 | $648,947 | $512,861 | $419,544 |
| 2017 | $641,782 | $530,926 | $420,040 |
| 2018 | $656,480 | $535,986 | $417,511 |
| 2019 | $643,123 | $516,003 | $411,400 |
| 2020 | $621,680 | $522,156 | $436,466 |
| 2021 | $728,548 | $582,919 | $491,344 |
| 2022 | $705,734 | $618,407 | $532,372 |
| 2023 | $726,969 | $640,829 | $556,268 |
Executive Condominium average prices by market segment
| Year | EC RCR | EC OCR |
| 2013 | $1,464,100 | $920,513 |
| 2014 | $1,607,875 | $964,479 |
| 2015 | $1,450,714 | $913,133 |
| 2016 | $1,419,077 | $862,378 |
| 2017 | $1,384,083 | $822,696 |
| 2018 | $1,484,757 | $970,548 |
| 2019 | $1,608,286 | $1,052,040 |
| 2020 | $1,566,750 | $1,059,125 |
| 2021 | $1,671,667 | $1,180,524 |
| 2022 | $1,865,600 | $1,334,249 |
| 2023 | $2,036,321 | $1,397,035 |
(Note: There are no ECs in the CCR, and only Bishan Loft in the RCR)
Let’s look at the price premium of an EC over a flat, in various regions:
| Year | HDB CCR VS EC | HDB RCR VS EC | HDB OCR VS EC |
| 2013 | 1.76x | 1.79x | 1.97x |
| 2014 | 1.93x | 1.98x | 2.23x |
| 2015 | 1.29x | 1.85x | 2.19x |
| 2016 | 1.33x | 1.68x | 2.06x |
| 2017 | 1.28x | 1.55x | 1.96x |
| 2018 | 1.48x | 1.81x | 2.32x |
| 2019 | 1.64x | 2.04x | 2.56x |
| 2020 | 1.70x | 2.03x | 2.43x |
| 2021 | 1.62x | 2.03x | 2.40x |
| 2022 | 1.89x | 2.16x | 2.51x |
| 2023 | 1.92x | 2.18x | 2.51x |
Due to the fringe locations of most ECs, most buyers will end up comparing between flats and ECs in the OCR.
The OCR, however, is the region where the price gap is the largest. The premium has increased from 1.97 in 2013 (the last property market peak) to 2.29 in 2023. This is likely to keep increasing in the near term, as demand for ECs looks likely to remain strong.
(This is at least partly due to very high private condo prices in the aftermath of Covid, which will push some buyers toward the more affordable EC market).
Now let’s compare the RCR’s special case, Bishan Loft
These are the average prices of flats in Bishan, over the years
| Year | Average Resale Price | Average Age | Average Size (SQM) |
| 2013 | $598,137 | 25 | 106 |
| 2014 | $570,539 | 26 | 103 |
| 2015 | $577,213 | 27 | 103 |
| 2016 | $599,590 | 28 | 106 |
| 2017 | $624,864 | 29 | 106 |
| 2018 | $621,087 | 30 | 108 |
| 2019 | $614,103 | 31 | 108 |
| 2020 | $606,683 | 32 | 108 |
| 2021 | $652,966 | 32 | 109 |
| 2022 | $705,235 | 34 | 107 |
| 2023 | $756,518 | 34 | 107 |
Now, here’s the price difference versus Bishan Loft
| Year | Average Transacted Price | Average Age | Average Size (SQM) | Price Difference Vs HDB |
| 2013 | $1,464,100 | 13 | 120 | 2.4 |
| 2014 | $1,607,875 | 14 | 125 | 2.8 |
| 2015 | $1,450,714 | 15 | 116 | 2.5 |
| 2016 | $1,419,077 | 16 | 122 | 2.4 |
| 2017 | $1,384,083 | 17 | 124 | 2.2 |
| 2018 | $1,484,757 | 18 | 122 | 2.4 |
| 2019 | $1,608,286 | 19 | 130 | 2.6 |
| 2020 | $1,566,750 | 20 | 124 | 2.6 |
| 2021 | $1,671,667 | 21 | 127 | 2.6 |
| 2022 | $1,865,600 | 22 | 128 | 2.6 |
| 2023 | $2,036,321 | 23 | 129 | 2.7 |
Do note that Bishan Loft is an older EC, at 24 years old; it’s already fully privatised. However, in terms of lease, the average flat in Bishan is also quite old (see above), at around 34 years - so this evens out the comparison slightly.
In any case, Bishan Loft averages out to 2.5 times the price of the average HDB in the neighbourhood.
Overall, we can see ECs trend quite close to private condos, in terms of the price gap between themselves and HDB flats (i.e., they’re significantly more expensive, sandwich-class properties or not). They do tend to sell for slightly less than a fully private condo, but not so much that the average Singaporean would consider them cheap.
It’s still a minority that might be able to afford ECs as a first home, but as you might already know, HDB upgraders will find them an easier stretch than a fully private condo.
How do ECs stack up against the priciest central area flats?
This is more of a qualitative comparison: a lot comes down to whether a buyer values the centrality of the location, and the amenities, over condo facilities. Nonetheless, let’s try to focus on the pricing aspect:
Central Area HDB
| Year | HDB Central Area Price | HDB Central Area Avg Age | HDB Central Area Avg Size (SQM) |
| 2013 | $568,194 | 11 | 93 |
| 2014 | $557,099 | 11 | 88 |
| 2015 | $874,391 | 4 | 97 |
| 2016 | $873,349 | 6 | 96 |
| 2017 | $900,401 | 6 | 98 |
| 2018 | $894,191 | 8 | 98 |
| 2019 | $866,451 | 10 | 95 |
| 2020 | $914,642 | 11 | 98 |
| 2021 | $981,142 | 11 | 98 |
| 2022 | $1,079,216 | 12 | 98 |
| 2023 | $1,220,910 | 12 | 96 |
Average EC Prices
| Year | Average Transacted Price | Average Age | Average Size (SQM) | Gap with HDB |
| 2013 | $921,598 | 2 | 113 | 1.6x |
| 2014 | $967,995 | 4 | 114 | 1.7x |
| 2015 | $914,278 | 3 | 108 | 1.0x |
| 2016 | $864,184 | 3 | 104 | 1.0x |
| 2017 | $825,974 | 4 | 98 | 0.9x |
| 2018 | $976,800 | 7 | 105 | 1.1x |
| 2019 | $1,058,245 | 9 | 107 | 1.2x |
| 2020 | $1,061,964 | 8 | 104 | 1.2x |
| 2021 | $1,181,210 | 7 | 106 | 1.2x |
| 2022 | $1,335,014 | 8 | 105 | 1.2x |
| 2023 | $1,399,170 | 9 | 102 | 1.1x |
Now in terms of strict pricing alone, the gap between a pricey central area resale flat, and an EC, is rather narrow. For example, the prices at a recent EC, such as Altura, reached about $1.4 million for a 980 sq. ft. unit. This is comparable in price to some units at The Pinnacle @ Duxton, one of the priciest HDB projects in Outram.
Here, as we mentioned, is where the qualitative aspect comes in. If the most important thing to you is CBD access, or having lots of nearby malls, then a central area resale flat is a clear choice over an EC.
In our comparison above, Altura is in Bukit Batok West with no MRT station nearby currently, whilst Pinnacle @ Duxton is within walking distance to Outram Park MRT (three train lines and one stop from Tanjong Pagar). If the prices are almost similar, why wouldn’t you pick Pinnacle?
On the flip side, there are those who value having a pool, 24/7 security, or perhaps a longer-term view on capital appreciation. In this case, an HDB flat priced close to a condo is the one that may look absurd!
What about newer HDB flats, versus newer ECs?
For those sensitive about lease decay, the comparison will probably be between newer HDB and EC projects. Would you rather have a new launch EC, or an HDB flat that recently reached its MOP?
Let’s have a look:
Recently-MOP HDB prices
| Year | Average Resale Price | Average Age | Average Size (SQM) |
| 2013 | $579,896 | 7 | 98 |
| 2014 | $539,336 | 7 | 96 |
| 2015 | $567,161 | 6 | 94 |
| 2016 | $543,929 | 5 | 92 |
| 2017 | $534,657 | 5 | 92 |
| 2018 | $512,570 | 5 | 90 |
| 2019 | $480,113 | 5 | 89 |
| 2020 | $501,625 | 5 | 90 |
| 2021 | $563,827 | 6 | 92 |
| 2022 | $600,548 | 6 | 90 |
| 2023 | $618,385 | 6 | 88 |
New launch Executive Condominium (New Sales)
| Year | Average Transacted Price | Average Age | Average Size (SQM) | Price Gap With HDB |
| 2013 | $910,713 | 1 | 112 | 1.6 |
| 2014 | $960,271 | 1 | 112 | 1.8 |
| 2015 | $910,472 | 2 | 106 | 1.6 |
| 2016 | $860,069 | 2 | 102 | 1.6 |
| 2017 | $815,050 | 3 | 95 | 1.5 |
| 2018 | $975,616 | 3 | 99 | 1.9 |
| 2019 | $1,193,909 | 1 | 102 | 2.5 |
| 2020 | $1,142,166 | 2 | 96 | 2.3 |
| 2021 | $1,262,899 | 2 | 100 | 2.2 |
| 2022 | $1,440,365 | 1 | 101 | 2.4 |
| 2023 | $1,561,350 | 2 | 103 | 2.5 |
An interesting observation: the price gap between a young HDB flat and a new EC has been steadily growing, over the past 10 years.
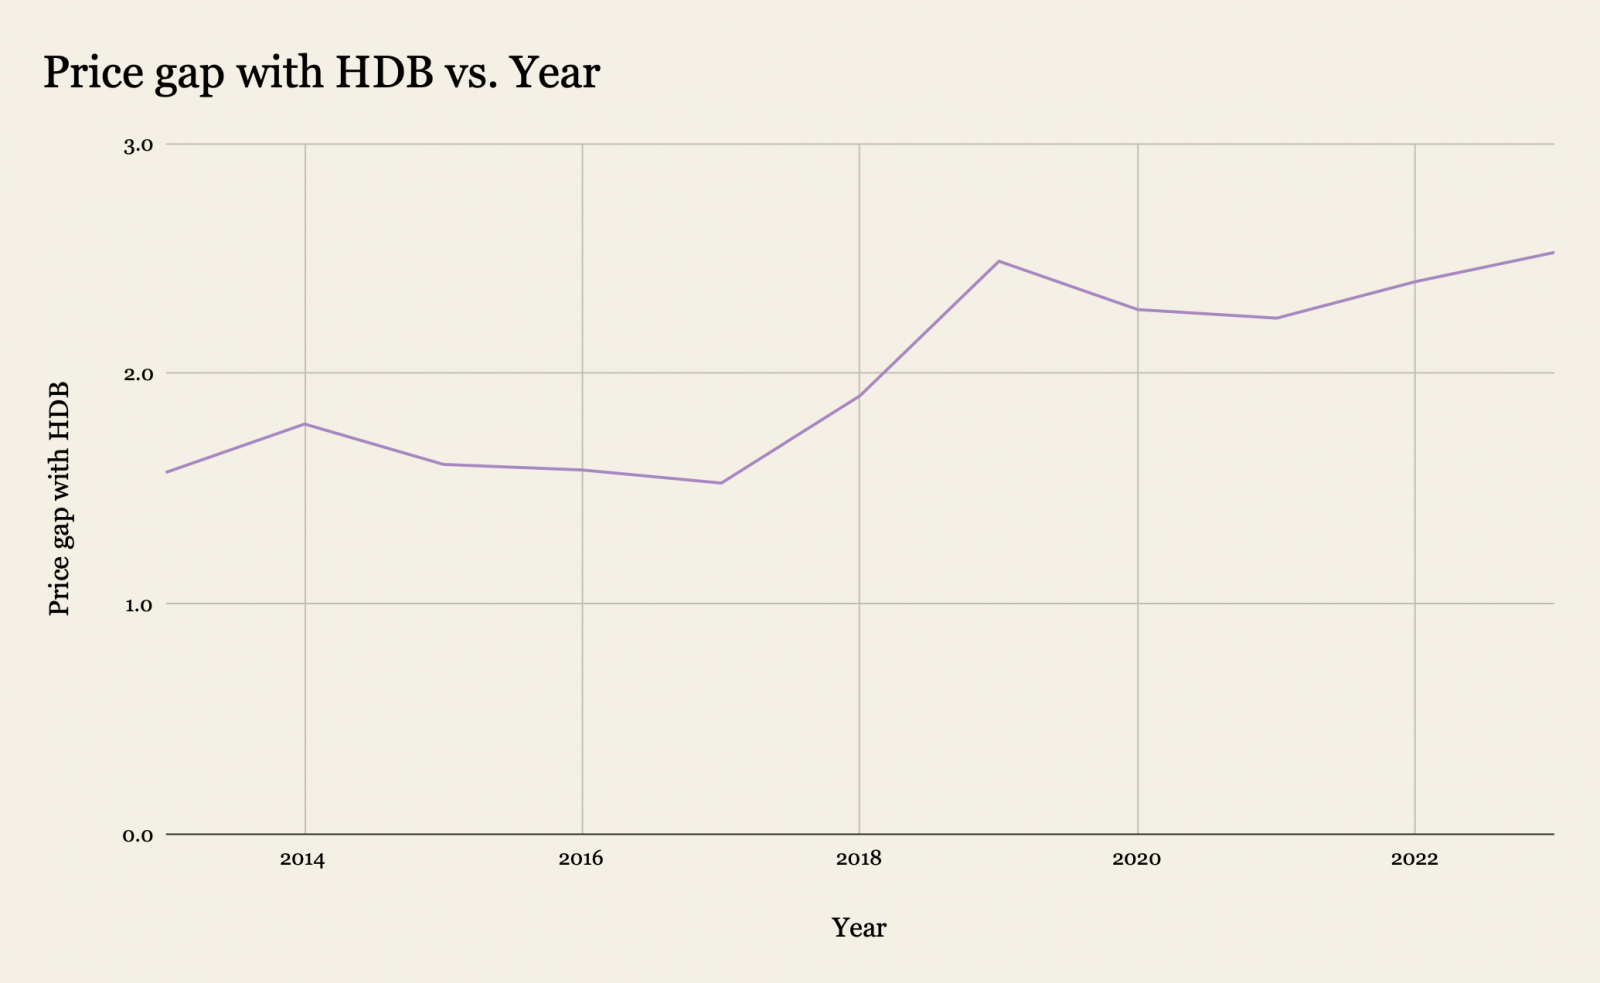
Back in 2014, the EC was 1.78 times the price of a young resale flat. But in 2023, it’s about 2.5x more expensive. As we mentioned earlier, an EC is cheaper than a fully private condo, but not so much that a first-timer - or other price-sensitive home buyer - can consider it an easy stretch. For those without a previously appreciated property to sell, an EC may be as out-of-reach as any regular private condo.
And for those who want a newer unit, but are on a budget, the young resale flat might still be a more viable option.
At Stacked, we like to look beyond the headlines and surface-level numbers, and focus on how things play out in the real world.
If you'd like to discuss how this applies to your own circumstances, you can reach out for a one-to-one consultation here.
And if you simply have a question or want to share a thought, feel free to write to us at stories@stackedhomes.com. We read every message.





0 Comments