

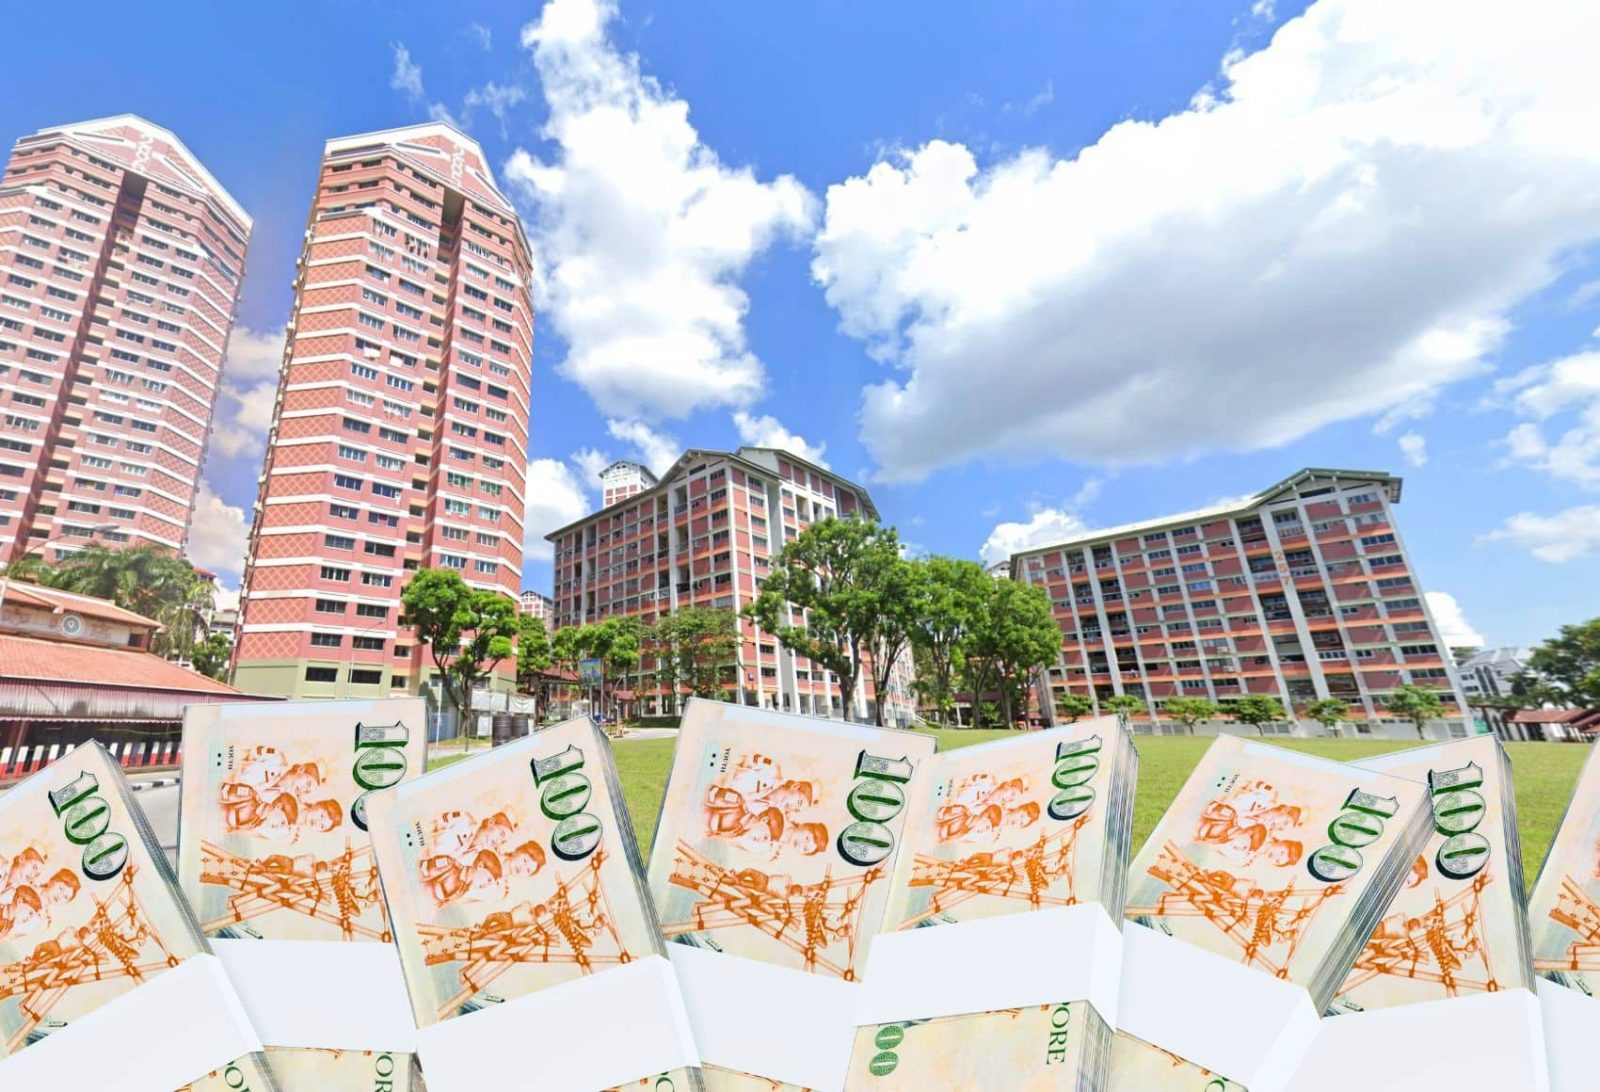
It seems concealing Cash Over Valuation (COV) isn’t helping to slow down flat prices anymore.

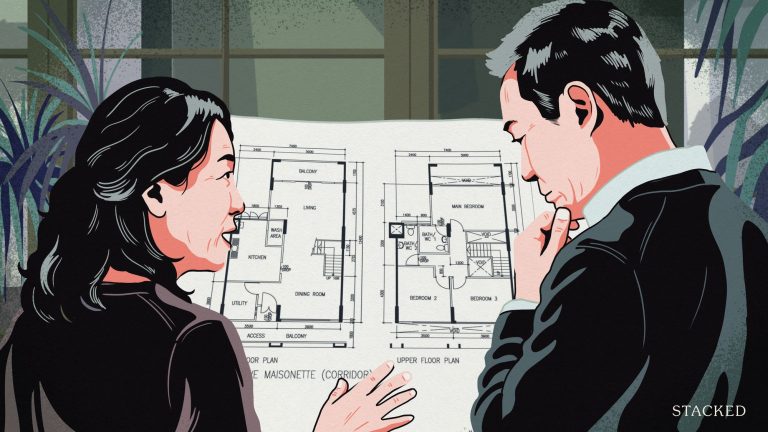
First, we had a $1.73 million flat, and now a listing in Bishan Block 261 is pushing for $1.88 million. This is for a maisonette; and the high asking price may be based on how comparatively new it is, for this particular flat type (the completion date for the flat is 1991, and HDB stopped making maisonettes in 1995 - so it’s among the newer maisonettes).
This leads me to wonder if concealing the COV is still helping at all. Back in 2014 - the last time resale flat prices were going out of control - HDB ceased to publicly disclose COV data. From that point on, buyers and sellers would have to agree on the price first, and only after that would they get the valuation. So if you offered a price that’s too high, that’s too bad - COV isn’t covered by the loan, so a lot more would be coming out of your pocket.

Zero COV quickly became the norm after that move, and resale flat prices saw consecutive years of decline until around the Covid housing crunch.
So why is it no longer helping to rein in resale flat prices? One reason is simply the substantial sale proceeds of right-sizers: anyone who sold their private property at the heights of the last few years can easily afford to overpay for a flat they really like (and they may not mind doing so, if they intend to live there the rest of their lives).
Also, it doesn’t help that private property prices are just out of reach for some people. Even in 2022, when we wrote about the $1.4m HDB at Henderson which last broke the record, you just couldn’t get any reasonably priced alternatives if you wanted to stay in the same area. For the same reason this $1.4m price now seems rather “low” in comparison to the new $1.73m record, a million-dollar HDB may seem justifiable to someone with a $2m budget that is priced out of private property in the same area.
But the other reason is simply that, when determining a price, we look at past transactions. We don’t see how much of the transaction is COV, we just see the total amount (e.g., we won’t know that an $800,000 flat had a COV of $100,000, we just see the $800,000). So concealing the data is immaterial: prices keep climbing on the back of transaction records.
So while removing COV did work at the time, and was quite the stroke of genius, it was a move that was effective just that one time (and I should add, HDB also introduced the Mortgage Servicing Ratio at around that time, which also helped).
For reasons of public perception, HDB has a drastic need to prevent any resale flats from reaching the $2 million mark anytime soon.

This is due to an incident that has made the number important: HDB had a $2 million listing taken down from its portal, flagging it as unrealistic. And to be clear, HDB was right about the listing being misleading: it was actually two flats, not one (see the link).
However, we know how these types of information get messy in public. And the general perception now is: HDB says $2 million is unrealistic for a flat. So if by chance this $1.88 million unit sells…and a subsequent one really does reach $2 million, it’s going to make for some terrible optics. This would definitely fuel the flames among disgruntled home buyers, who are convinced that housing is unaffordable.
HDB pulled the proverbial rabbit out of the hat once already, when they decided to remove COV data. It would probably be to no one’s surprise that they’re working on a second rabbit right now, let’s see how things play out for the rest of 2024.
Meanwhile in other property news:
- What can you do with a 742 sq. ft. home? Quite a bit, if you put the garden indoors.
- How bad has the price gap between new and resale condos gotten? Here’s a look at the data in 2024.
- Jurong is definitely a neighbourhood in need of review, given the big changes there. Here’s an up-to-date look at the property market in the “king of the west.”
- Selling your flat in 2024? Listings are wild, we know - but here’s how you can pick out a fair price for your unit.
Weekly Sales Roundup (05 July - 11 August)
The challenge for many buyers today isn't access to information.
It's interpreting that information in a way that makes sense for their finances, goals, and stage of life.
Over time, that's also why we decided to work with agents who shared the same data-driven and advisory-led approach behind our editorial, consultants who could help readers think through decisions more objectively, rather than simply push transactions.
Today, the team has worked with more than 2,000 clients across over $5B in property transactions.
Top 5 Most Expensive New Sales (By Project)
| PROJECT NAME | PRICE S$ | AREA (SQFT) | $PSF | TENURE |
| TEMBUSU GRAND | $3,561,000 | 1432 | $2,487 | 99 yrs (2022) |
| THE RESERVE RESIDENCES | $3,435,270 | 1378 | $2,493 | 99 yrs (2021) |
| LENTOR MANSION | $3,406,000 | 1485 | $2,293 | 99 yrs (2023) |
| THE MYST | $3,017,000 | 1518 | $1,988 | 99 yrs (2023) |
| THE IVERIA | $2,570,000 | 947 | $2,713 | FH |
Top 5 Cheapest New Sales (By Project)
| PROJECT NAME | PRICE S$ | AREA (SQFT) | $PSF | TENURE |
| KASSIA | $985,000 | 474 | $2,080 | FH |
| SORA | $1,572,000 | 732 | $2,148 | 99 yrs (2023) |
| LENTORIA | $1,590,000 | 732 | $2,172 | 99 yrs (2022) |
| HILLHAVEN | $1,721,462 | 797 | $2,161 | 99 yrs (2023) |
| HILLOCK GREEN | $1,812,000 | 753 | $2,405 | 99 yrs (2022) |
Top 5 Most Expensive Resale
| PROJECT NAME | PRICE S$ | AREA (SQFT) | $PSF | TENURE |
| WING ON LIFE GARDEN | $7,450,888 | 3305 | $2,255 | FH |
| THE RESIDENCES AT W SINGAPORE SENTOSA COVE | $4,204,400 | 2131 | $1,973 | 99 yrs (2006) |
| BELLE VUE RESIDENCES | $4,200,000 | 1981 | $2,121 | FH |
| SOPHIA RESIDENCE | $4,100,000 | 2045 | $2,005 | FH |
| ST MARTIN RESIDENCE | $3,428,000 | 1442 | $2,377 | FH |
Top 5 Cheapest Resale
| PROJECT NAME | PRICE S$ | AREA (SQFT) | $PSF | TENURE |
| CENTRA LOFT | $660,000 | 420 | $1,572 | FH |
| THE NAUTICAL | $720,888 | 570 | $1,264 | 99 yrs (2011) |
| SEASTRAND | $735,000 | 592 | $1,242 | 99 yrs (2011) |
| PARC IMPERIAL | $762,288 | 398 | $1,914 | FH |
| THE TAPESTRY | $780,000 | 474 | $1,647 | 99 yrs (2017) |
Top 5 Biggest Winners
| PROJECT NAME | PRICE S$ | AREA (SQFT) | $PSF | RETURNS | HOLDING PERIOD |
| WING ON LIFE GARDEN | $7,450,888 | 3305 | $2,255 | $4,422,888 | 27 Years |
| BOTANNIA | $2,680,000 | 1561 | $1,717 | $1,590,380 | 17 Years |
| ASPEN HEIGHTS | $3,420,000 | 1582 | $2,161 | $1,570,000 | 29 Years |
| ST MARTIN RESIDENCE | $3,428,000 | 1442 | $2,377 | $1,473,900 | 25 Years |
| THOMSON 800 | $2,938,000 | 1625 | $1,808 | $1,438,000 | 16 Years |
Top 5 Biggest Losers
| PROJECT NAME | PRICE S$ | AREA (SQFT) | $PSF | RETURNS | HOLDING PERIOD |
| THE BOUTIQ | $1,900,000 | 883 | $2,153 | -$188,087 | 10 Years |
| 28 RC SUITES | $1,110,000 | 775 | $1,432 | -$74,200 | 9 Years |
| KALLANG RIVERSIDE | $2,950,000 | 1141 | $2,585 | -$50,000 | 1 Years |
| MARINA BAY RESIDENCES | $2,195,000 | 1066 | $2,060 | -$43,600 | 12 Years |
| THE CREST | $2,300,000 | 1292 | $1,781 | -$39,000 | 6 Year |
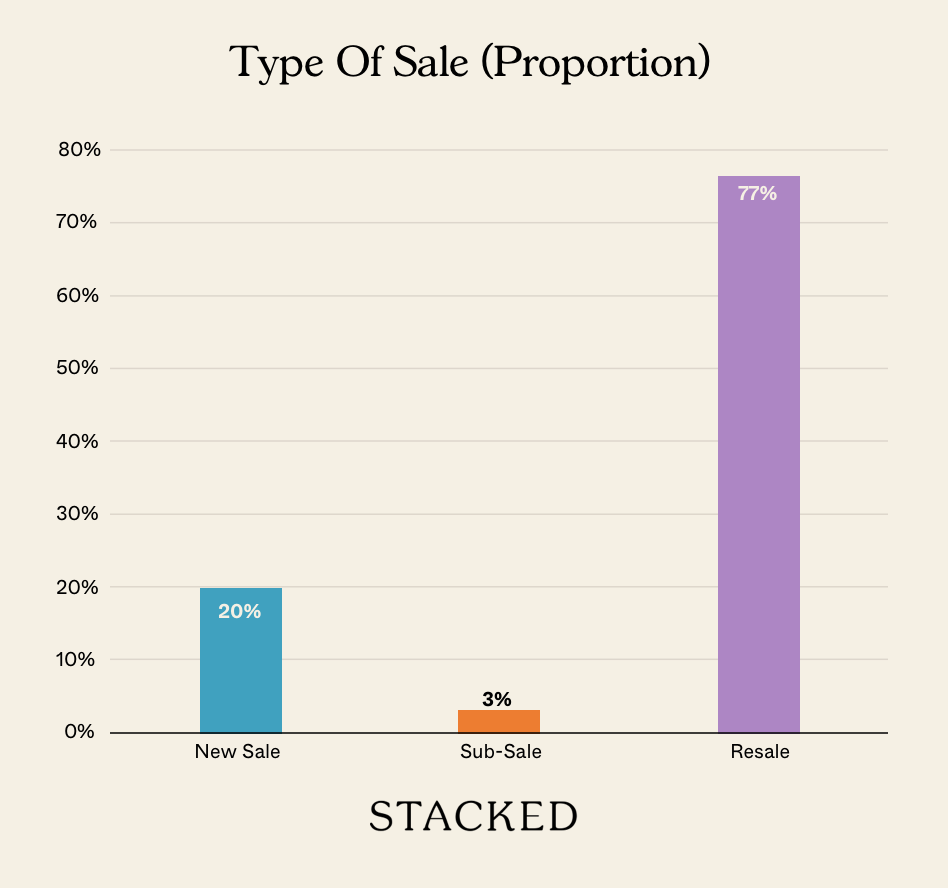
Transaction Breakdown
For more on the Singapore property market, follow us on Stacked.
At Stacked, we like to look beyond the headlines and surface-level numbers, and focus on how things play out in the real world.
If you'd like to discuss how this applies to your own circumstances, you can reach out for a one-to-one consultation here.
And if you simply have a question or want to share a thought, feel free to write to us at stories@stackedhomes.com. We read every message.


0 Comments