

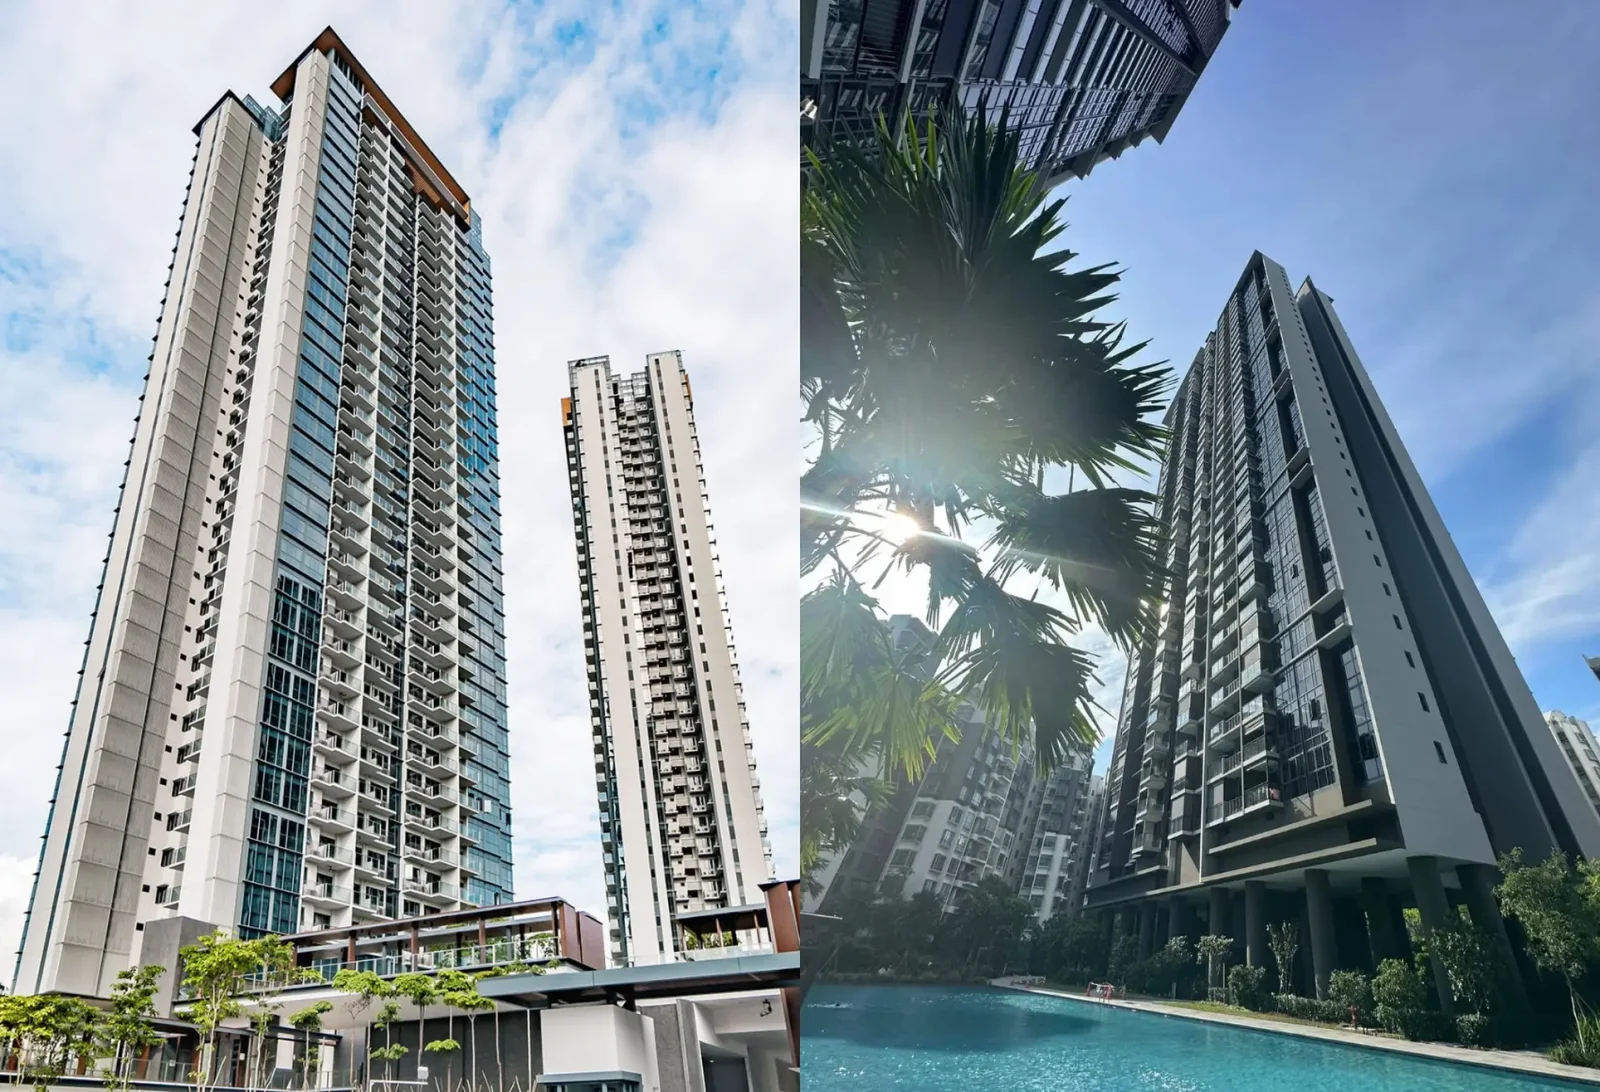
Twin VEW and Whistler Grand are just across the road from each other; so even back when they were launched in 2018, comparisons between the two were common. Now that it’s 2024, it’s time we took a look at how the two have performed, and see if previous assumptions have held. Here’s how it’s looking for both West Vale condos right now:
The challenge for many buyers today isn't access to information.
It's interpreting that information in a way that makes sense for their finances, goals, and stage of life.
Over time, that's also why we decided to work with agents who shared the same data-driven and advisory-led approach behind our editorial, consultants who could help readers think through decisions more objectively, rather than simply push transactions.
Today, the team has worked with more than 2,000 clients across over $5B in property transactions.
A rundown on Twin Vew and Whistler Grand
Both Twin VEW and Whistler Grand were launched in 2018, and are roughly the same age (Twin Vew was finished in 2021, while Whistler Grand was completed in 2022). Twin VEW’s first sale was on 4th May 2018, whilst Whistler Grand’s first sale was on 2nd November 2018; a mostly negligible age difference. Both are 99-year leasehold condos.
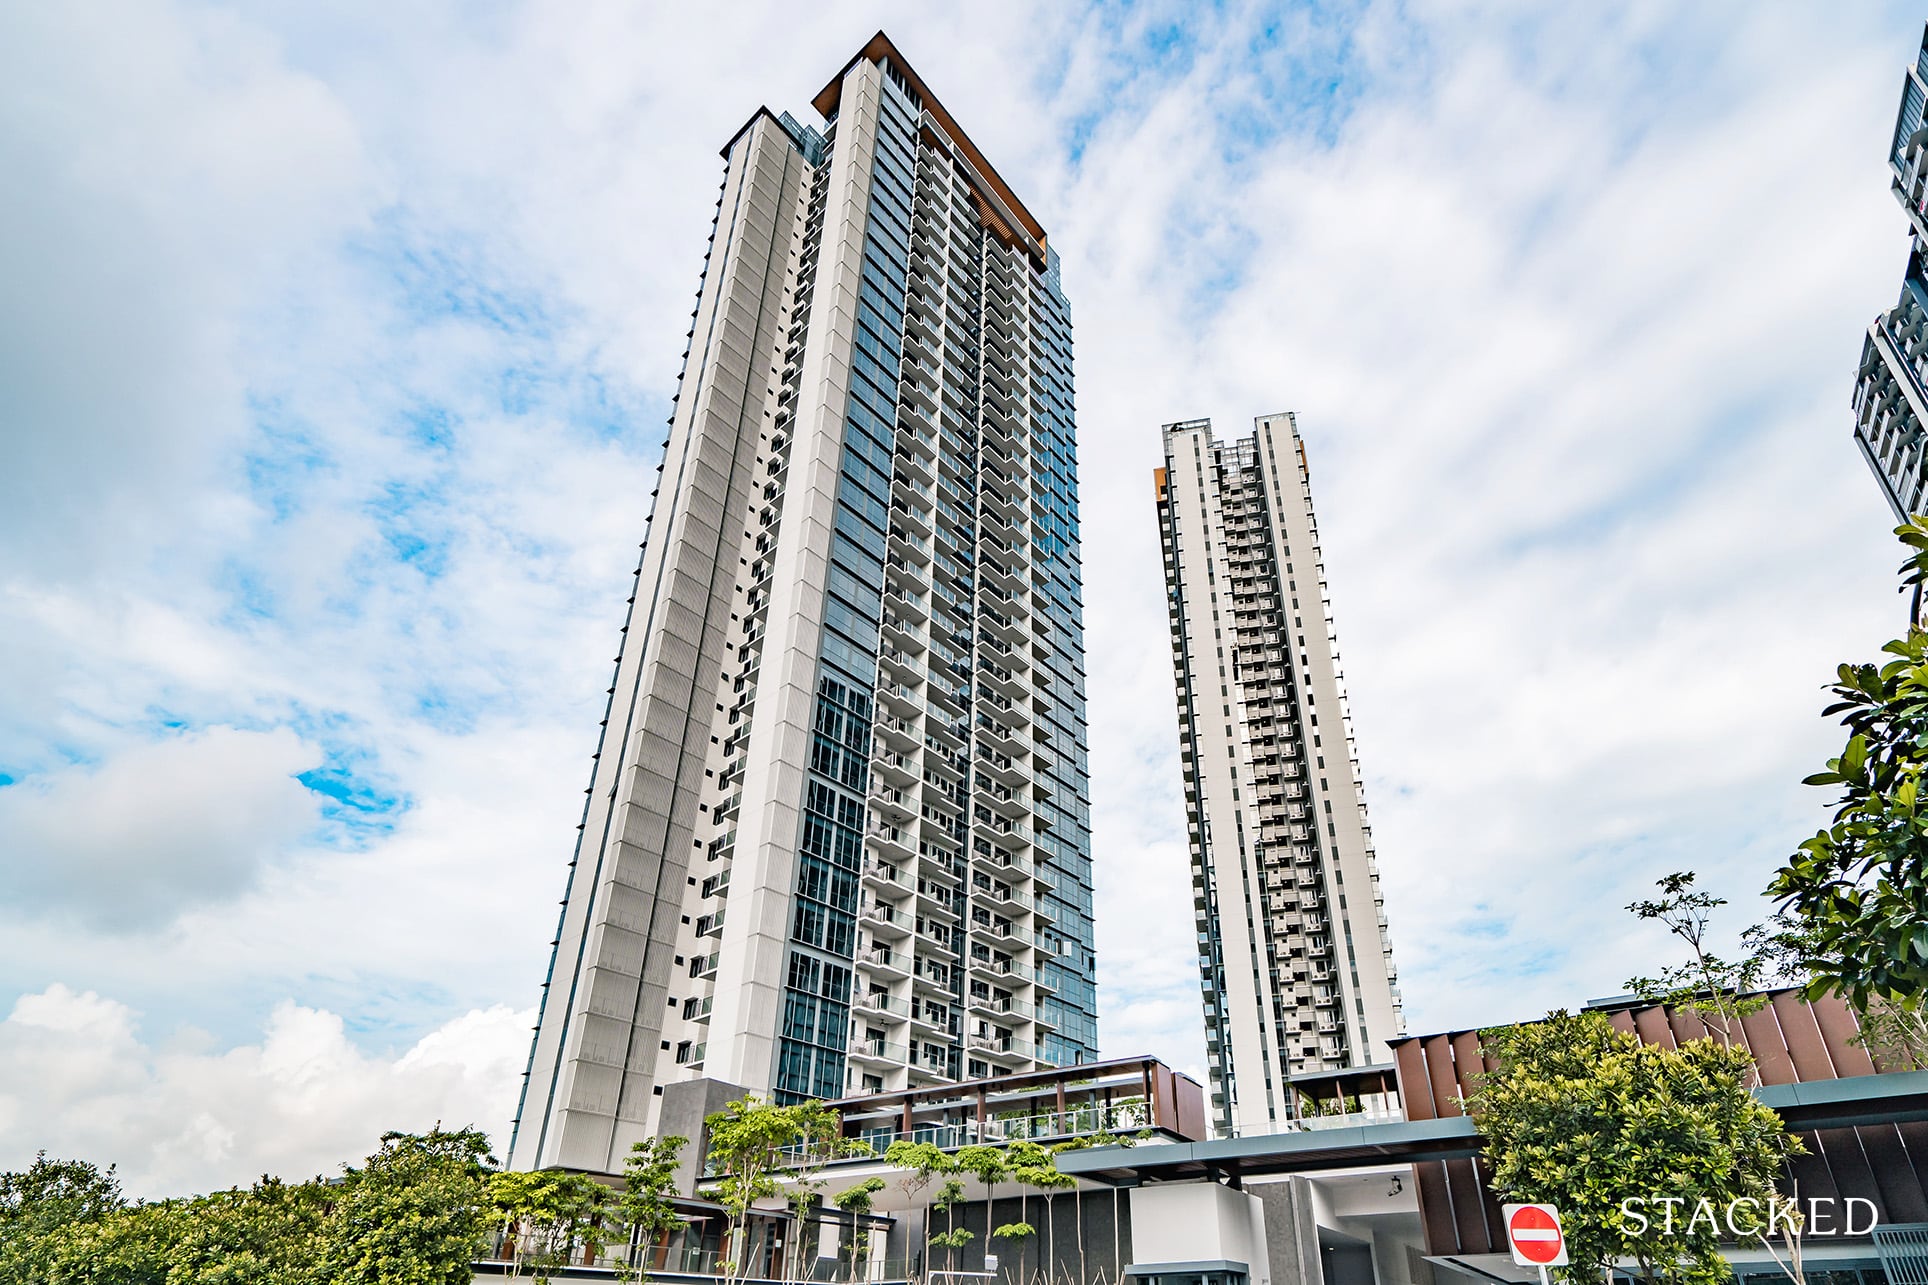
Twin VEW is the smaller of the two, at 520 units, while Whistler Grand is larger at 716 units. As they’re so close, there’s little differentiation in terms of location; Twin VEW is a bit closer to the Pandan River (and was marketed more heavily on the waterfront view), while Whistler Grand does benefit from a more established developer in Singapore, at least. That said, for their first maiden project Twin VEW certainly received a very favourable response.
A look at Twin Vew’s price movements
| New Sale | Sub Sale | Resale | ||||||||
| Bedroom | 2018 | 2019 | 2020 | 2021 | 2021 | 2022 | 2022 | 2023 | 2024 | 2018 - 2023 profit |
| 1BR | $1,514 | $1,692 | $1,667 | $1,748 | 15.44% | |||||
| 2BR | $1,426 | $1,509 | $1,554 | $1,569 | $1,642 | $1,759 | $1,694 | 23.34% | ||
| 3BR | $1,345 | $1,440 | $1,491 | $1,528 | $1,554 | $1,564 | $1,662 | $1,757 | $1,706 | 30.61% |
| 4BR | $1,332 | $1,482 | $1,479 | $1,480 | $1,593 | $1,558 | $1,616 | $1,774 | $1,799 | 33.16% |
| Average | $1,400 | $1,476 | $1,485 | $1,490 | $1,573 | $1,566 | $1,646 | $1,758 | $1,733 | |
Twin VEW’s land price was $292 million, or about $591.50 psf. The estimated breakeven price for the developer was around $1,065 psf (based on Squarefoot Research). The initial developer prices ranged between $1,332.50 psf to $1,513.80 psf, with an average of $1,400 psf.
2018 was a down period for the wider market, but prices did pick up quite well through to the first sub sale units. Between 2018 to 2023:
- One-bedders rose 15 per cent in price psf, while
- Two-bedders rose 23 per cent
- Three-bedders rose 31 per cent, and
- Four-bedders rose 33 per cent
If we were to look only at profit margins, we’d see an average gain of around 18.91 per cent:
| Bedrooms | Average of Profit (%) | Average of Holding Period (Years) | Volume |
| 1BR | 16.5% | 4.4 | 10 |
| 2BR | 17.0% | 4.2 | 26 |
| 3BR | 19.6% | 3.8 | 28 |
| 4BR | 22.1% | 3.7 | 17 |
| Grand Total | 18.91% | 4.0 | 81 |
Four-bedders were the main winners here, perhaps partly due to HDB upgraders being such a strong buyer demographic since 2018, and the preference for bigger units since the pandemic.
In any case, a return of close to 19 per cent is solid for a holding period of just four years, especially in light of cooling measures maintaining downward pressure on the market.
Performances of different stacks at Twin VEW
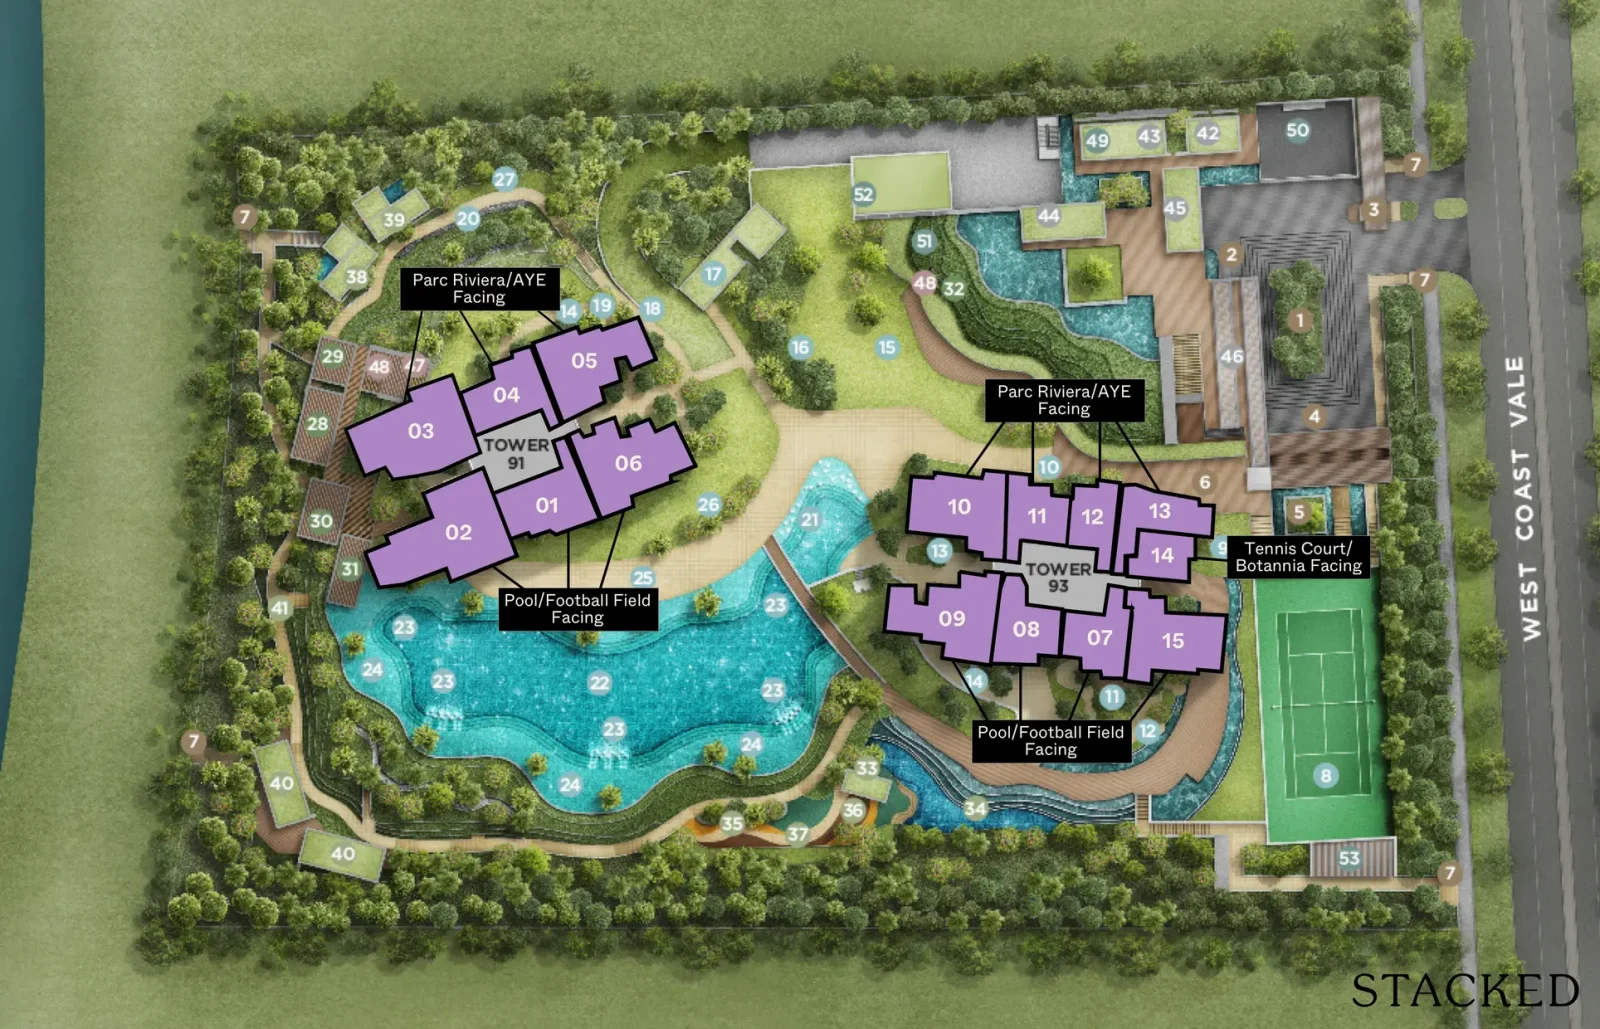
| Stack | Facing | Bedroom | Volume | Average of Profit (%) |
| 1 | Pool/Football Field | 3 | 4 | 14.09% |
| 2 | Pool/Football Field | 4 | 8 | 25.24% |
| 3 | Parc Riviera/AYE | 4 | 1 | 3.71% |
| 4 | Parc Riviera/AYE | 2 | 4 | 19.68% |
| 5 | Parc Riviera/AYE | 3 | 6 | 21.62% |
| 6 | Pool/Football Field | 4 | 7 | 22.37% |
| 7 | Pool/Football Field | 2 | 8 | 13.26% |
| 8 | Pool/Football Field | 2 | 4 | 20.87% |
| 9 | Pool/Football Field | 3 | 4 | 16.78% |
| 10 | Parc Riviera/AYE | 3 | 11 | 20.51% |
| 11 | Parc Riviera/AYE | 2 | 5 | 17.36% |
| 12 | Parc Riviera/AYE | 1 | 4 | 19.72% |
| 13 | Parc Riviera/AYE | 2 | 5 | 17.24% |
| 14 | Tennis Court/Botannia | 1 | 6 | 14.36% |
| 15 | Pool/Football Field | 3 | 4 | 21.10% |
| Grand Total | 81 | 18.91% | 81 | 18.91% |
Note that Stack 14 has no good point of comparison, as it’s the only stack in Twin Vew with the tennis court/Botannia facing.
Overall, there’s no particular facing that stands out for having the best gains:
| Facing | Average of Profit (%) |
| Parc Riviera/AYE | 19.16% |
| Pool/Football Field | 19.38% |
| Tennis Court/Botannia | 14.36% |
| Grand Total | 18.91% |
The “best facing” stacks have a profit margin that is comparable to the wider average for Twin VEW (which may also mean the closer proximity to the Pandan River hasn’t made a huge difference).
Which floors in Twin VEW were the most profitable?
| Floor | Volume | Average of Profit (%) |
| 2 | 1 | 11.1% |
| 3 | 2 | 27.5% |
| 4 | 6 | 16.9% |
| 5 | 2 | 17.4% |
| 6 | 4 | 18.8% |
| 7 | 4 | 20.4% |
| 8 | 2 | 21.2% |
| 9 | 1 | 16.1% |
| 10 | 2 | 28.7% |
| 11 | 4 | 20.6% |
| 12 | 2 | 19.4% |
| 13 | 6 | 22.8% |
| 14 | 3 | 20.7% |
| 15 | 1 | 21.4% |
| 16 | 3 | 16.0% |
| 17 | 4 | 18.2% |
| 18 | 2 | 16.5% |
| 19 | 3 | 14.8% |
| 20 | 2 | 20.8% |
| 21 | 3 | 21.7% |
| 22 | 2 | 18.1% |
| 23 | 1 | 23.0% |
| 24 | 5 | 15.7% |
| 25 | 2 | 14.8% |
| 28 | 2 | 18.3% |
| 29 | 1 | 18.0% |
| 30 | 3 | 18.5% |
| 31 | 2 | 13.9% |
| 33 | 1 | 7.9% |
| 35 | 3 | 17.4% |
| 36 | 2 | 22.8% |
| Grand Total | 81 | 18.9% |
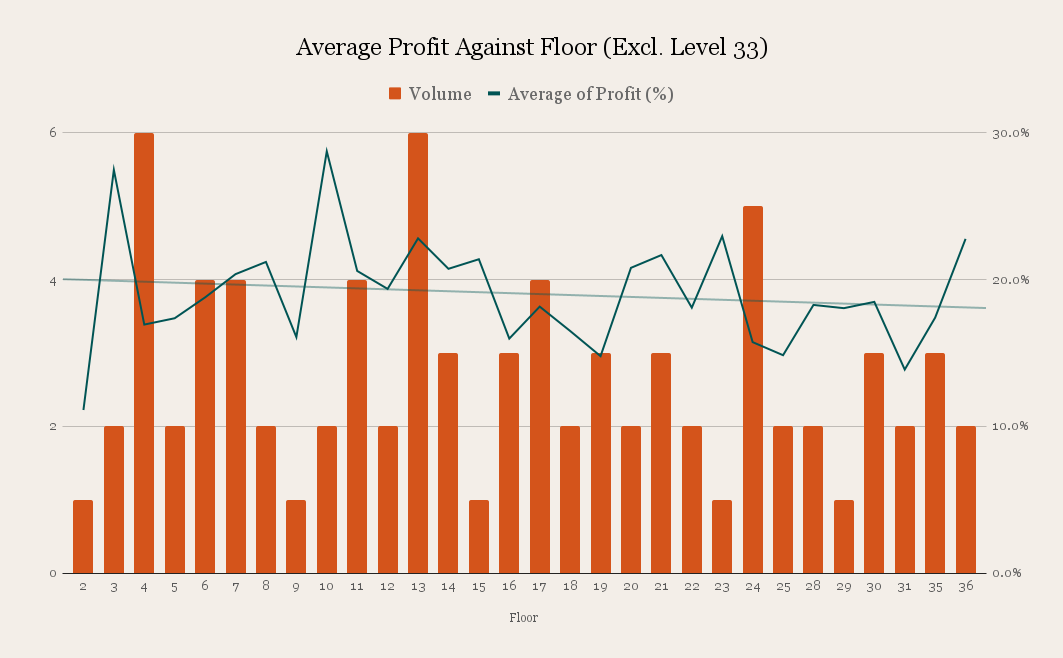
To put it in a more visual form, here’s what happens when we compare floor to profit:
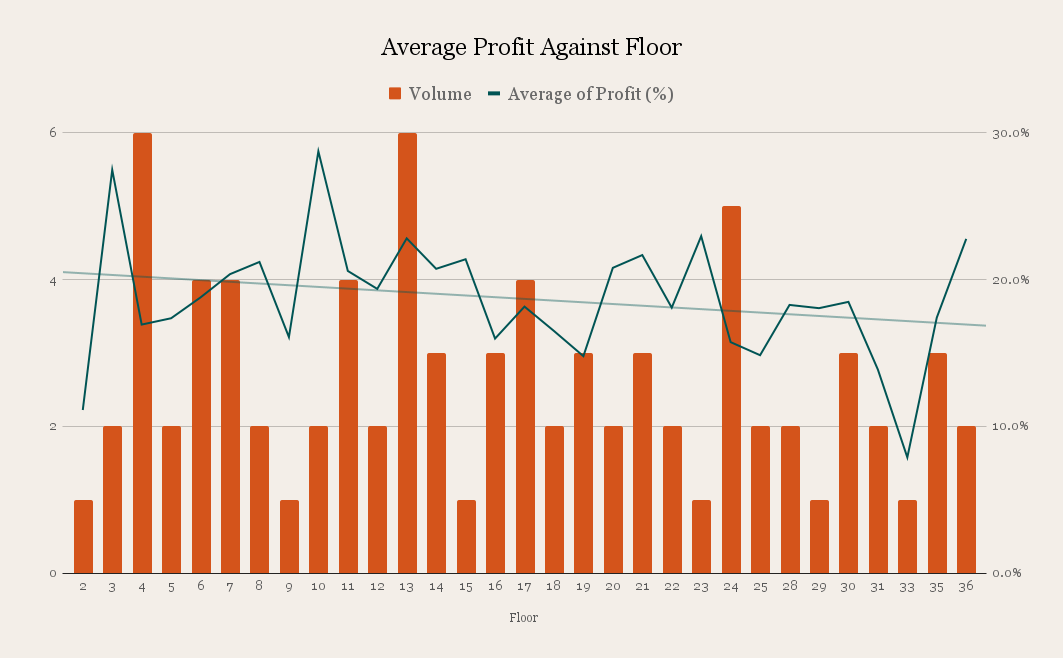
The slight downtrend suggests the lower floors might have better profits (possibly due to lower initial costs). But note that there are some outliers, such as the abnormally low 7.9 per cent profit margin for a single unit on the 33rd floor - this may slightly skew the results. However, even removing it doesn’t make a huge change, and the trend seems similar:
Now let’s look at Whistler Grand
Whistler Grand had a land price of $472.4 million, which comes to a price of about $800 psf. This is more than a third (35 per cent) higher than what was paid for Twin VEW, and the estimated breakeven price was accordingly higher at $1,314 psf.
But here’s an interesting twist:
| Bedrooms | 2018 | 2019 | 2020 | 2021 | 2021 | 2022 | 2023 | 2023 | 2024 |
| 1BR | $1,440 | $1,499 | $1,619 | $1,734 | $1,699 | $1,741 | $1,851 | $1,850 | $1,904 |
| 2BR | $1,364 | $1,439 | $1,530 | $1,625 | $1,662 | $1,694 | $1,881 | $1,892 | $1,858 |
| 3BR | $1,318 | $1,363 | $1,479 | $1,664 | $1,786 | $1,917 | $1,924 | ||
| 4BR | $1,295 | $1,315 | $1,386 | $1,416 | $1,696 | $1,796 | $1,829 | $1,732 | |
| 5BR | $1,295 | $1,378 | $1,377 | ||||||
| Grand Total | $1,357 | $1,399 | $1,515 | $1,563 | $1,681 | $1,697 | $1,833 | $1,878 | $1,869 |
Despite the higher breakeven price, the average developer price for Whistler Grand was just $1,357 psf, lower than Twin VEW’s $1,400 psf. But this could be due to Whistler Grand launching about half a year later than Twin VEW, and catching up by slightly undercutting its neighbour. It was quite a bold move, as CDL was selling for cheaper, despite paying more for the land price.
Price movements at Whistler Grand
| Bedroom | 2018 | 2019 | 2020 | 2021 |
| 1BR | $662,400 | $729,011 | $765,656 | $846,500 |
| 2BR | $915,411 | $976,999 | $1,039,240 | $1,039,287 |
| 3BR | $1,348,657 | $1,368,206 | $1,487,593 | |
| 4BR | $1,666,699 | $1,679,393 | $1,768,064 | $1,836,667 |
| 5BR | $1,868,400 | $1,987,924 | $1,985,964 | |
| Grand Total | $1,083,564 | $1,202,647 | $1,201,580 | $1,357,231 |
Let’s contrast this with Twin VEW. For ease of comparison, we’ve tabled the price differences between Twin VEW and Whistler Grand:
| Bedroom | 2018 | 2019 | 2020 | 2021 |
| 1BR | $136,388 | |||
| 2BR | $152,383 | $122,335 | ||
| 3BR | $70,161 | $315,794 | $191,782 | |
| 4BR | $182,711 | $170,608 | $272,811 | $174,697 |
| Grand Total | $171,924 | $254,496 | $658,545 | $606,055 |
Notice that between the two, Twin VEW - at the time of launch - had a price premium of $171,924 over Whistler Grand.
How profitable is Whistler Grand compared to Twin VEW?
Profits are quite strong, averaging around 26.9 per cent after a holding period of just under three years.
| Bedroom | Average of Profit (%) | Average of Holding Period | Volume |
| 1BR | 20.4% | 3.6 | 25 |
| 2BR | 25.7% | 3.7 | 40 |
| 3BR | 32.7% | 3.8 | 22 |
| 4BR | 34.8% | 4.1 | 10 |
| Grand Total | 26.9% | 3.8 | 97 |
For convenience, we took the profits from Twin VEW (see above), and just tabled the differences in profits:
| Bedrooms | Average of Profit (%) |
| 1BR | 3.9% |
| 2BR | 8.7% |
| 3BR | 13.1% |
| 4BR | 12.7% |
| Grand Total | 8.0% |
This clearly puts Whistler Grand in the lead, with its buyers making around 42 per cent more than Twin VEW. Whistler Grand saw better returns across units of all sizes - and given that most had a slightly shorter holding period, this would further raise the respective ROI for some buyers.
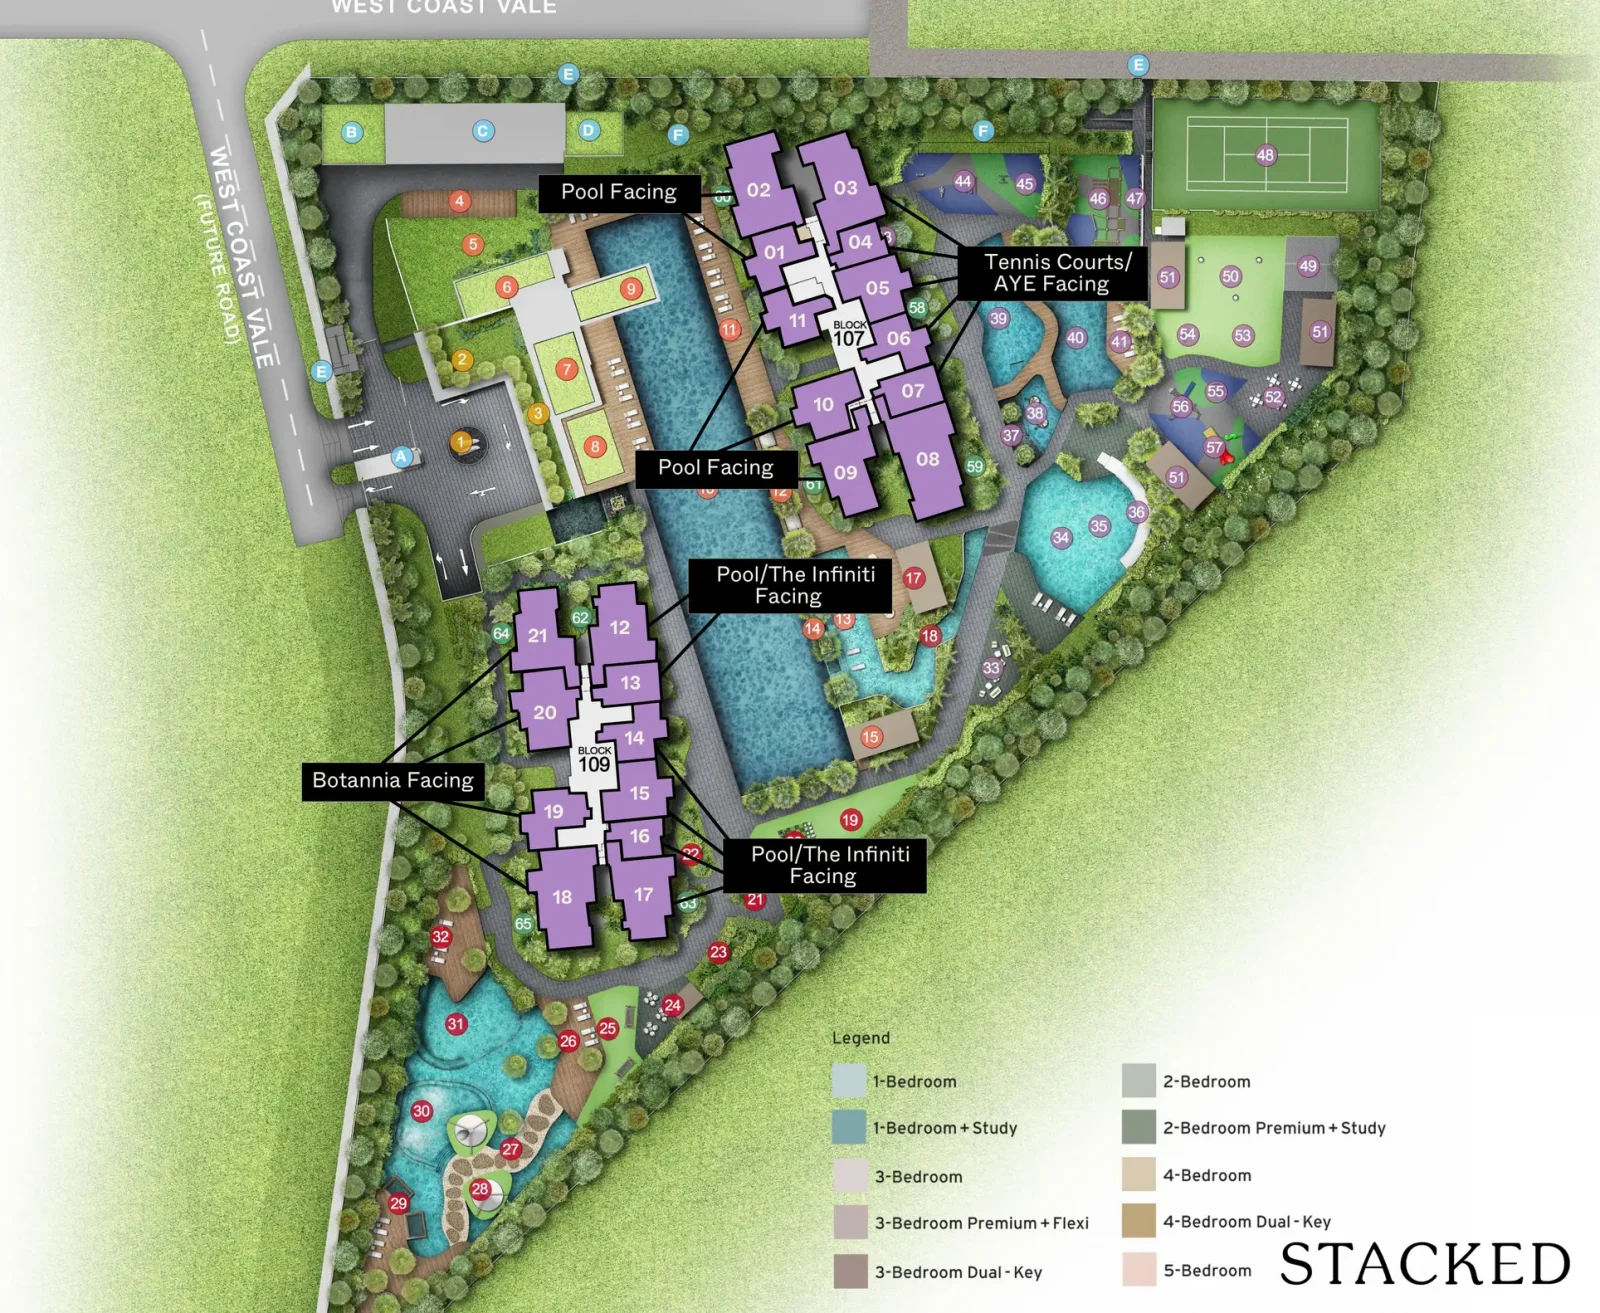
Whistler Grand’s performance by stack:
| Stack | Facing | Bedroom | Volume | Average of Profit (%) |
| 1 | Pool Facing | 2 | 4 | 26.6% |
| 2 | Pool Facing | 4 | 5 | 33.8% |
| 3 | Tennis Courts/AYE | 4 | 1 | 35.4% |
| 4 | Tennis Courts/AYE | 1 | 9 | 22.7% |
| 5 | Tennis Courts/AYE | 2 | 2 | 23.1% |
| 6 | Tennis Courts/AYE | 2 | 1 | 17.2% |
| 7 | Tennis Courts/AYE | 1 | 5 | 20.5% |
| 9 | Pool Facing | 3 | 2 | 26.8% |
| 10 | Pool Facing | 2 | 11 | 24.1% |
| 11 | Pool Facing | 2 | 6 | 30.8% |
| 12 | Pool/The Infiniti | 3 | 4 | 32.0% |
| 13 | Pool/The Infiniti | 1 | 4 | 16.8% |
| 14 | Pool/The Infiniti | 2 | 4 | 31.2% |
| 15 | Pool/The Infiniti | 2 | 6 | 22.8% |
| 16 | Pool/The Infiniti | 1 | 7 | 19.4% |
| 17 | Pool/The Infiniti | 3 | 4 | 35.7% |
| 18 | Botannia | 4 | 4 | 35.9% |
| 19 | Botannia | 2 | 6 | 24.6% |
| 20 | Botannia | 3 | 6 | 30.8% |
| 21 | Botannia | 3 | 6 | 35.1% |
| Grand Total | 97 | 26.9% |
The stacks facing Botannia, as well as the ones with a pool facing, were generally more profitable:
| Facing | Volume | Average Profit (%) |
| Botannia | 22 | 31.6% |
| Pool Facing | 28 | 28.4% |
| Pool/The Infiniti | 29 | 26.3% |
| Tennis Courts/AYE | 18 | 23.8% |
| Grand Total | 97 | 27.3% |
But it may not be entirely to do with the stack’s facing
We noticed that, for the stacks facing Botannia, the four-bedders were the most profitable unit types; and for the pool-facing units, the transactions were larger four-bedders. So as we mentioned above, it may be due to HDB upgraders looking for larger condo units; this suggests unit sizes and layouts, rather than stack facings, are responsible for better gains.
Looking at profitability by floor
Whistler Grand showed a similar trend to Twin VEW, in this particular comparison:
| Floor | Volume | Average of Profit (%) |
| 2 | 4 | 31.0% |
| 3 | 4 | 30.8% |
| 4 | 6 | 25.5% |
| 5 | 3 | 28.0% |
| 6 | 6 | 26.1% |
| 7 | 2 | 23.1% |
| 8 | 4 | 28.0% |
| 9 | 3 | 36.9% |
| 10 | 5 | 25.1% |
| 11 | 4 | 26.4% |
| 12 | 5 | 29.8% |
| 13 | 3 | 33.1% |
| 14 | 2 | 28.0% |
| 15 | 3 | 31.5% |
| 16 | 6 | 23.6% |
| 17 | 2 | 26.9% |
| 18 | 1 | 29.1% |
| 19 | 5 | 28.2% |
| 20 | 1 | 31.3% |
| 21 | 1 | 37.7% |
| 22 | 1 | 16.3% |
| 23 | 3 | 18.9% |
| 24 | 3 | 24.7% |
| 25 | 3 | 17.6% |
| 26 | 2 | 20.4% |
| 27 | 4 | 30.9% |
| 28 | 3 | 22.6% |
| 30 | 2 | 17.1% |
| 31 | 2 | 29.0% |
| 32 | 1 | 17.2% |
| 33 | 1 | 27.5% |
| 34 | 1 | 27.6% |
| 36 | 1 | 35.0% |
| Grand Total | 97 | 26.9% |
There is the same downward trendline we saw in Twin VEW:
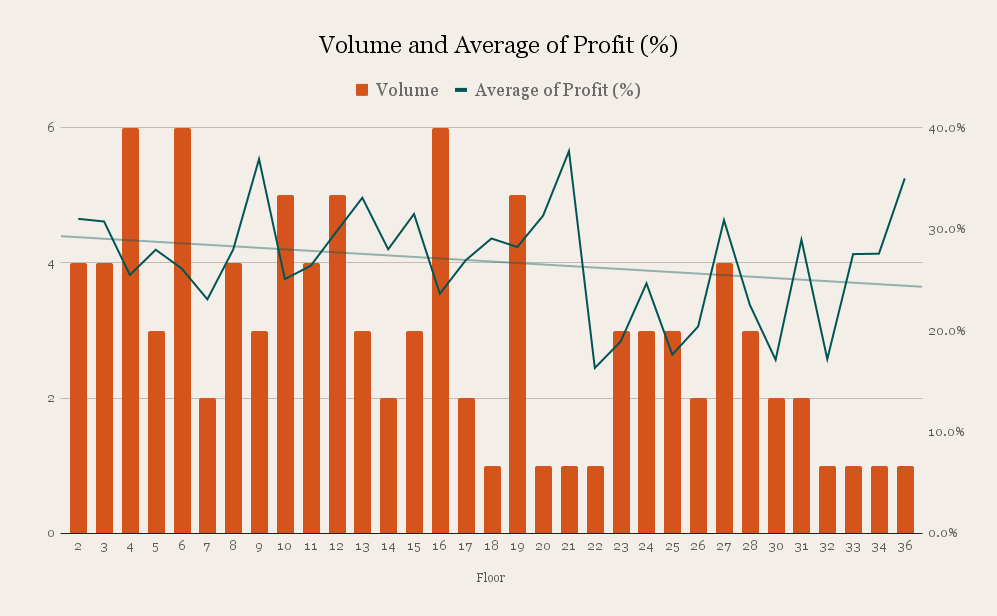
Again, we see that lower floor units seem to have better chances for higher profit. As with Twin Vew, this may be due to lower prices - and more room for appreciation - compared to high-floor units.
Overall, Whistler Grand seems to have come out ahead
While both projects launched at the same time, Whistler Grand just seems to have been better priced from the start. In terms of developer comparisons, CDL may also have an edge in this neighbourhood: consider that nearby Botannia (built in 2006) was also a CDL project, as is Hundred Trees just around a kilometre down the road (built in 2013).
At Stacked, we like to look beyond the headlines and surface-level numbers, and focus on how things play out in the real world.
If you'd like to discuss how this applies to your own circumstances, you can reach out for a one-to-one consultation here.
And if you simply have a question or want to share a thought, feel free to write to us at stories@stackedhomes.com. We read every message.



3 Comments
Hi Ryan, i believe the average sqft per unit (or per n-bedder) in Whistler Grand is smaller than that in Twin Vew. Could this be a factor why Whistler Grand seems to come out ahead in your analysis?
Hi what does the grand total refers to, in the first two tables after the sub header Price movements at Whistler Grand?