

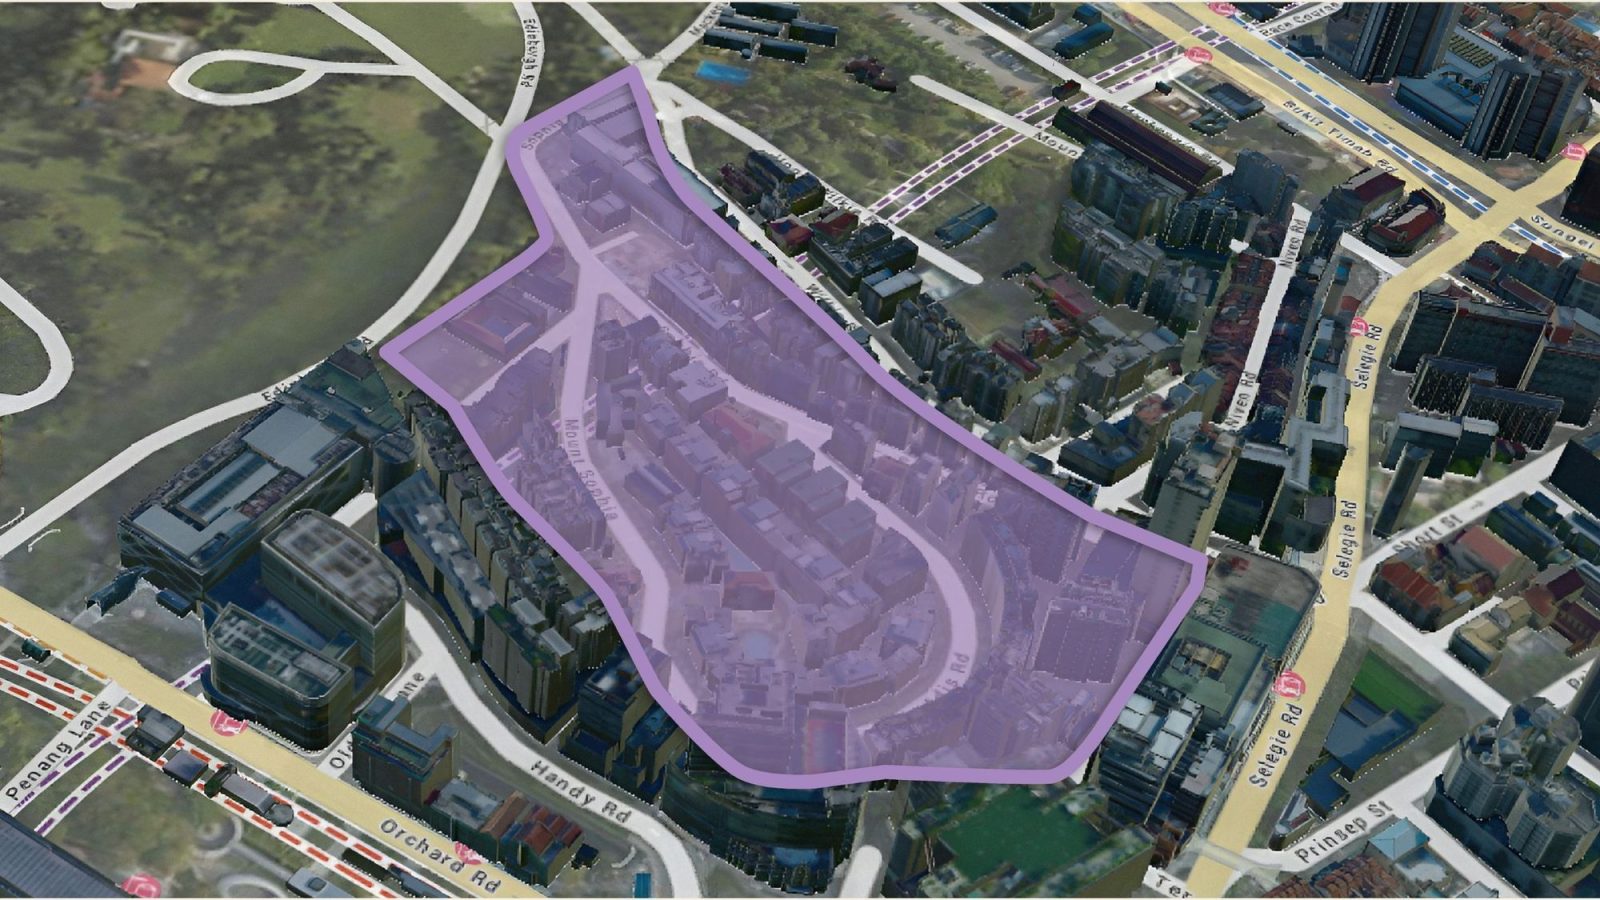
Hi Stacked Team, I was hoping to get your take on private properties around Sophia Road. Most developments there are freehold, and despite being in District 9 with good MRT connectivity and amenities, price growth appears relatively subdued. Even recent new launches in the area don’t seem to have lifted surrounding resale prices very much.
What do you think is holding prices back? I’d appreciate your thoughts, thank you.
Hi and thanks for writing!
Yes, Sophia Road is something of an oddity. Its location could be described as liminal. It’s close to the Orchard Road shopping belt without being quite in that prime retail strip, and it's close to the fringe of Bencoolen and Rochor. The Sophia Road residential enclave is often seen as an area one might pass by to get to town, rather than being the intended destination.
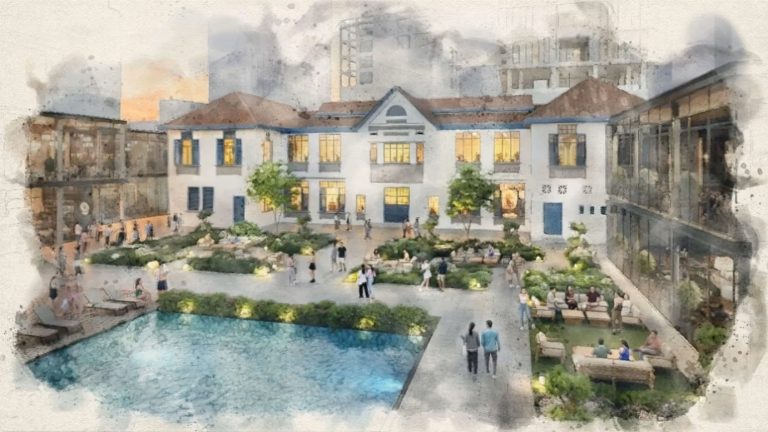
It’s also worth pointing out that, before its redevelopment into The Collective at One Sophia, the former Peace Centre and Peace Mansion was a bit of a neighbourhood issue. The collection of KTV outlets here (and to some extent at the neighbouring Parklane) caused a bit of disquiet in the past. The area looks set for rejuvenation with the completion of The Collective at One Sophia in 2032.
Full disclosure by the way: the Sophia Road area was almost a second home to this writer for many years. This was where he had his first office and he still comes to this area almost every other weekend.
That said, the drawbacks of the Sophia Road area that I’ve mentioned aren’t always visible. If you don’t know the area’s history, or don’t frequent it on foot, Sophia Road may seem to resemble a typical prime District 9 address: a lot of projects with freehold tenure, good proximity to MRT stations, and proximity to the prime Orchard Road shopping belt.
In terms of data, which we’re about to present below, prices in this area tend to be of the slow-and-steady variety. Let’s take a look at how things work in this area:
The challenge for many buyers today isn't access to information.
It's interpreting that information in a way that makes sense for their finances, goals, and stage of life.
Over time, that's also why we decided to work with agents who shared the same data-driven and advisory-led approach behind our editorial, consultants who could help readers think through decisions more objectively, rather than simply push transactions.
Today, the team has worked with more than 2,000 clients across over $5B in property transactions.
Notable traits of Sophia Road as a micro-location
The Sophia Road area is differentiated in the following ways:
1. This area is central, but less walkable than it would appear
Viewed on the map, Sophia Road is close to Bencoolen MRT Station on the Downtown Line (DTL) and Dhoby Ghaut Interchange on the North-South, North-East, and Circle Lines (NSL, NEL, CCR). Developments that are located near the junction of Sophia Road and Selegie Road, Bencoolen station is typically within a six to nine minute walk; while Dhoby Ghaut is usually a ten-minute walk away.
The issue is that the entire enclave is on an elevated site, and for projects uphill it can take more than 10 minutes to walk out of the estate. The uphill terrain doesn’t help either for those with mobility challenges and the elderly. From my experience, it’s not uncommon to be drenched in sweat and panting, if you’ve made your way up from the technically “nearby” Dhoby Ghaut MRT.
As is, most buyers consider a flat seven-minute walk to be a big deal of difference from a 10-minute uphill walk. This is an even bigger distinction in a prime district, where expectations of convenience tend to be much higher.
2. The residential projects here are tilted toward investors, rather than owner-occupiers
Most private residential developments on Sophia Road are:
- Boutique to mid-sized project
- Unit mixes dominated by one- and two-bedroom unit types
- With a more apartment-style profile, rather than a luxury-condo feel
Even a casual stroll will reveal that, unlike other prime residential areas in District 9 like Ardmore Park or Nassim Road, most of the homes on Sophia Road don’t cast that kind of luxury vibe. This area mainly caters to singles, younger couples, and investors, and for a long time, it’s been regarded as one of the more affordable locales near the city centre.
By extension, this is also not a family-centric area
Primary school options within proximity are limited and larger units are harder to find. The traffic tends to be more congested, and the stretch along Middle Road is possibly one of the most irritating stretches for pedestrians and drivers alike. There are multiple traffic lights that leave the stretch choked and congested.
This area is also not particularly huge on greenery and is lacking in open spaces. As a result, demand from owner-occupier families tends to be more muted, as compared with areas such as River Valley or Newton.
3. Some buyers aren’t comfortable with tenant profile here
The KTV cluster at Peace Centre may be gone. But this area has the benefit of proximity to Orchard, as well as Bras Basah and the nightlife near Bugis, plus it's one of the most affordable places to rent near the city centre. Anecdotally, this area has historically tended to attract tenants who work irregular hours in entertainment-related industries.
To be clear, we’re not casting aspersions on any particular job, and we don’t consider all this to be inherently negative. However, we’d be lying if we said there isn’t a perception that can form around this; it doesn’t create the same impression as the quiet, prestige-oriented enclaves often associated with D9. Sophia Road may be in the same district, but it doesn’t feel the same to many.
Simply put, D9 is not a uniform market
Within the district, upmarket residential enclaves such as Ardmore Park and Nassim Road occupy the ultra-prime tier, while River Valley benefits from stronger family and lifestyle appeal. Sophia Road though, is a more fringe and liminal part of this prime district.
This attracts different sets of buyers and tenants, so we can’t have the same expectations here that we have from other parts of D9.
Now for some data: let’s look at why recent launches didn’t lift prices in the area
The following are some of the projects within the Sophia Road micro-location:
| Project | Tenure | Completion year | No. of units |
| SOPHIA 98 | Freehold | 2002 | 16 |
| SOPHIA LODGE | Freehold | 2006 | 15 |
| 8 @ MOUNT SOPHIA | 103-year | 2007 | 313 |
| MOUNT SOPHIA SUITES | Freehold | 2010 | 50 |
| PARC SOPHIA | Freehold | 2011 | 152 |
| SOPHIA RESIDENCE | Freehold | 2014 | 272 |
| LIV ON SOPHIA | Freehold | 2016 | 64 |
| SOPHIA HILLS | 99-year | 2018 | 493 |
| ORCHARD SOPHIA | Freehold | 2027 | 78 |
| THE COLLECTIVE AT ONE SOPHIA | 99-year | 2028 | 367 |
Let’s take a look at their price movements, and transaction volumes:
Average $PSF
| Year | SOPHIA 98 | SOPHIA LODGE | 8 @ MOUNT SOPHIA | MOUNT SOPHIA SUITES | PARC SOPHIA | SOPHIA RESIDENCE | LIV ON SOPHIA | SOPHIA HILLS | ORCHARD SOPHIA | THE COLLECTIVE AT ONE SOPHIA |
| 2015 | $1,558 | $2,000 | $1,847 | $1,594 | $1,910 | |||||
| 2016 | $1,468 | $1,478 | $1,305 | $1,631 | $1,504 | $1,415 | $1,932 | |||
| 2017 | $1,218 | $1,417 | $1,579 | $1,601 | $1,526 | $2,008 | ||||
| 2018 | $1,506 | $1,492 | $1,673 | $1,716 | $1,606 | $2,378 | $2,186 | |||
| 2019 | $1,503 | $1,342 | $1,634 | $1,696 | $2,270 | $2,030 | ||||
| 2020 | $1,239 | $1,435 | $1,803 | $1,613 | $1,501 | $2,237 | $1,992 | |||
| 2021 | $1,517 | $1,775 | $1,671 | $1,566 | $2,093 | $1,959 | ||||
| 2022 | $1,501 | $1,877 | $1,766 | $1,837 | $2,020 | |||||
| 2023 | $1,868 | $1,565 | $1,769 | $1,792 | $1,728 | $2,095 | $2,101 | $2,818 | ||
| 2024 | $1,608 | $1,633 | $1,658 | $1,928 | $1,840 | $2,132 | $2,884 | $2,739 | ||
| 2025 | $1,632 | $1,711 | $1,875 | $1,775 | $1,728 | $2,311 | $2,115 | $2,793 | $2,791 | |
| % change in $PSF from 2023 to 2025 | - | - | 9.35% | 5.97% | -0.93% | 0.00% | 10.30% | 0.71% | -0.86% | - |
| Annualised growth rate from 2015 to 2025 | - | - | 0.95% | -0.65% | -0.39% | 0.81% | - | 1.03% |
Transaction volume
| Year | SOPHIA 98 | SOPHIA LODGE | 8 @ MOUNT SOPHIA | MOUNT SOPHIA SUITES | PARC SOPHIA | SOPHIA RESIDENCE | LIV ON SOPHIA | SOPHIA HILLS | ORCHARD SOPHIA | THE COLLECTIVE AT ONE SOPHIA |
| 2014 | 1 | 1 | 2 | 10 | 8 | |||||
| 2015 | 8 | 1 | 3 | 9 | 46 | |||||
| 2016 | 1 | 1 | 12 | 1 | 2 | 5 | 102 | |||
| 2017 | 1 | 15 | 2 | 9 | 10 | 310 | ||||
| 2018 | 1 | 14 | 4 | 7 | 16 | 1 | 25 | |||
| 2019 | 1 | 7 | 5 | 6 | 2 | 1 | ||||
| 2020 | 1 | 7 | 5 | 8 | 11 | 1 | 1 | |||
| 2021 | 15 | 4 | 7 | 12 | 3 | 10 | ||||
| 2022 | 13 | 3 | 6 | 7 | 25 | |||||
| 2023 | 1 | 12 | 2 | 9 | 5 | 1 | 24 | 32 | ||
| 2024 | 18 | 1 | 4 | 11 | 2 | 23 | 13 | 65 | ||
| 2025 | 2 | 15 | 3 | 7 | 3 | 5 | 26 | 25 | 19 |
Usually, new launches have a positive knock-on effect that help to raise prices of existing projects, usually by setting a new average benchmark $PSF for the area.
Looking at the data, the 2023 launches didn’t seem to accomplish this for this area. Between 2023 and 2025, resale performance in the area was uneven. Some projects recorded gains, others remained flat, but there was no clear sign of the new launches helping prices rise across the board.
The pricing gap between new launches, which saw prices of around $2,800 psf, and surrounding resale stock, where average prices were in the $1,600–$2,100 psf range, was more or less maintained.
If we zoom out further, we see that from 2015 to 2025, annualised growth in this cluster has been quite weak, ranging from flat to single digits. The properties here are trailing both D9 and the Singapore-wide private home averages.
But to be more precise, let’s look at how specific unit sizes fare at Sophia Road
1-bedroom units
Average $PSF
| Year | SOPHIA 98 | 8 @ MOUNT SOPHIA | MOUNT SOPHIA SUITES | PARC SOPHIA | SOPHIA RESIDENCE | SOPHIA HILLS | ORCHARD SOPHIA | THE COLLECTIVE AT ONE SOPHIA |
| 2015 | $1,614 | $2,000 | $1,916 | $2,092 | ||||
| 2016 | $1,458 | $1,573 | $1,886 | $1,998 | ||||
| 2017 | $1,398 | $1,579 | $1,601 | $2,050 | ||||
| 2018 | $1,452 | $1,688 | $1,775 | $2,271 | ||||
| 2019 | $1,503 | $1,630 | ||||||
| 2020 | $1,518 | $1,814 | $1,613 | |||||
| 2021 | $1,525 | $1,703 | $1,669 | $1,981 | ||||
| 2022 | $1,571 | $1,910 | $1,780 | $2,082 | ||||
| 2023 | $1,539 | $1,769 | $1,785 | $2,137 | $2,821 | |||
| 2024 | $1,593 | $1,828 | $2,082 | $2,864 | $2,779 | |||
| 2025 | $1,604 | $1,894 | $1,783 | $2,005 | $2,775 | |||
| % change in $PSF from 2023 to 2025 | - | 4.24% | 7.07% | -0.14% | - | -6.18% | - | - |
Average price
| Year | SOPHIA 98 | 8 @ MOUNT SOPHIA | MOUNT SOPHIA SUITES | PARC SOPHIA | SOPHIA RESIDENCE | SOPHIA HILLS | ORCHARD SOPHIA | THE COLLECTIVE AT ONE SOPHIA |
| 2015 | $1,390,000 | $732,000 | $907,500 | $1,070,500 | ||||
| 2016 | $1,267,500 | $1,050,000 | $1,157,000 | $1,066,591 | ||||
| 2017 | $1,198,333 | $884,000 | $1,005,000 | $1,159,671 | ||||
| 2018 | $1,278,600 | $880,000 | $961,600 | $1,321,182 | ||||
| 2019 | $890,000 | $986,950 | ||||||
| 2020 | $1,306,667 | $817,750 | $938,500 | |||||
| 2021 | $1,323,200 | $895,500 | $937,800 | $1,130,000 | ||||
| 2022 | $1,377,000 | $760,400 | $982,000 | $1,141,296 | ||||
| 2023 | $1,380,000 | $928,500 | $1,101,667 | $1,143,861 | $1,289,308 | |||
| 2024 | $1,368,955 | $1,220,000 | $1,188,000 | $1,366,781 | $1,310,933 | |||
| 2025 | $1,390,000 | $958,000 | $1,137,000 | $1,147,625 | $1,332,889 |
Average unit size (based on transactions done)
| Year | SOPHIA 98 | 8 @ MOUNT SOPHIA | MOUNT SOPHIA SUITES | PARC SOPHIA | SOPHIA RESIDENCE | SOPHIA HILLS | ORCHARD SOPHIA | THE COLLECTIVE AT ONE SOPHIA |
| 2015 | 861 | 366 | 474 | 517 | ||||
| 2016 | 869 | 667 | 614 | 535 | ||||
| 2017 | 857 | 560 | 636 | 565 | ||||
| 2018 | 883 | 522 | 551 | 583 | ||||
| 2019 | 592 | 605 | ||||||
| 2020 | 861 | 458 | 584 | |||||
| 2021 | 867 | 528 | 564 | 570 | ||||
| 2022 | 878 | 399 | 558 | 549 | ||||
| 2023 | 899 | 528 | 619 | 536 | 457 | |||
| 2024 | 859 | 667 | 570 | 477 | 471 | |||
| 2025 | 866 | 506 | 638 | 572 | 481 |
Transaction volume
| Year | SOPHIA 98 | 8 @ MOUNT SOPHIA | MOUNT SOPHIA SUITES | PARC SOPHIA | SOPHIA RESIDENCE | SOPHIA HILLS | ORCHARD SOPHIA | THE COLLECTIVE AT ONE SOPHIA |
| 2015 | 1 | 1 | 2 | 2 | ||||
| 2016 | 4 | 1 | 1 | 11 | ||||
| 2017 | 3 | 2 | 9 | 82 | ||||
| 2018 | 5 | 2 | 5 | 11 | ||||
| 2019 | 1 | 4 | ||||||
| 2020 | 3 | 4 | 8 | |||||
| 2021 | 5 | 2 | 5 | 1 | ||||
| 2022 | 7 | 2 | 5 | 3 | ||||
| 2023 | 2 | 2 | 6 | 7 | 13 | |||
| 2024 | 7 | 1 | 5 | 3 | 15 | |||
| 2025 | 6 | 1 | 4 | 12 | 9 |
For one-bedders, the pricing gap between new and resale stock hasn’t moved much.
Orchard Sophia and The Collective at One Sophia transact well above the rest of the cluster on a $PSF basis, but this pricing has remained among the new projects only; there’s no sign that the new benchmark managed to uplift older resale stock (at least not in any visible, consistent way).
Also note that in some projects, like 8@ Mount Sophia, one-bedders are substantially larger than those in other resale developments and the new launches. As a result, despite transacting at a much lower $PSF, the total quantum can be comparable to or even higher than the new projects. Those buyers seem to be making a direct trade-off between space and new homes.
Transaction volumes across resale projects remained steady, but didn’t see a sharp jump post-2023. Overall, the data suggests that recent launches here introduced a different subgroup with a higher $PSF, rather than uplifting general prices in the area.
2-bedroom units
Average $PSF
| Year | SOPHIA 98 | 8 @ MOUNT SOPHIA | MOUNT SOPHIA SUITES | PARC SOPHIA | SOPHIA RESIDENCE | LIV ON SOPHIA | SOPHIA HILLS | ORCHARD SOPHIA | THE COLLECTIVE AT ONE SOPHIA |
| 2015 | $1,530 | $1,708 | $1,535 | $1,898 | |||||
| 2016 | $1,468 | $1,196 | $1,631 | $1,435 | $1,936 | ||||
| 2017 | $1,218 | $1,452 | $1,805 | $2,004 | |||||
| 2018 | $1,554 | $1,658 | $1,570 | $2,378 | $1,889 | ||||
| 2019 | $1,578 | $1,650 | $2,270 | $2,030 | |||||
| 2020 | $1,239 | $1,645 | $1,760 | $1,657 | $2,237 | $1,992 | |||
| 2021 | $1,588 | $1,846 | $1,676 | $2,093 | $1,938 | ||||
| 2022 | $1,606 | $1,811 | $1,694 | $1,808 | $2,012 | ||||
| 2023 | $1,868 | $1,442 | $1,805 | $2,009 | $2,095 | $2,109 | $2,829 | ||
| 2024 | $1,633 | $1,633 | $1,601 | $1,864 | $1,840 | $2,136 | $2,936 | $2,731 | |
| 2025 | $1,678 | $1,865 | $1,765 | $2,009 | $2,311 | $2,198 | $2,813 | $2,807 | |
| % change in $PSF from 2023 to 2025 | - | 16.37% | - | -2.22% | 0.00% | 10.30% | 4.20% | -0.56% | - |
Average price
| Year | SOPHIA 98 | 8 @ MOUNT SOPHIA | MOUNT SOPHIA SUITES | PARC SOPHIA | SOPHIA RESIDENCE | LIV ON SOPHIA | SOPHIA HILLS | ORCHARD SOPHIA | THE COLLECTIVE AT ONE SOPHIA |
| 2015 | $1,490,000 | $1,250,000 | $1,388,000 | $1,326,415 | |||||
| 2016 | $1,438,000 | $1,390,000 | $1,106,000 | $1,528,888 | $1,343,624 | ||||
| 2017 | $1,705,000 | $1,500,000 | $1,438,000 | $1,379,972 | |||||
| 2018 | $1,510,150 | $1,089,000 | $1,149,000 | $1,280,000 | $1,342,000 | ||||
| 2019 | $1,750,000 | $1,190,000 | $1,209,444 | $1,420,000 | |||||
| 2020 | $1,840,000 | $1,700,000 | $1,118,000 | $1,320,000 | $1,180,000 | $1,415,000 | |||
| 2021 | $1,614,500 | $1,211,500 | $1,217,500 | $1,206,000 | $1,322,143 | ||||
| 2022 | $1,659,000 | $1,150,000 | $1,240,000 | $1,440,000 | $1,399,833 | ||||
| 2023 | $1,830,000 | $1,381,500 | $1,321,333 | $1,600,000 | $1,150,000 | $1,481,333 | $1,785,286 | ||
| 2024 | $1,793,333 | $1,160,000 | $1,280,667 | $1,525,000 | $1,275,000 | $1,418,923 | $1,873,955 | $1,940,833 | |
| 2025 | $1,629,000 | $1,184,500 | $1,310,000 | $1,600,000 | $1,233,600 | $1,522,525 | $1,742,458 | $1,998,500 |
Average unit size (based on transactions done)
| Year | SOPHIA 98 | 8 @ MOUNT SOPHIA | MOUNT SOPHIA SUITES | PARC SOPHIA | SOPHIA RESIDENCE | LIV ON SOPHIA | SOPHIA HILLS | ORCHARD SOPHIA | THE COLLECTIVE AT ONE SOPHIA |
| 2015 | 974 | 732 | 904 | 699 | |||||
| 2016 | 980 | 1163 | 678 | 1066 | 695 | ||||
| 2017 | 1399 | 1033 | 797 | 689 | |||||
| 2018 | 974 | 657 | 732 | 538 | 710 | ||||
| 2019 | 1109 | 721 | 533 | 700 | |||||
| 2020 | 1485 | 1033 | 635 | 797 | 527 | 710 | |||
| 2021 | 1014 | 657 | 727 | 581 | 683 | ||||
| 2022 | 1033 | 635 | 732 | 797 | 696 | ||||
| 2023 | 980 | 958 | 732 | 797 | 549 | 703 | 631 | ||
| 2024 | 1102 | 710 | 804 | 818 | 694 | 664 | 639 | 709 | |
| 2025 | 969 | 635 | 743 | 797 | 534 | 693 | 619 | 712 |
Transaction volume
| Year | SOPHIA 98 | 8 @ MOUNT SOPHIA | MOUNT SOPHIA SUITES | PARC SOPHIA | SOPHIA RESIDENCE | LIV ON SOPHIA | SOPHIA HILLS | ORCHARD SOPHIA | THE COLLECTIVE AT ONE SOPHIA |
| 2015 | 2 | 1 | 1 | 38 | |||||
| 2016 | 1 | 1 | 1 | 1 | 74 | ||||
| 2017 | 1 | 1 | 1 | 177 | |||||
| 2018 | 2 | 2 | 2 | 1 | 1 | ||||
| 2019 | 1 | 1 | 2 | 1 | |||||
| 2020 | 1 | 1 | 1 | 1 | 1 | 1 | |||
| 2021 | 4 | 2 | 2 | 3 | 7 | ||||
| 2022 | 2 | 1 | 1 | 4 | 18 | ||||
| 2023 | 1 | 2 | 3 | 1 | 1 | 12 | 14 | ||
| 2024 | 3 | 1 | 3 | 1 | 2 | 13 | 6 | 18 | |
| 2025 | 3 | 2 | 3 | 1 | 5 | 11 | 21 | 6 |
The two-bedroom segment shows the same pattern. Since 2023, price gains have been confined to the newer projects, while others have remained largely flat.
Differences in unit size might account for this. Older resale projects tend to have bigger two-bedders, and larger units often transact at a higher overall price (quantum), whilst having a lower $PSF.
Overall, our analysis in this segment is similar to what we saw among one-bedders.
3-bedroom units
Average $PSF
| Year | SOPHIA LODGE | 8 @ MOUNT SOPHIA | SOPHIA RESIDENCE | SOPHIA HILLS | ORCHARD SOPHIA | THE COLLECTIVE AT ONE SOPHIA |
| 2015 | $1,558 | $1,603 | $1,909 | |||
| 2016 | $1,478 | $1,232 | $1,136 | $1,872 | ||
| 2017 | $1,419 | $1,537 | $1,947 | |||
| 2018 | $1,506 | $1,503 | $1,626 | $2,213 | ||
| 2019 | $1,303 | $1,719 | ||||
| 2020 | $1,282 | $1,439 | ||||
| 2021 | $1,463 | $1,520 | $2,024 | |||
| 2022 | $1,324 | $1,886 | $2,012 | |||
| 2023 | $1,602 | $1,577 | $2,048 | $2,779 | ||
| 2024 | $1,613 | $1,979 | $2,171 | $2,821 | ||
| 2025 | $1,632 | $1,836 | $1,587 | $2,255 | $2,839 | |
| % change in $PSF from 2023 to 2025 | - | 14.55% | 0.61% | 10.07% | - | - |
Average price
| Year | SOPHIA LODGE | 8 @ MOUNT SOPHIA | SOPHIA RESIDENCE | SOPHIA HILLS | ORCHARD SOPHIA | THE COLLECTIVE AT ONE SOPHIA |
| 2015 | $2,225,000 | $2,391,667 | $1,785,250 | |||
| 2016 | $1,480,000 | $2,045,857 | $2,525,000 | $1,822,568 | ||
| 2017 | $2,002,727 | $1,961,984 | $2,019,066 | |||
| 2018 | $1,540,000 | $2,142,857 | $2,341,000 | $2,249,700 | ||
| 2019 | $2,251,667 | $2,297,250 | ||||
| 2020 | $2,223,333 | $2,186,667 | ||||
| 2021 | $2,224,815 | $2,332,000 | $2,059,000 | |||
| 2022 | $2,753,250 | $2,700,000 | $2,025,000 | |||
| 2023 | $2,426,625 | $2,863,333 | $1,940,000 | $2,249,400 | ||
| 2024 | $2,508,611 | $2,635,714 | $2,139,800 | $2,254,528 | ||
| 2025 | $1,625,000 | $2,658,333 | $2,970,000 | $2,198,333 | $2,903,000 |
Average unit size (based on transactions done)
| Year | SOPHIA LODGE | 8 @ MOUNT SOPHIA | SOPHIA RESIDENCE | SOPHIA HILLS | ORCHARD SOPHIA | THE COLLECTIVE AT ONE SOPHIA |
| 2015 | 1427 | 1563 | 934 | |||
| 2016 | 1001 | 1758 | 2218 | 974 | ||
| 2017 | 1412 | 1318 | 1037 | |||
| 2018 | 1023 | 1428 | 1452 | 1019 | ||
| 2019 | 1821 | 1338 | ||||
| 2020 | 1797 | 1616 | ||||
| 2021 | 1575 | 1587 | 1018 | |||
| 2022 | 2185 | 1432 | 1007 | |||
| 2023 | 1537 | 1891 | 943 | 810 | ||
| 2024 | 1589 | 1345 | 986 | 799 | ||
| 2025 | 996 | 1448 | 1997 | 976 | 1023 |
Transaction volume
| Year | SOPHIA LODGE | 8 @ MOUNT SOPHIA | SOPHIA RESIDENCE | SOPHIA HILLS | ORCHARD SOPHIA | THE COLLECTIVE AT ONE SOPHIA |
| 2015 | 5 | 6 | 4 | |||
| 2016 | 1 | 7 | 2 | 17 | ||
| 2017 | 11 | 7 | 46 | |||
| 2018 | 1 | 7 | 15 | 10 | ||
| 2019 | 6 | 4 | ||||
| 2020 | 3 | 6 | ||||
| 2021 | 6 | 10 | 2 | |||
| 2022 | 4 | 1 | 4 | |||
| 2023 | 8 | 3 | 3 | 5 | ||
| 2024 | 8 | 7 | 5 | 4 | ||
| 2025 | 2 | 6 | 2 | 3 | 2 |
The pattern holds again for three-bedders, where new launches didn’t pull prices up and instead carved out a separate price tier for the newer condos.
We do notice that the older resale projects have substantially larger three-bedders, which shifts the buyer profile dramatically toward owner-occupiers rather than investors. This is a break from the one- and two-bedder units that predominate in the Sophia Road area.
That said, very large units also mean a correspondingly high price quantum, despite the lower $PSF. This can limit transaction volumes, which in turn inhibit price discovery and sharper price increases.
Looking across the unit-types, one pattern seems to hold: larger units have generally shown a more stable price appreciation trajectory.
This is most evident at 8 @ Mount Sophia, which recorded price growth across all unit types. Unlike the newer launches, which tend to have more compact units, 8 @ Mount Sophia has larger layouts priced at a lower $PSF - though at a comparable quantum.
This could be read as being a better value buy by those who emphasise sheer square footage in their homes.
Larger units in this area are also more scarce and they ultimately have less competition, as the many one- and two-bedders here aren’t viable replacements - at least not in the eyes of most owner-occupier families. This can sometimes insulate them from the pricing segmentation (old versus new) that we see above.
Within the Sophia Road area, it would seem that buyer concerns are more angled towards price than about other factors like lease tenures.
Zooming out: Sophia Road versus the wider market
To get some context on what the typical performance of private residential properties in D9 means, here’s a comparison of the Core Central Region (CCR), versus the Rest of Central Region (RCR) and Outside of Central Region (OCR).
| Year | CCR | RCR | OCR |
| 2015 | $1,815 | $1,378 | $1,015 |
| 2016 | $1,942 | $1,380 | $1,008 |
| 2017 | $1,906 | $1,453 | $1,053 |
| 2018 | $2,100 | $1,586 | $1,136 |
| 2019 | $2,242 | $1,714 | $1,219 |
| 2020 | $2,130 | $1,670 | $1,221 |
| 2021 | $2,271 | $1,796 | $1,251 |
| 2022 | $2,359 | $2,035 | $1,382 |
| 2023 | $2,352 | $2,220 | $1,523 |
| 2024 | $2,320 | $2,157 | $1,654 |
| 2025 | $2,620 | $2,357 | $1,769 |
| Annualised | 3.74% | 5.51% | 5.71% |
Over the past decade, the Core Central Region (CCR) has generally lagged the Rest of Central Region (RCR) and the Outside Central Region (OCR) in annualised growth.
This isn’t inherently surprising, since CCR properties start off more expensive and naturally show weaker percentage growth.
Nonetheless, we can see that the Sophia Road cluster appears to have underperformed even the lower CCR baseline. Sophia Road developments have sometimes delivered flat to single-digit annualised gains over the same period.
What does this mean for buyers?
First, it means we need to consider that different areas within the same district can be very different. Despite its largely freehold status and District 9 address, the Sophia Road enclave is not a traditional prestige enclave.
It’s not Ardmore Park, Nassim Road, Tanglin, or Orchard Road. It’s more of a gateway into these areas. It’s also a functional area, where those who need to live or work near the city centre can find affordable options.
Freehold tenure is also less of a differentiator here; at least in part because freehold is a norm in areas like D9. Freehold tends to have a stronger effect when there’s contrast - such as being a freehold property among leasehold options.
This is why we see several freehold projects in the area have recorded muted long-term growth, whereas leasehold developments such as 8 @ Mount Sophia and Sophia Hills have shown more consistent price growth. When most of the district’s options are freehold, other differentiators like size, facilities, and nearby amenities matter more.
One thing we did see was that larger units tend to fare better in the Sophia Road area; mostly on account of the area having so many one- or two-bedders, which can’t substitute the larger projects for family members.
The recent new launches here also have less of a knock-on effect. They introduced a subset of higher-priced compact units, without helping to raise the floor for existing resale units (the exception being, again, for larger layouts).
Sophia Road is best understood as a CCR micro-market. While there’s certainly price growth, buyers should calibrate their expectations. This is not an area where you’re likely to see outsized gains very quickly; you need to be braced for gradual increases with a longer holding period.
At Stacked, we like to look beyond the headlines and surface-level numbers, and focus on how things play out in the real world.
If you'd like to discuss how this applies to your own circumstances, you can reach out for a one-to-one consultation here.
And if you simply have a question or want to share a thought, feel free to write to us at stories@stackedhomes.com. We read every message.



0 Comments