

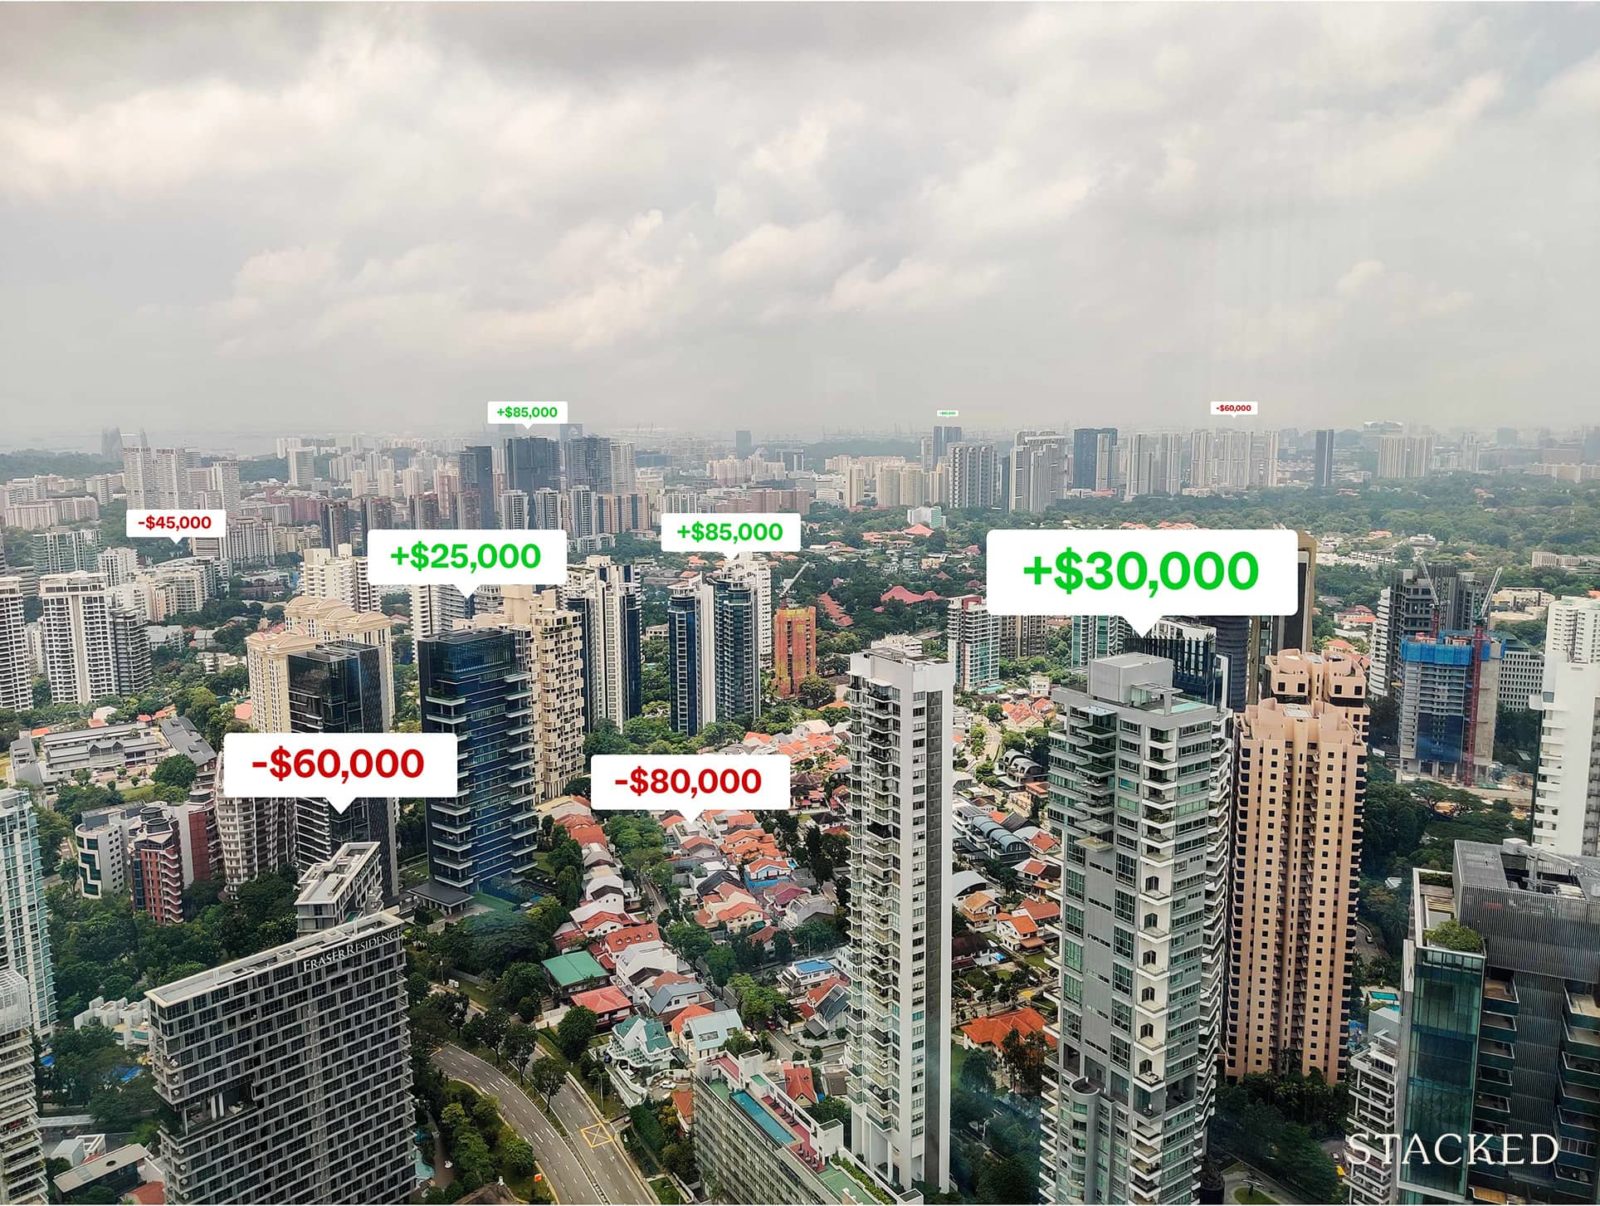
$2,900 as the average home price by 2030? Pffft. Ridiculous.
That was what everyone was certainly thinking back in 2018, when this report by DBS was in the news. At the time, a typical price point for an “average home” (a mass-market condo in the OCR) would have been around $1,500 - $1,600 psf. This report was predicting prices would more or less double on a $PSF basis, in just over a decade or so.
But here we are now in 2025, and these home prices seem far from implausible in five years. The same report predicts that “an average unit” of private property will cost between $1.9 million to $2.5 million by 2030; and as I’m writing this in October 2025, the typical price range for an HDB upgrader is $1.8 million to $2.2 million. So we’re already sort of there, in terms of quantum.
But how did it come to this point?
The challenge for many buyers today isn't access to information.
It's interpreting that information in a way that makes sense for their finances, goals, and stage of life.
Over time, that's also why we decided to work with agents who shared the same data-driven and advisory-led approach behind our editorial, consultants who could help readers think through decisions more objectively, rather than simply push transactions.
Today, the team has worked with more than 2,000 clients across over $5B in property transactions.
Let’s start with cooling measures.
I hope I don’t come off as defensive, but my disagreement was never because I thought prices couldn’t naturally reach this point. Rather, my disbelief was based on what we saw between 2013 and 2017.
At the time the report came out, the market was still recovering from a barrage of cooling measures imposed at the 2013 peak: the Additional Buyers Stamp Duty (ABSD) had just been raised, loan-to-value limits were tightened, and the Total Debt Servicing Ratio (TDSR) was introduced. Those curbs worked: the market dipped for almost four years straight, and sentiment was only just starting to turn in 2018.
Based on that precedent, it seemed that if prices ever crept near $2,900, the government would simply turn the screws again. And in fact they have, such as with higher ABSD rates. But as I noted in January this year, the cooling measures haven’t had much impact on our post-COVID prices; and so the expected intervention didn’t have the effect I thought it would. Part of the reason is that the biggest brunt of raised ABSD prices is on foreign buyers (60 per cent ABSD), who aren’t buyers of “average” mass-market homes.
We didn’t get to this price point in exactly the way that was predicted
The first obvious difference is COVID, which we couldn’t have predicted back in 2018. This black swan event, and its accompanying housing shortage, sent the property market into overdrive. Even the resale HDB market, which was in steady decline from 2013 to about 2018, suddenly saw a price surge (this does matter to the private segment, as HDB upgraders are a main driver of condo purchases).
The other difference is in what’s now the “average unit” of private property. Back in 2018, an “average unit” would have been a three-bedder reaching around 1,000 sq ft, maybe 1,400 sq ft for an older resale unit. Back then, one and two-bedders were compact units, mainly used as rental assets rather than for owner-occupancy.
But that’s rapidly changing, and it’s widely whispered that today’s two-bedders (or perhaps 2+Study units) are going to be the new “average unit.” With these units being around 600 to 650 sq ft, it does result in lower total square footage, hence making $2,900 psf a much closer target.
(As an aside, smaller units tend to have a higher $PSF and lower quantum, whilst larger units see the opposite - with the exception of penthouses.)
This is also supported by Gross Floor Area (GFA) harmonisation: today’s projects don’t count certain unlivable spaces, such as air-con ledges, into their total square footage. This has the effect of further intensifying $PSF.
As for the accuracy of the predicted quantum (average price), there’s one other quirk to consider
In 2018, the idea of the “average” unit being in District 9 or 10 would have been laughable. But from the report, the projected as well as current price range does come close to projects like Skye at Holland or River Green; these are prime region districts, and not so much the mass-market OCR properties the report probably had in mind.
But as of 2025, these are no longer exclusive to wealthy foreigners, but are more attainable to regular Singaporeans. So should they be considered “average” homes? One might argue yes, if we hold that the pace of sales demonstrates affordability.
However, a contrary view - if we want to maintain that the OCR is still the “average home” - might hold that new launches in the OCR, such as Springleaf Residences and Canberra Crescent Residences, haven’t fully caught up yet. But perhaps these too may come close to $2,900 psf, by 2030, especially if unit sizes contract further. One thing’s for sure: the price gaps between regions are narrowing, and $2,000+ psf in the OCR is not exceptional these days.
So the DBS report is turning out to be right, but not quite in the way anyone expected
Back then, $2,900 psf would have definitely indicated some kind of bubble. Today, it’s more a story of changing developer practices than of some runaway market: the high $PSF is about smaller homes, more conservative ways to measure square footage, and access to stronger locations as a trade-off. Of course, we still have a fair few years to go, and rising land prices will always be part of the equation.
In any case, this is like one of those situations where the GPS plots the wrong route, but you’re more or less at the destination anyway.
Meanwhile in other property news…
- Betting on getting a property for cheaper is always risky, especially when it involves the “waiting game” - here’s one example.
- Singapore’s creepy abandoned houses and their histories are laid bare, in our Halloween Special.
- The Sen is the latest launch in Bukit Timah, but can it make an impact, in an area filled with prestigious freehold projects? We took a closer look.
- Does age have an impact on older condos in District 11? Check out our deep dive into the neighbourhood.
Weekly Sales Roundup (20 - 26 October)
Top 5 Most Expensive New Sales (By Project)
| PROJECT NAME | PRICE S$ | AREA (SQFT) | $PSF | TENURE |
| ZYON GRAND | $10,388,000 | 2659 | $3,907 | 99 years |
| SKYE AT HOLLAND | $5,821,000 | 1765 | $3,297 | 99 yrs (2024) |
| WATTEN HOUSE | $5,090,000 | 1539 | $3,307 | FH |
| NAVA GROVE | $4,102,800 | 1550 | $2,647 | 99 yrs (2024) |
| CHUAN PARK | $4,042,000 | 1550 | $2,608 | 99 yrs (2024) |
Top 5 Cheapest New Sales (By Project)
| PROJECT NAME | PRICE S$ | AREA (SQFT) | $PSF | TENURE |
| ZYON GRAND | $1,298,000 | 474 | $2,741 | 99 years |
| ELTA | $1,398,000 | 506 | $2,763 | 99 yrs (2024) |
| PROMENADE PEAK | $1,433,600 | 527 | $2,718 | 99 yrs (2024) |
| TEMBUSU GRAND | $1,488,000 | 527 | $2,821 | 99 yrs (2022) |
| OTTO PLACE | $1,543,000 | 904 | $1,707 | 99 yrs (2024) |
Top 5 Most Expensive Resale
| PROJECT NAME | PRICE S$ | AREA (SQFT) | $PSF | TENURE |
| SEVEN PALMS SENTOSA COVE | $12,502,920 | 4607 | $2,714 | 99 yrs (2007) |
| ARDMORE PARK | $12,500,000 | 2885 | $4,333 | FH |
| GRANGE RESIDENCES | $8,500,000 | 2669 | $3,184 | FH |
| LEEDON RESIDENCE | $7,840,000 | 2508 | $3,126 | FH |
| LUSH ON HOLLAND HILL | $5,000,000 | 3488 | $1,434 | FH |
Top 5 Cheapest Resale
| PROJECT NAME | PRICE S$ | AREA (SQFT) | $PSF | TENURE |
| HIGH PARK RESIDENCES | $658,000 | 398 | $1,652 | 99 yrs (2014) |
| SILVERSCAPE | $670,000 | 409 | $1,638 | FH |
| VIVA VISTA | $670,000 | 377 | $1,778 | FH |
| PALM ISLES | $680,000 | 506 | $1,344 | 99 yrs (2011) |
| SUITES @ SHREWSBURY | $705,888 | 334 | $2,115 | FH |
Top 5 Biggest Winners
| PROJECT NAME | PRICE S$ | AREA (SQFT) | $PSF | RETURNS | HOLDING PERIOD |
| GRANGE RESIDENCES | $8,200,000 | 2583 | $3,174 | $5,316,726 | 21 Years |
| GRANGE RESIDENCES | $8,500,000 | 2669 | $3,184 | $4,800,000 | 20 Years |
| ARDMORE PARK | $12,500,000 | 2885 | $4,333 | $3,900,000 | 10 Years |
| THE ANCHORAGE | $4,100,000 | 2088 | $1,963 | $2,705,000 | 27 Years |
| LEEDON RESIDENCE | $7,840,000 | 2508 | $3,126 | $2,140,000 | 9 Years |
Top 5 Biggest Losers
| PROJECT NAME | PRICE S$ | AREA (SQFT) | $PSF | RETURNS | HOLDING PERIOD |
| THE COAST AT SENTOSA COVE | $3,250,000 | 2024 | $1,606 | -$370,000 | 13 Years |
| 3 ORCHARD BY-THE-PARK | $3,900,000 | 1163 | $3,355 | -$184,000 | 6 Years |
| REFLECTIONS AT KEPPEL BAY | $2,800,000 | 1744 | $1,606 | -$121,060 | 6 Years |
| SOPHIA HILLS | $1,080,000 | 560 | $1,930 | -$57,000 | 8 Years |
| RIVERFRONT RESIDENCES | $838,000 | 517 | $1,622 | $44,500 | 4 Years |
Top 5 Biggest Winners (ROI%)
| PROJECT NAME | PRICE S$ | AREA (SQFT) | $PSF | ROI (%) | HOLDING PERIOD |
| HILLCREST ARCADIA | $1,800,000 | 1421 | $1,267 | 283% | 21 Years |
| EVERGREEN PARK | $1,480,000 | 1346 | $1,100 | 212% | 20 Years |
| THE ANCHORAGE | $4,100,000 | 2088 | $1,963 | 194% | 27 Years |
| KING'S MANSION | $3,190,000 | 1604 | $1,989 | 190% | 29 Years |
| GRANGE RESIDENCES | $8,200,000 | 2583 | $3,174 | 184% | 21 Years |
Top 5 Biggest Losers (ROI%)
| PROJECT NAME | PRICE S$ | AREA (SQFT) | $PSF | ROI (%) | HOLDING PERIOD |
| THE COAST AT SENTOSA COVE | $3,250,000 | 2024 | $1,606 | -10% | 13 Years |
| SOPHIA HILLS | $1,080,000 | 560 | $1,930 | -5% | 8 Years |
| 3 ORCHARD BY-THE-PARK | $3,900,000 | 1163 | $3,355 | -5% | 6 Years |
| REFLECTIONS AT KEPPEL BAY | $2,800,000 | 1744 | $1,606 | -4% | 6 Years |
| ONE PEARL BANK | $1,820,000 | 743 | $2,450 | 4% | 6 Years |
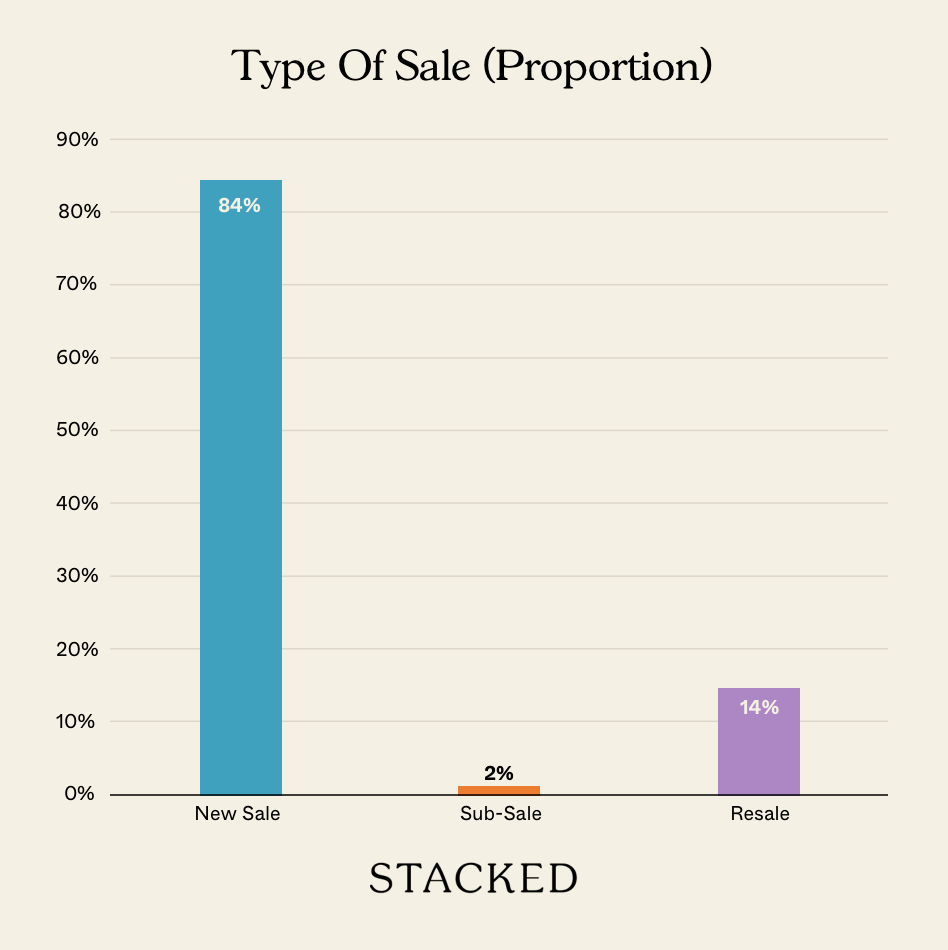
Transaction Breakdown
Follow us on Stacked for more ongoing news in the Singapore property market
At Stacked, we like to look beyond the headlines and surface-level numbers, and focus on how things play out in the real world.
If you'd like to discuss how this applies to your own circumstances, you can reach out for a one-to-one consultation here.
And if you simply have a question or want to share a thought, feel free to write to us at stories@stackedhomes.com. We read every message.



0 Comments