


Freehold condominiums are often considered legacy homes and price-resilient assets, given their tenure and desirability. As a result, properties with freehold tenure tend to get touted as ‘safe’ real estate and tend to be the property of choice for many Singaporean homeowners and investors.
It just seems intuitive that without the limit of a 99-year leasehold and a scarce supply of new freehold projects, these types of condos will never ‘underperform’. In reality, real estate gets much more complicated.
Transaction data often shows us that property prices are not dependent on lease status alone. A whole host of other factors, from location to the condition of the unit to unique buyer or seller motivations, can weigh much more than the freehold tenure.
Our recent deep dive into the profitability and capital growth of condos that transacted units in 2025 revealed this, and reiterated that even freehold properties can underperform - sometimes by a significant margin.
Here are some such freehold projects which struggled to make significant positive gains despite their tenure, based on data compiled by Stacked.
The challenge for many buyers today isn't access to information.
It's interpreting that information in a way that makes sense for their finances, goals, and stage of life.
Over time, that's also why we decided to work with agents who shared the same data-driven and advisory-led approach behind our editorial, consultants who could help readers think through decisions more objectively, rather than simply push transactions.
Today, the team has worked with more than 2,000 clients across over $5B in property transactions.
Ten freehold condos with the weakest price gains in 2025
We focused on freehold and 999-year leasehold units purchased from 2014 onwards, and sold in 2025.
We will also limit our analysis to projects with at least five resale transactions recorded in 2025. This is to prevent possible distortions, such as one or two outlier sales, which wouldn’t be representative of the wider project.
| Project | Average returns | No. of units sold |
| 26 NEWTON | -7.99% | 9 |
| ROBIN RESIDENCES | 0.01% | 5 |
| 8 SAINT THOMAS | 1.95% | 6 |
| ROBIN SUITES | 2.33% | 8 |
| THE ORIENT | 2.44% | 7 |
| RV ALTITUDE | 3.26% | 5 |
| ROYALGREEN | 3.86% | 7 |
| STARLIGHT SUITES | 5.87% | 5 |
| # 1 SUITES | 6.16% | 5 |
| THE AVENIR | 6.85% | 14 |
For context, the average return for 999-year / freehold condos bought in 2014 and transacted in 2025 was around 26%. As such, all 10 condos in our list above significantly underperformed in terms of percentage gain. Some cases, however, stand out more starkly than others. 26 Newton was the worst performer, and the only freehold condo to show a negative average return.
Let’s take a closer look at what the worst underperformers had in common
| Project | District | Completion year |
| 26 NEWTON | 11 | 2016 |
| ROBIN RESIDENCES | 10 | 2015 |
| 8 SAINT THOMAS | 9 | 2018 |
| ROBIN SUITES | 10 | 2016 |
| THE ORIENT | 5 | 2017 |
| RV ALTITUDE | 9 | 2023 |
| ROYALGREEN | 10 | 2021 |
| STARLIGHT SUITES | 9 | 2014 |
| # 1 SUITES | 14 | 2016 |
| THE AVENIR | 9 | 2024 |
One common thread is that most of these projects sit within the Core Central Region (CCR) or Rest of Central Region (RCR). This impacts the properties in two ways:
First, there are more freehold properties in the CCR than there are in other regions. For instance, in prime districts like D9 and D10, freehold properties typically make up the majority of private homes. In these areas, being freehold isn’t really an outstanding quality - it’s just the norm. The comparison isn’t as attractive as a freehold property in areas that predominantly comprise 99-year leasehold condos, such as we might see in parts of the RCR or the Outside of Central Region (OCR).
Second, condos in the CCR and RCR are among the priciest homes in Singapore’s private residential market. This means less room for appreciation, and weaker percentage gains are somewhat expected.
Another notable similarity lies in the periods these projects were completed.
Most projects on our list were sold two to three years before the developments were completed. As such, many of these projects launched sometime around 2014 to 2017 when sentiment in the property market was relatively weaker.
This is because there was a sharp rise in property prices from late 2008 to 2013, which spurred the government to implement a series of property cooling measures, such as an increase in the additional buyer's stamp duty and lowering loan-to-value ratios.
The property market reached another high in 2018, and the government stepped in again to cool the market. The market has been moving up since the end of the Covid-19 pandemic in 2022. Royalgreen and The Avenir are unusual in this regard, as their performance was weak despite being in time to catch the post-pandemic upswing.
Let’s look at the year-by-year average transacted $PSF for each project, based on resale transactions.
| Year | STARLIGHT SUITES | 26 NEWTON | # 1 SUITES | ROBIN SUITES | ROBIN RESIDENCES | THE ORIENT | 8 SAINT THOMAS | ROYALGREEN | RV ALTITUDE | THE AVENIR |
| 2010 | $2,070 | |||||||||
| 2011 | $2,180 | |||||||||
| 2012 | $2,187 | $2,403 | ||||||||
| 2013 | $2,264 | $2,500 | $1,260 | $2,475 | ||||||
| 2014 | - | $2,557 | $1,134 | $2,572 | $2,335 | $1,962 | ||||
| 2015 | $2,155 | $2,416 | $1,161 | $2,419 | $2,386 | $1,970 | ||||
| 2016 | $1,984 | $2,271 | $985 | $2,064 | $2,375 | $1,803 | ||||
| 2017 | $1,953 | $2,454 | $1,027 | $1,459 | $2,366 | $1,834 | ||||
| 2018 | $2,067 | $2,591 | $1,134 | $2,593 | $2,493 | $1,835 | $3,220 | |||
| 2019 | $1,926 | $2,265 | - | $2,438 | $2,540 | - | $3,159 | $2,743 | $2,941 | |
| 2020 | $1,921 | $2,307 | $1,043 | $2,351 | - | - | $2,842 | $2,693 | $2,933 | $3,149 |
| 2021 | $1,915 | $2,284 | $1,124 | $2,348 | $2,495 | - | $2,715 | $2,711 | $2,700 | $3,146 |
| 2022 | $1,931 | $2,122 | $1,144 | $2,326 | $2,317 | - | - | $2,840 | - | $3,209 |
| 2023 | $1,975 | $2,240 | $1,233 | $2,304 | $2,413 | $1,844 | $3,134 | $2,755 | - | $3,147 |
| 2024 | $2,172 | $2,237 | $1,254 | $2,237 | $2,437 | $1,922 | $2,832 | $2,751 | $2,877 | $3,356 |
| 2025 | $2,089 | $2,208 | $1,239 | $2,276 | $2,370 | $1,873 | $2,983 | $2,827 | $2,797 | $3,450 |
| Annualised | 0.06% | -0.65% | -0.14% | -0.70% | 0.13% | -0.42% | -1.09% | 0.51% | -0.83% | 1.84% |
The freehold projects on our list appear to record uneven price movements. Based on transaction data, we noticed short-lived spikes, followed by long stretches of stagnating prices.
Most of them, however, saw their strongest gains in the early 2010s due to the strong pick-up in the private residential market following the Global Financial Crisis. During this period, there were strong expectations of long-term gains for freehold properties, particularly those in prestigious CCR locations.
Although this caused some sellers to price in the expected gains aggressively, they were still able to find willing buyers at the time.
By 2025, we see that several of these projects recorded flat or negative annualised returns. This may not be due to inherent problems in the projects, but simply because the earlier high pricing and price surges left less room for further gains.
Let’s take a look at the bottom three performers to see what we can learn
26 Newton
| Type of sale | Average gains | Average gains (quantum) | Average holding period (years) | No. of units sold |
| New Sale to Resale | -3.30% | -$53,861 | 8.7 | 2 |
| Resale to Resale | -9.33% | -$115,961 | 7.1 | 7 |
| Address | Purchase price | Sale price | Size (sqft) | No. of bedrooms | Purchase Date | Sale Date | Gain/loss quantum | % gain/loss | Gain/loss | Type of sale | Holding period (years) |
| 26 NEWTON ROAD #20-08 | $1,213,000 | $988,000 | 474 | 1 | 29/8/17 | 29/9/25 | -$225,000 | -18.55% | Loss | Resale to resale | 8.1 |
| 26 NEWTON ROAD #23-09 | $1,249,498 | $1,050,000 | 474 | 1 | 30/8/17 | 18/11/25 | -$199,498 | -15.97% | Loss | Resale to resale | 8.2 |
| 26 NEWTON ROAD #16-09 | $1,208,048 | $1,050,000 | 474 | 1 | 21/7/17 | 06/04/2025 | -$158,048 | -13.08% | Loss | Resale to resale | 7.9 |
| 26 NEWTON ROAD #19-05 | $1,453,300 | $1,295,000 | 560 | 2 | 22/6/17 | 15/10/25 | -$158,300 | -10.89% | Loss | Resale to resale | 8.3 |
| 26 NEWTON ROAD #15-05 | $1,396,000 | $1,250,000 | 560 | 2 | 29/3/16 | 16/5/25 | -$146,000 | -10.46% | Loss | New sale to resale | 9.1 |
| 26 NEWTON ROAD #10-01 | $1,100,883 | $990,000 | 474 | 1 | 20/3/17 | 25/3/25 | -$110,883 | -10.07% | Loss | Resale to resale | 8.0 |
| 26 NEWTON ROAD #16-02 | $1,800,000 | $1,800,000 | 775 | 2 | 4/5/21 | 25/3/25 | $0 | 0% | Breakeven | Resale to resale | 3.9 |
| 26 NEWTON ROAD #18-05 | $1,240,000 | $1,280,000 | 560 | 2 | 31/8/20 | 30/9/25 | $40,000 | 3.23% | Gain | Resale to resale | 5.1 |
| 26 NEWTON ROAD #08-09 | $991,721 | $1,030,000 | 474 | 1 | 27/10/16 | 14/2/25 | $38,279 | 3.86% | Gain | New sale to resale | 8.3 |
To uncover the under-performing resale performance, we’ll look at resale transactions completed in 2025 where the units were originally purchased from 2014 onwards. In total, there were nine of these transactions. Among these caveats, six were sold at a loss, one broke even, and only two were profitable.
What’s notable is the size of the losses, which were significantly higher than the gains of the profitable sales. This indicates a rather small upside in the face of five to six-figure losses.
Resale-to-resale transactions are, unsurprisingly, even worse compared to developer sale units changing hands on the resale market. This is because properties are generally cheaper when bought early from a developer; this would have helped mitigate some of the losses.
We also noticed that the average loss for resale-to-resale transactions often stretched beyond seven years. While resale-to-resale is generally less profitable, it’s still unusual to see losses after a seven-plus year holding period.
We also checked to see if it was an issue of timing, and found something unexpected.
Many of the unprofitable units were purchased around 2016 and 2017, then sold eight to nine years later at prices below their original purchase levels. This is counterintuitive, as 2016 and 2017 were the tail end of a weak property market, and we would expect that buyers at the time were entering at a lower price.
But here, we see that a combination of buying in a weak market, plus a reasonable eight to nine-year holding period, still didn’t prevent losses.
An additional likely cause is the unit count and the unit mix.
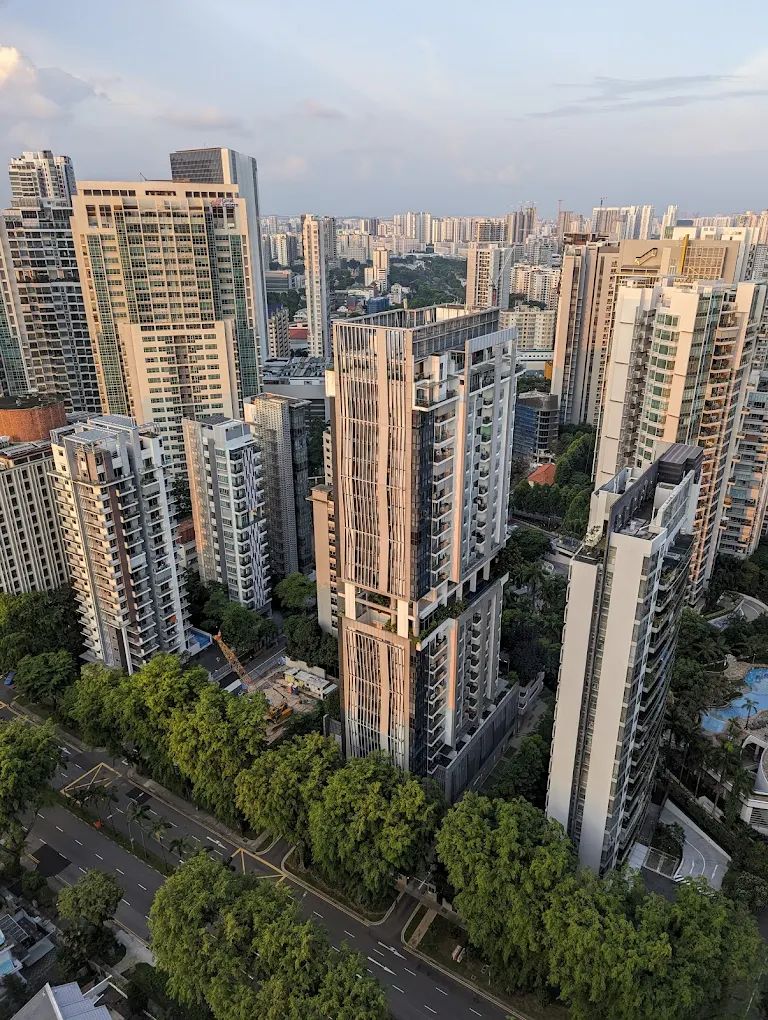
Located on Newton Road in the CCR, 26 Newton is a boutique freehold development with 180 units with a mix of one- and two-bedroom units.
This unit mix is not ideal since it limits the development’s overall appeal to families and long-term owner-occupiers, and this shrinks the buyer pool to mainly investors.
As a result, owners may be less emotionally attached to the property and more willing to exit when better opportunities present themselves elsewhere. Over time, this creates greater sensitivity to wider market fluctuations.
The low unit count exacerbates this situation. When fewer units are transacting, any unusually low transaction “anchors” the price lower in the minds of prospective buyers, and the average price is skewed much lower.
As such, despite its central location, this project left some sellers worse off than when they entered.
Here’s a caveat to consider.
Note that what we’re seeing here are resale gains, without factoring in rental income. It’slikely that 26 Newton benefits from a strong tenant demand due to its central location, and accumulated rental income over a long period could compensate for the weaker capital gains.
It’s also fair to point out that, given the unit mix of one- to two-bedders, 26 Newton is a project aimed at buyers who value sustained rental income over potentially higher resale gains. In that sense, evaluating it by price appreciation may not be “showing its best side,” so to speak.
Robin Residences
| Type of sale | Average gains | Average gains (quantum) | Average holding period (years) | No. of units sold |
| New Sale to Resale | 0.01% | -$10,200 | 10.1 | 5 |
| Address | Purchase price | Sale price | Size (sqft) | No. of bedrooms | Purchase Date | Sale Date | Gain/loss quantum | % gain/loss | Gain/loss | Type of sale | Holding period (years) |
| 3 ROBIN DRIVE #03-09 | $2,004,000 | $1,865,000 | 829 | 2 | 21/10/14 | 14/2/25 | -$139,000 | -6.94% | Loss | New sale to resale | 10.3 |
| 7 ROBIN DRIVE #04-18 | $1,292,000 | $1,250,000 | 538 | 2 | 7/8/15 | 10/9/25 | -$42,000 | -3.25% | Loss | New sale to resale | 10.1 |
| 7 ROBIN DRIVE #01-17 | $1,320,000 | $1,320,000 | 570 | 2 | 14/10/15 | 7/5/25 | $0 | 0% | Breakeven | New sale to resale | 9.6 |
| 1 ROBIN DRIVE #02-04 | $1,270,000 | $1,290,000 | 538 | 2 | 31/10/14 | 27/5/25 | $20,000 | 1.57% | Gain | New sale to resale | 10.6 |
| 7 ROBIN DRIVE #05-16 | $1,270,000 | $1,380,000 | 538 | 2 | 27/12/15 | 29/10/25 | $110,000 | 8.66% | Gain | New sale to resale | 9.8 |
Moving on to Robin Residences, a 134-unit project on Robin Drive in prime District 10. The condo recorded five resale transactions - likewise, units bought in 2014 and sold in 2025.
All five transactions were new-to-resale. Of these transactions, two were sold at a loss, two were sold at a gain, and one broke even. Overall, the price movement has remained nearly flat despite a holding period of over 10 years.
Again, we see that loss-making transactions tended to involve bigger downsides, compared to the gains of the profitable transactions.
Timing plays a key role here. Robin Residences was launched in 2014, shortly after the 2013 cooling measures. This was during a period when the market had already softened, and buyer expectations were more subdued. Robin Residences entered the market at a time when price growth was already constrained, and the subsequent years would see further cooling measures imposed.
We also see a similar issue as 26 Newton: Robin Residences is a freehold boutique development in the CCR, with only 134 units. While it has a more balanced unit mix ranging from one- to six- bedrooms, two-bedders are the most predominant unit type. So once again, there’s limited appeal to families and owner-occupiers.
The circumstances of this project are a pity because this project is within one kilometre of Anglo-Chinese School (Primary) and Singapore Chinese Girls’ Primary School. We can only wonder If Robin Residences had more three-bedders, its resale performance outcome may be very different.
As is, Robin Residences avoids the same degree of losses as 26 Newton, but it has seen almost a decade go by with little or no price growth.
8 Saint Thomas
| Type of sale | Average gains | Average gains (quantum) | Average holding period (years) | No. of units sold |
| Resale to Resale | 1.95% | $64,515 | 5.4 | 6 |
| Address | Purchase price | Sale price | Size (sqft) | No. of bedrooms | Purchase Date | Sale Date | Gain/loss quantum | % gain/loss | Gain/loss | Type of sale | Holding period (years) |
| 10 ST. THOMAS WALK #16-05 | $2,627,000 | $2,490,000 | 872 | 2 | 3/5/19 | 26/12/25 | -$137,000 | -5.22% | Loss | Resale to Resale | 6.7 |
| 10 ST. THOMAS WALK #24-07 | $4,128,000 | $3,980,000 | 1302 | 3 | 7/2/19 | 13/3/25 | -$148,000 | -3.59% | Loss | Resale to Resale | 6.1 |
| 10 ST. THOMAS WALK #06-08 | $2,572,000 | $2,480,000 | 807 | 2 | 8/2/19 | 18/8/25 | -$92,000 | -3.58% | Loss | Resale to Resale | 6.5 |
| 8 ST. THOMAS WALK #21-01 | $2,705,000 | $2,813,888 | 1044 | 2 | 13/1/21 | 22/7/25 | $108,888 | 4.03% | Gain | Resale to Resale | 4.5 |
| 10 ST. THOMAS WALK #34-06 | $2,550,000 | $2,700,000 | 872 | 2 | 7/4/21 | 2/5/25 | $150,000 | 5.88% | Gain | Resale to Resale | 4.1 |
| 10 ST. THOMAS WALK #08-07 | $3,562,800 | $4,068,000 | 1302 | 3 | 10/2/21 | 26/9/25 | $505,200 | 14.18% | Gain | Resale to Resale | 4.6 |
Of the six transactions recorded in this condo in 2025, three were unprofitable, while three were profitable. All six were resale-to-resale transactions.
The recurring issue here is timing. All three loss-making units were purchased in 2019, whereas all three profitable transactions involved units bought in 2021. This is likely due to a mismatch in new private housing supply after the Covid-19 pandemic, which boosted price growth and helped buyers in 2021 rake in stronger gains.
Located on St Thomas Walk, 8 St Thomas is a luxury development with 250 units. While it has a more balanced mix of one- to four-bedders, the two-bedders make up the majority.
As a luxury condo, this project is more lifestyle-driven compared to 26 Newton or Robin Residences, but our analysis concludes that the emphasis on relatively compact units limits the catchment of potential family buyers.
Coupled with the limited number of transactions, 8 St Thomas falls to the bottom tier of freehold performers in 2025. It does, however, at least manage to record a modest average gain.
Summary
To close this off, let’s look at price movements across the three regions (the CCR, RCR, and OCR) to provide an understanding of why the CCR seems to have so many weaker performing freehold condos.
| Year | CCR | RCR | OCR |
| 2014 | $1,942 | $1,401 | $1,069 |
| 2015 | $1,815 | $1,378 | $1,015 |
| 2016 | $1,942 | $1,380 | $1,008 |
| 2017 | $1,906 | $1,453 | $1,053 |
| 2018 | $2,100 | $1,586 | $1,136 |
| 2019 | $2,242 | $1,714 | $1,219 |
| 2020 | $2,130 | $1,670 | $1,221 |
| 2021 | $2,271 | $1,796 | $1,251 |
| 2022 | $2,359 | $2,035 | $1,382 |
| 2023 | $2,352 | $2,220 | $1,523 |
| 2024 | $2,320 | $2,157 | $1,654 |
| 2025 | $2,620 | $2,357 | $1,769 |
| Annualised | 2.76% | 4.84% | 4.69% |
From 2014 to 2025, the CCR recorded the lowest annualised growth among the three regions, trailing both the RCR and OCR. While the quantum (absolute price) in the CCR remained the highest, percentage gains were weaker, as the initial price was already high. This dragged on average returns in the CCR.
Freehold tenure may also have influenced buyer behaviour.
Buyers who choose freehold typically do so with longer holding periods in mind. They see freehold as a form of long-term value preservation, rather than quick gains. This also limits transaction activity and slows price discovery in the market.
Finally, all three projects examined are relatively small or boutique developments. Lower transaction volumes mean greater volatility; any single transaction can skew prices upward or downward more dramatically, compared to larger projects, which are supported by more transactions. For these small projects, performance is more sensitive to entry timing and unit-specific factors.
Taken together, these explain why these freehold CCR projects underperformed in 2025. This also demonstrates that when it comes to pricing, freehold is just one variable among many, and it may not be as significant as other pressures like wider market movements, unit mix, or even buyer perceptions based on price history.
At Stacked, we like to look beyond the headlines and surface-level numbers, and focus on how things play out in the real world.
If you'd like to discuss how this applies to your own circumstances, you can reach out for a one-to-one consultation here.
And if you simply have a question or want to share a thought, feel free to write to us at stories@stackedhomes.com. We read every message.



0 Comments