

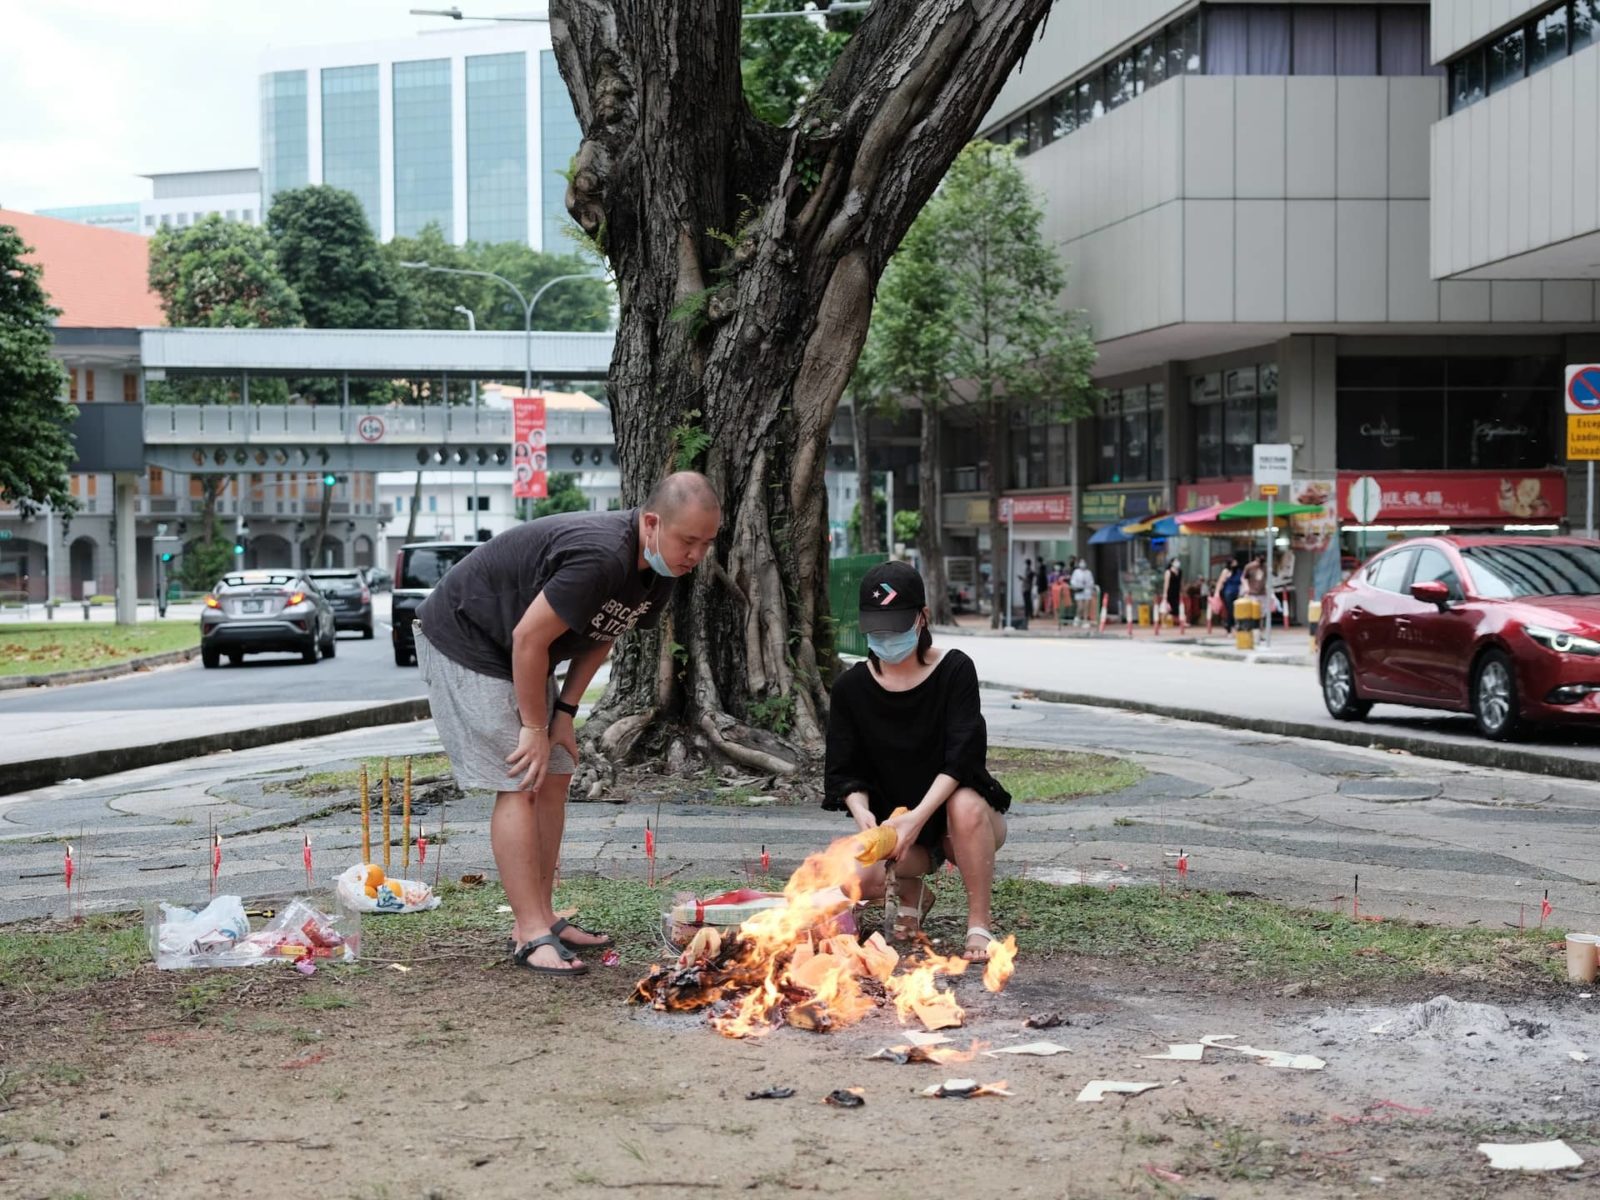
As we enter into the Ghost Festival (7th month of the lunar calendar from August and usually lasts for a month till September), there will be just one question that buyers will be asking:
Does buying a property during the Hungry Ghost month have any effect on its future profitability?
In our previous article, we examined the effects of the profitability of houses when they were sold during the Ghost Festival. We found that there were no significant economic differences between houses sold during the Ghost Festival, and those sold outside those months.
With the property market showing no signs of slowing down, could we continue seeing the bullish trend continuing in this current Hungry Ghost month? This time, let’s look at the buying side instead so that aspiring homeowners like yourself can make an informed decision on whether to enter the market during this period instead of shying away due to superstitious beliefs.
The challenge for many buyers today isn't access to information.
It's interpreting that information in a way that makes sense for their finances, goals, and stage of life.
Over time, that's also why we decided to work with agents who shared the same data-driven and advisory-led approach behind our editorial, consultants who could help readers think through decisions more objectively, rather than simply push transactions.
Today, the team has worked with more than 2,000 clients across over $5B in property transactions.
Notes on this Study
Before we present our findings, we wish to highlight a few caveats/points in our dataset, which are similar to our previous article on Chinese numerological superstition on property prices, except for the last point on data categorisation:
- As the sale and resale of public flats are closely regulated by the Housing and Development Board (e.g. subject to Ethnic Integration Policy and SPR quota, restriction of foreign ownership), we have focused this study on private property transactions from the last 26 years, where preferences for property purchases outside before or after the Ghost Festival are more likely to be fully revealed, since there are fewer restrictions.
- Our dataset does not include personal details like age, race, nationality, and education level of property purchasers, which prevent us from drawing a more meaningful correlation between certain variables and propensity to be superstitious (e.g. non-Chinese may be less concerned with purchasing properties during the Ghost Festival).
- Two categories of houses were used for this study as shown below:
- GF_Months – refers to transactions that took place during the Ghost Festival; and
- Non-GF_Months – refers to transactions that took place outside of the Ghost Festival.
Key findings
We gathered some key findings based on the insights we gleaned from the data and have summarised them as follows:
- Houses bought during the Ghost Festival months and sold subsequently did not differ much in terms of profits, as compared to those that were bought during the non-Ghost Festival months.
- The gains recorded during the Ghost Festival months are largely on par with those transacted during the non-Ghost Festival months.
- There is no strong evidence to suggest that developments with “auspicious” names provide higher returns (e.g., Laguna 88) during non-Ghost Festival months.
- Houses sold during the Ghost Festival months are comparable with those sold in non-Ghost Festival months across most types of transactions (e.g., sub sales, resales).
3A) Profit of Houses bought during the Ghost Festival months and sold later are on par with houses bought outside of the Ghost Festival months
In our previous study, we found out that houses sold during the Ghost Festival months recorded marginally better gains across all regions, than those sold during the non-Ghost Festival months.
In this study, however, there was a slight reversal of the trend. This time, the profitability for houses bought during the Ghost Festival months and sold later are on par or slightly lower than those bought during the Ghost Festival months (please see Tables 1 and 2 below). This suggests that houses bought outside of the Ghost Festival months and sold later do not have a distinct economic advantage over those bought during the Ghost Festival months.
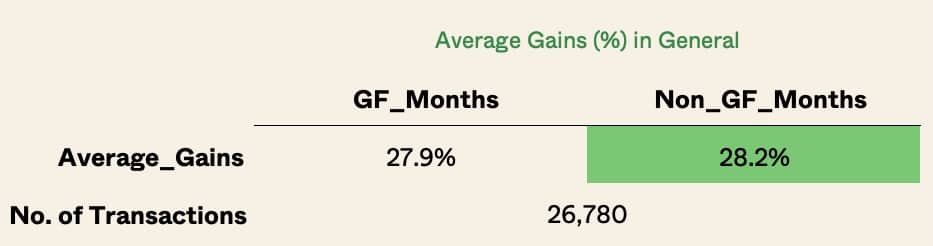
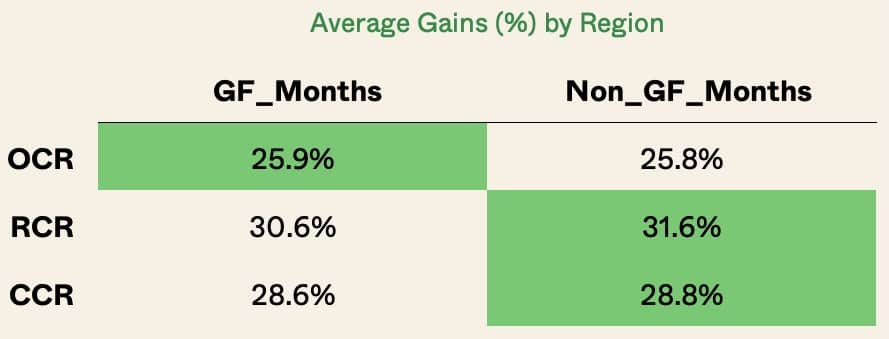
Since there are no distinct economic differences between both periods, it’s safe to say that this superstition does not bear any impact on how much you can make or lose from your property purchase. But whether the “bad luck” comes in other forms is of course, out of our scope and jurisdiction.
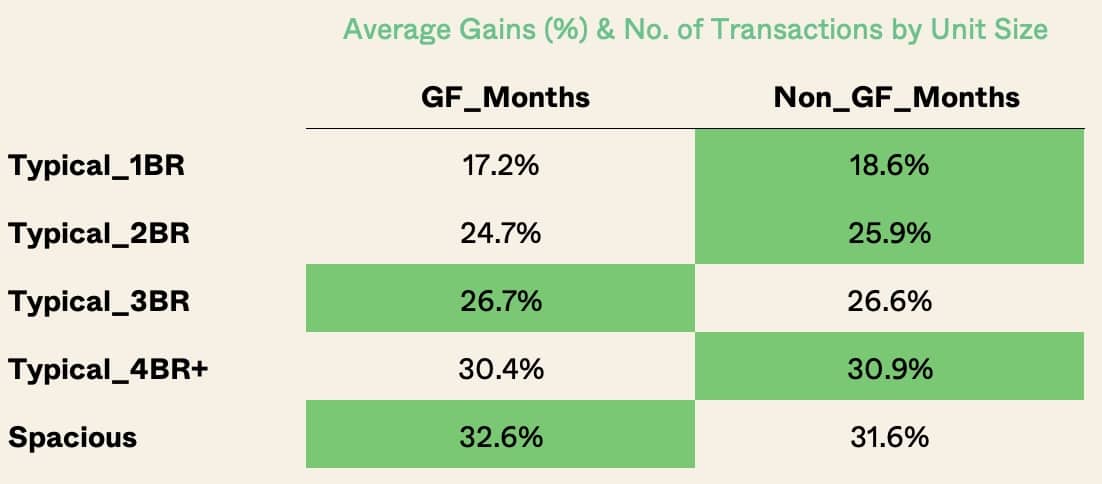
3B) Difference in gains for all house sizes was subtle for those bought during and outside Ghost Festival months
In our previous study, we shared that higher average profits were clocked during the Ghost Festival months for all house sizes, although the difference was subtle at about 1%.
The same trend was observed for this study, where we saw a mild difference in average gains between houses bought during and outside Ghost Festival months and sold later. Noticeably, the gains for larger units (i.e., > 3-bedders and above) bought during the Ghost Festival months fared better/or are on par with houses bought outside the Ghost Festival months (please see Table 3 below), which again reinforces the fact that superstition has a negligible economic impact on the profitability of houses.
3C) No strong proof that units in developments with “auspicious” names provide higher returns regardless of the period of purchase
In line with our previous study, there was no clear advantage for sellers of houses in buildings with auspicious names during the non-Ghost Festival months over those in the Ghost Festival months. Likewise, the same observation was seen in this study, which reinforces the fact that building names are not instrumental in influencing buyers’ decisions in purchasing a home during Ghost Festival or non-Ghost Festival months (please see Table 4 below).
| PROJECTS | GF_Months | Non_GF_Months |
| ANDERSON 18 | -9.2% | 4.2% |
| SCOTTS 28 | 19.6% | 43.4% |
| 8 NAPIER | N.A. | N.A. |
| BISHAN 8 | 27.0% | 20.5% |
| SPOTTISWOODE 18 | -9.1% | -21.4% |
| 8 @ MOUNT SOPHIA | 13.0% | 23.5% |
| BALMORAL 8 | 27.4% | 21.4% |
| 18 SHELFORD | -12.5% | 29.0% |
| THOMSON 800 | 39.9% | 26.5% |
| UBER 388 | 6.0% | -8.0% |
| 28 SHELFORD | 53.8% | 47.7% |
| 8 BASSEIN | -5.0% | -10.5% |
| 8 SAINT THOMAS | 2.2% | 33.3% |
| BUCKLEY 18 | N.A. | N.A. |
| BUTTERWORTH 8 | 36.4% | 23.1% |
| WOODSVILLE 28 | 28.2% | 0.8% |
| 8 RAJA | N.A. | N.A. |
| 18 WOODSVILLE | N.A. | N.A. |
| GILSTEAD 38 | 33.7% | -8.2% |
| LAGUNA 88 | 33.5% | 6.4% |
| KOVAN 81 | -5.3% | 29.5% |
| CUBE 8 | 8.6% | -17.2% |
| 8 RODYK | 29.1% | 17.0% |
| STUDIO8 | N.A. | N.A. |
| 38 I SUITES | -3.3% | 6.4% |
| KILLINEY 118 | -16.0% | 0.9% |
| RIVERSIDE 48 | 26.1% | 5.3% |
| 8@WOODLEIGH | 31.7% | 9.9% |
| JANSEN 28 | 45.2% | 14.2% |
| MARTIN NO 38 | 16.3% | 24.1% |
| APARTMENT 8 | 35.0% | 95.8% |
| RANGOON 88 | N.A. | N.A. |
| MARTIA 8 | 6.3% | -0.9% |
| HILLVIEW 128 | 28.7% | 6.3% |
| OVADA 8 | 24.4% | 7.3% |
| GRANDEUR 8 | 35.2% | 11.4% |
| 8M RESIDENCES | -0.9% | -23.8% |
| SOPHIA 98 | 44.7% | 4.9% |
| WILKIE 80 | 2.5% | -21.7% |
| AURA 83 | 13.5% | -14.8% |
| SANCTUARY @ 813 | N.A. | N.A. |
| WILKIE 48 | 59.4% | -6.3% |
| 8 EDEN GROVE | N.A. | N.A. |
| 183 LONGHAUS | N.A. | N.A. |
| JUPITER 18 | -6.5% | 16.1% |
| NOVA 48 | N.A. | N.A. |
| VUE 8 RESIDENCE | 9.3% | 3.1% |
| NEWTON 18 | 24.3% | 11.9% |
| 368 THOMSON | 11.1% | -4.4% |
| 28 IMPERIAL RESIDENCES | -2.3% | 22.7% |
| MACKENZIE 88 | 7.3% | 11.0% |
| GALLERY 8 | 34.8% | 26.7% |
| SOHO 188 | 26.8% | 6.5% |
| 8 FARRER SUITES | -5.8% | 0.5% |
| MACKENZIE 138 | 33.4% | -1.1% |
| RESIDENCES AT 338A | 82.5% | 63.0% |
| 28 RC SUITES | -8.3% | 51.8% |
| MANSIONS 28 | 20.0% | 4.2% |
| 448@EAST COAST | N.A. | N.A. |
| 283 STUDIO | N.A. | N.A. |
| WILKIE 87 | 27.6% | 20.7% |
| NOVA 88 | 17.1% | -11.0% |
| MERIDIAN 38 | N.A. | N.A. |
| 833 M B RESIDENCES | N.A. | N.A. |
| SUITES 28 | 4.3% | -2.3% |
| RACE COURSE 138 | 51.9% | 21.4% |
| ARTHUR 118 | 34.2% | 10.3% |
| BALESTIER 288 | 18.0% | 25.7% |
| RESIDENCES 88 | N.A. | N.A. |
| HILBRE28 | N.A. | N.A. |
| RIVIERA 38 | N.A. | N.A. |
| 38 JERVOIS | N.A. | N.A. |
| TWO8ONE STUDIO | N.A. | N.A. |
| RESIDENCE 118 | N.A. | N.A. |
| EAST VIEW 18 | 17.7% | 84.2% |
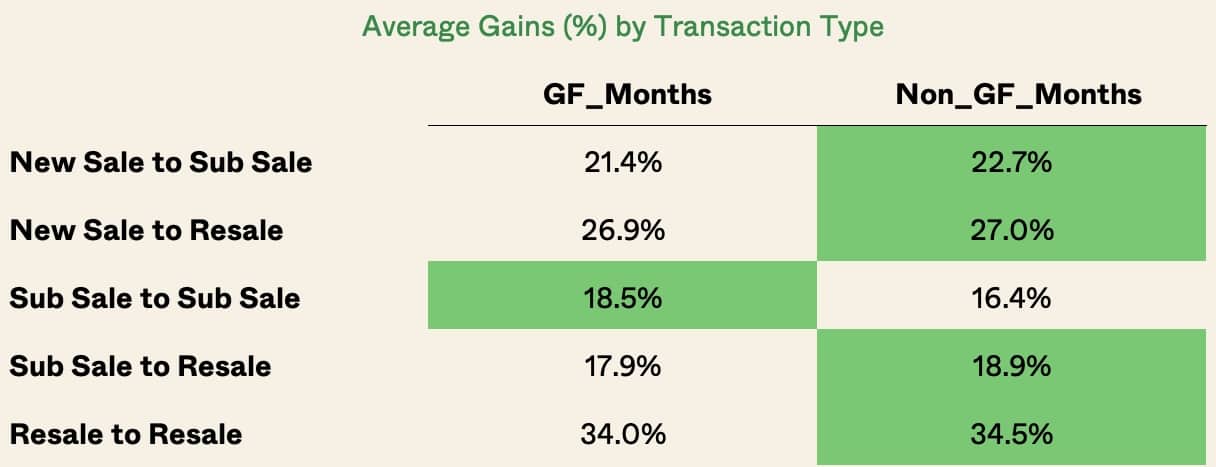
3D) Profits of houses bought during Ghost Festival months are comparable with those bought outside of Ghost Festival months across all transaction types
The similarity in average gains for houses bought during and outside of Ghost Festival months was also observed across transaction types. While there was a more distinct edge for some types of transactions (e.g., houses bought during non-Ghost Festival months registering higher average gains for “New Sale to Sub Sale”) there is inconclusive evidence to suggest the reasons that led to this trend. Especially since sub sales only take place within a short window period (i.e., between TOP and legal completion) where only a handful of transactions will take place. For us, the economic differences are not impactful enough to warrant any further analysis.
Conclusion
This study further strengthens our previous findings that while superstition is prevalent in Singapore, it has little bearing in affecting the sentiment and profitability of houses that were bought during the Ghost Festival period. With the deluge of real estate-related information online and the continued transparency of data, home buyers and sellers are increasingly becoming more informed and are unlikely to be deterred by superstition when making a big-ticket purchase.
However, we do see a rise in popularity of pseudo-science such as geomancy aka “feng shui” (e.g., Circle 96), which real estate has been frequently associated with for centuries. Thus, we may see a trend where people marry data and feng shui analyses to assist them with their housing decisions, which may have an impact on house prices. However, this is a topic for another day.
For now, rest assured that buying a house during the Ghost Festival months will unlikely result in subpar profits/losses. The most important thing is to do your due diligence, which we have shared previously. As always, feel free to reach out to us if you ever need a second opinion and we will be glad to assist you.
At Stacked, we like to look beyond the headlines and surface-level numbers, and focus on how things play out in the real world.
If you'd like to discuss how this applies to your own circumstances, you can reach out for a one-to-one consultation here.
And if you simply have a question or want to share a thought, feel free to write to us at stories@stackedhomes.com. We read every message.





1 Comments
keren banget thanks