

The price gap between flats and condos is important for several reasons - for upgraders, it shows the likelihood of being able to afford the leap into the private market. For pure homeowners, it also has relevance; given a comparison of benefits, one might conclude that some resale flats - even million-dollar ones - may still be a worthwhile purchase compared to condos. And perhaps in a wider sense, it gives us a snapshot of how our property market has changed in very significant ways, over the past decade:
The challenge for many buyers today isn't access to information.
It's interpreting that information in a way that makes sense for their finances, goals, and stage of life.
Over time, that's also why we decided to work with agents who shared the same data-driven and advisory-led approach behind our editorial, consultants who could help readers think through decisions more objectively, rather than simply push transactions.
Today, the team has worked with more than 2,000 clients across over $5B in property transactions.
The price gap between flats and condos over the past decade
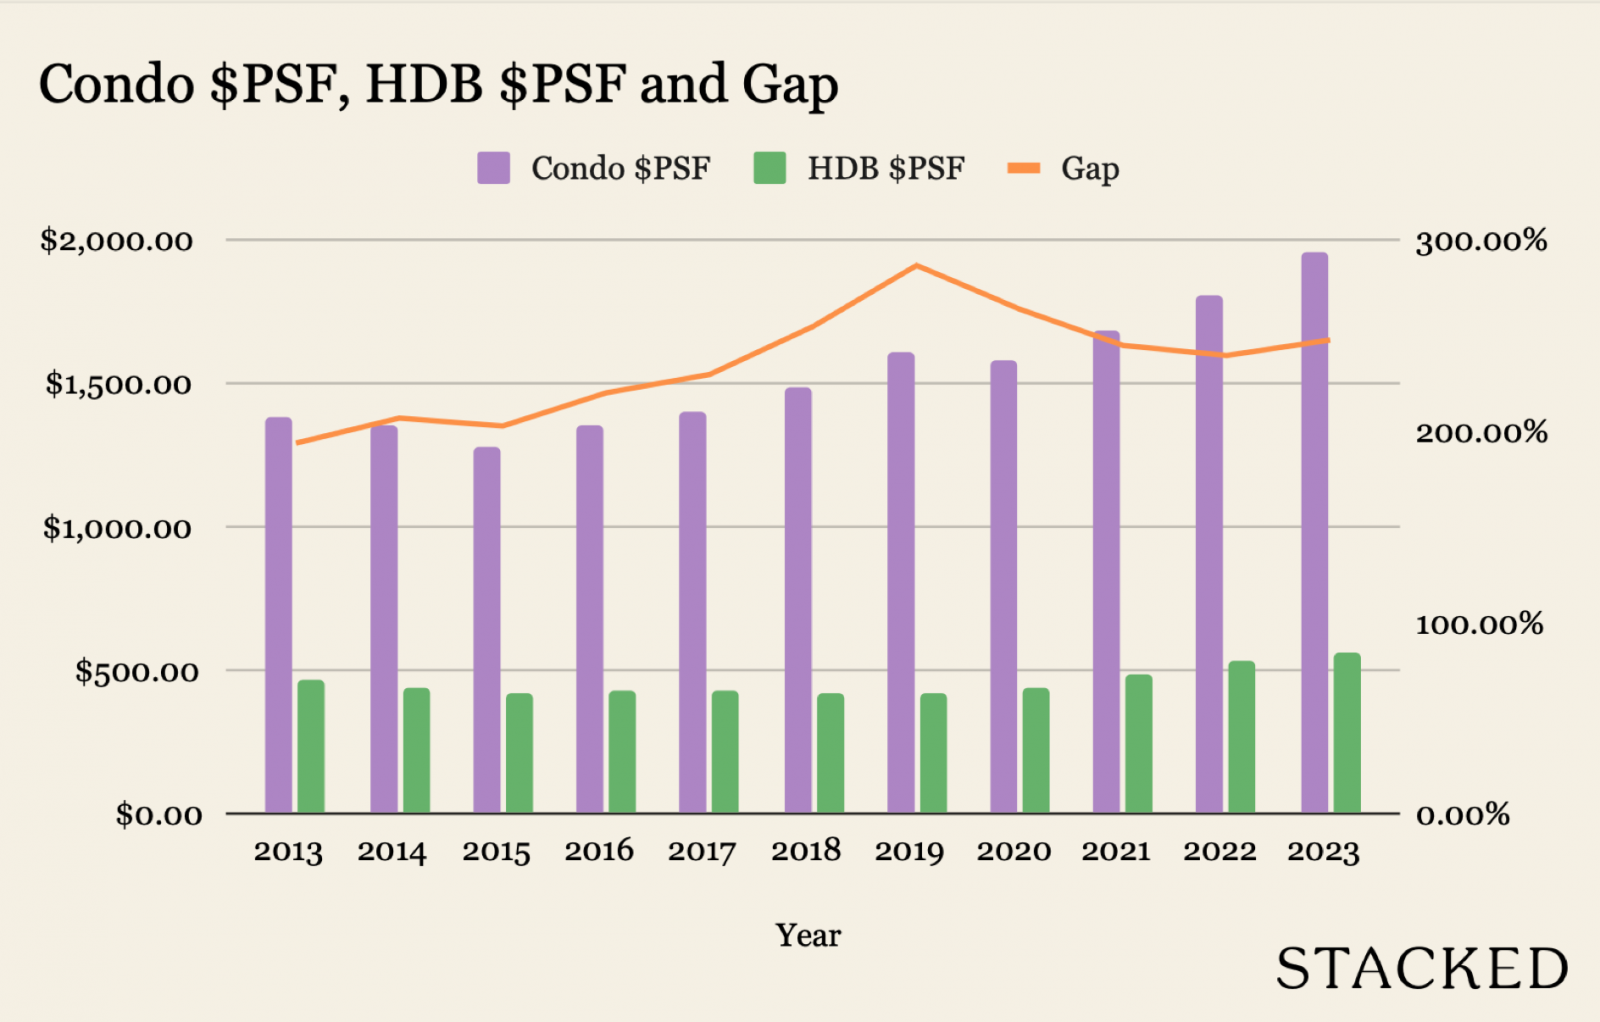
Despite worries about rising home prices post-Covid, the price gap between flats and condos was actually higher in the pre-Covid year of 2019.
This is likely due to the decline of resale flat prices after rule changes in 2013 (at the time, the government ceased publication of Cash Over Valuation rates, and imposed the Mortgage Servicing Ratio. Both moves sent resale flat prices into several consecutive years of decline).
It was during the aftermath of COVID-19 that resale prices shot back up; you can see how the prices have been rising since 2020. Flats are still outpaced by the private market though, so while they have narrowed the gap from 2019, it’s still nowhere close to what it was in 2013.
Prices in absolute terms, however, suggest that post-Covid may have been tougher on upgraders than in 2019
Put aside the price gap in percentages for a moment, and consider that in 2019, the difference in price psf between condos and flats was around $1,600+ psf versus $415+ psf.
But from 2023 onward, condo prices jumped by over $400+ psf, whereas resale flat prices rose by just around $100+ psf. So even if the price gap appears lower (in percentages) in the past few years, it’s plausible that some upgrading may still have been tougher compared to 2019.
Let’s also consider average prices (total price of homes) across all transactions:
| Year | Condo Prices | Average of resale_price | Avg Condo Size | Avg HDB Size | Price Gap |
| 2013 | $1,404,118 | $476,441 | 96 | 96 | 2.9 |
| 2014 | $1,396,142 | $442,716 | 97 | 95 | 3.2 |
| 2015 | $1,353,671 | $434,710 | 99 | 97 | 3.1 |
| 2016 | $1,412,882 | $438,839 | 98 | 97 | 3.2 |
| 2017 | $1,502,455 | $443,889 | 102 | 98 | 3.4 |
| 2018 | $1,545,086 | $441,282 | 98 | 98 | 3.5 |
| 2019 | $1,615,317 | $432,138 | 94 | 97 | 3.7 |
| 2020 | $1,557,482 | $452,279 | 94 | 98 | 3.4 |
| 2021 | $1,739,862 | $511,381 | 98 | 98 | 3.4 |
| 2022 | $1,927,696 | $549,714 | 99 | 97 | 3.5 |
| 2023 | $1,954,451 | $571,803 | 94 | 95 | 3.4 |
| Grand Total | $1,603,334 | $478,307 | 97 | 97 |
Take a look at prices in 2020, the year when the Circuit Breaker happened. Condo prices were around $1.55 million on average, whilst a resale flat averaged $450,000+.
By 2023, condo prices averaged $1.95 million (up around $400,000+), whilst HDB prices averaged $571,000+ (up by only around $120,000+).
These numbers probably matter more to upgraders than the percentage price gap, when it boils down to the reality of making down payments, qualifying for sufficient loans, and so forth.
As an aside: in 2020 and earlier, the average size of a $452,000+ flat was roughly four square metres bigger than a $1.55 million condo. As of 2023, there’s virtually no size difference between a $1.95 million+ condo, and a $571,000+ HDB flat. It’s a slight difference, but consider how much more you are paying for the condo.
But is this a fair comparison, since HDB flats are all leasehold?
If lease status is a factor for you, here’s how it looks when we eliminate all freehold condos from the comparison:
| Year | Condo Prices | Condo $PSF | Condo Size (Sqm) | HDB Price | HDB $PSF | HDB Size (Sqm) |
| 2013 | $1,258,188 | $1,289 | 93 | $476,441 | $469.17 | 96 |
| 2014 | $1,241,724 | $1,277 | 93 | $442,716 | $440.88 | 95 |
| 2015 | $1,149,470 | $1,217 | 90 | $434,710 | $423.10 | 97 |
| 2016 | $1,215,658 | $1,315 | 90 | $438,839 | $423.89 | 97 |
| 2017 | $1,300,580 | $1,354 | 93 | $443,889 | $425.39 | 98 |
| 2018 | $1,349,732 | $1,423 | 91 | $441,282 | $418.96 | 98 |
| 2019 | $1,363,463 | $1,531 | 86 | $432,138 | $415.91 | 97 |
| 2020 | $1,381,682 | $1,534 | 88 | $452,279 | $433.84 | 98 |
| 2021 | $1,521,246 | $1,618 | 92 | $511,381 | $487.62 | 98 |
| 2022 | $1,701,503 | $1,705 | 95 | $549,714 | $531.76 | 97 |
| 2023 | $1,763,537 | $1,895 | 89 | $571,803 | $564.05 | 95 |
| Grand Total | $1,403,244 | $1,487 | 91 | $478,307 | $462.94 | 97 |
We can see that average prices for condos rose roughly $400,000+ between 2020 and 2023, broadly similar to when freehold projects were on the list. However, note how the average size difference has shrunk (leasehold condos tend to be smaller at an average price point): condos were about 10 square metres smaller than a flat in 2020, but just six square metres smaller in 2023.
Examining the price gap by region
Here’s what the price gap looks like when we observe the OCR, RCR, and CCR. We have excluded the Southern Islands (Sentosa) for this, as there are no flats there:
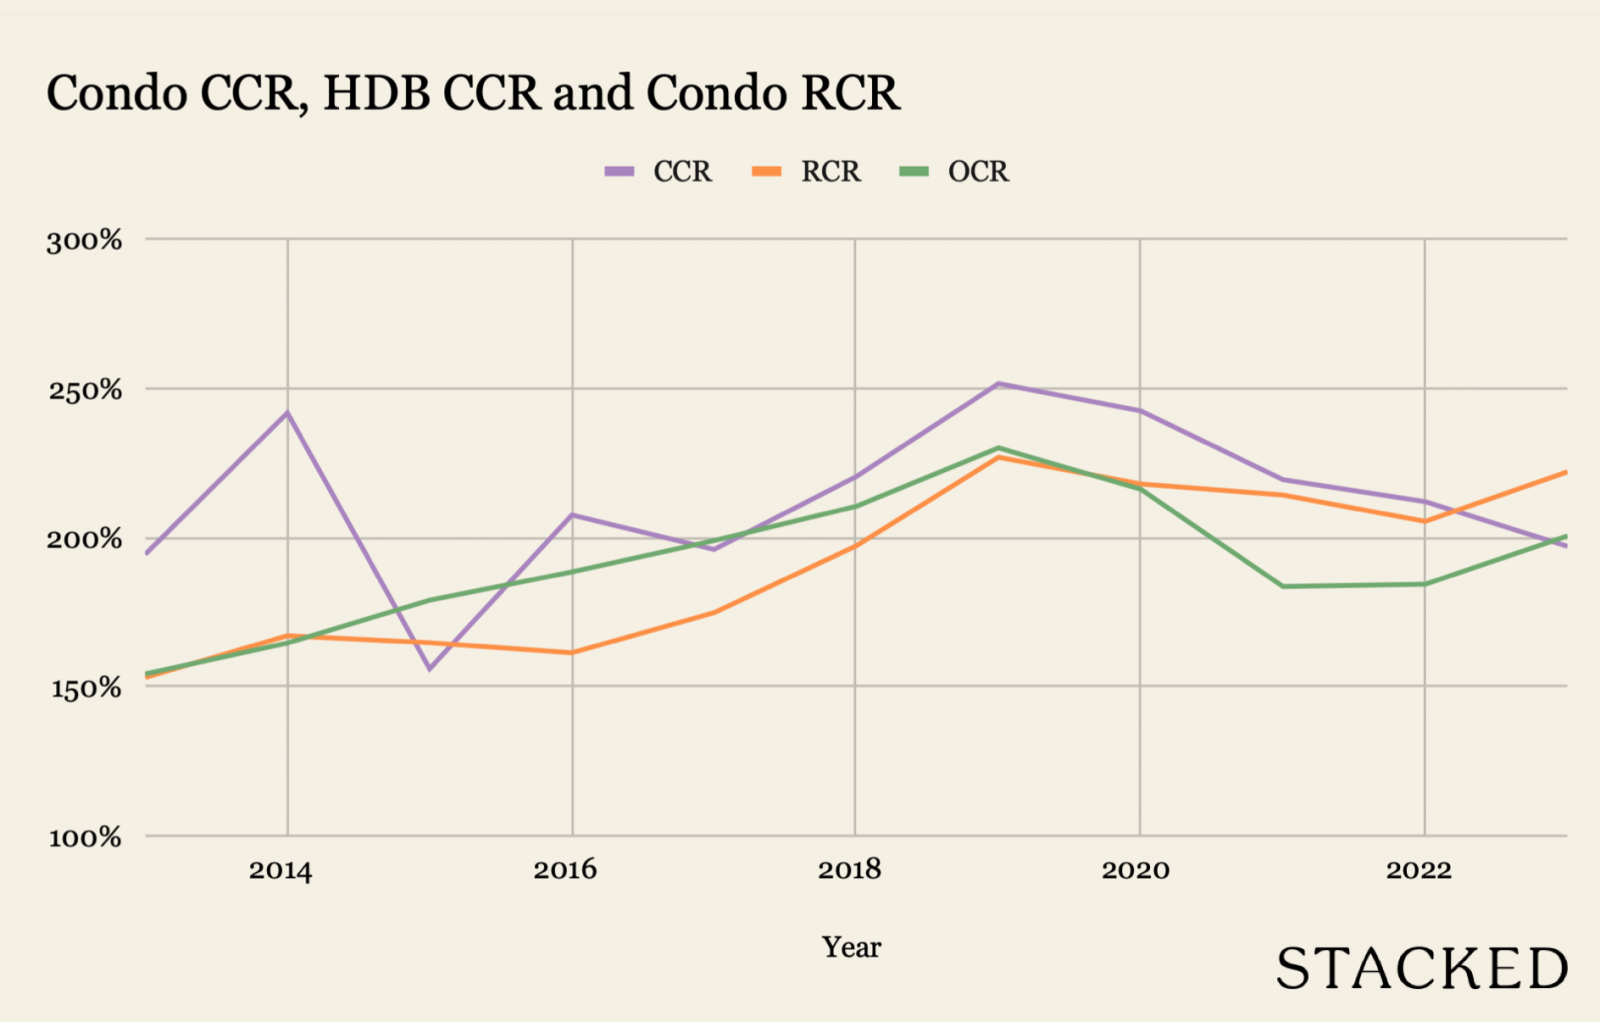
Here’s the condo/HDB price gap between the different regions:
| Year | CCR | RCR | OCR |
| 2013 | 194% | 153% | 154% |
| 2014 | 242% | 167% | 165% |
| 2015 | 156% | 165% | 179% |
| 2016 | 208% | 161% | 188% |
| 2017 | 196% | 175% | 199% |
| 2018 | 220% | 197% | 210% |
| 2019 | 252% | 227% | 230% |
| 2020 | 242% | 218% | 216% |
| 2021 | 219% | 214% | 184% |
| 2022 | 212% | 205% | 184% |
| 2023 | 197% | 222% | 201% |
The price gap in the CCR has narrowed the most, and we’d expect that to continue given the last round of cooling measures (the 60 per cent ABSD for foreigners impacts the CCR most among other regions - and it’s happening against a backdrop of more and more million-dollar central area flats).
Meanwhile, the price gap in the RCR is nearing the same high it saw back in 2019.
The general situation may be clearer if, again, we look at it in absolute numbers:
| Row Labels | Condo CCR | HDB CCR | Condo RCR | HDB RCR | Condo OCR | HDB OCR |
| 2013 | $2,111,234 | $524,100 | $1,429,874 | $514,932 | $1,029,326 | $466,604 |
| 2014 | $2,245,331 | $500,429 | $1,445,413 | $486,702 | $1,023,785 | $431,865 |
| 2015 | $2,251,327 | $710,411 | $1,350,309 | $492,999 | $996,618 | $417,281 |
| 2016 | $2,219,614 | $648,947 | $1,281,382 | $512,861 | $1,021,092 | $419,544 |
| 2017 | $2,107,789 | $641,782 | $1,453,663 | $530,926 | $1,090,495 | $420,040 |
| 2018 | $2,762,706 | $656,480 | $1,494,370 | $535,986 | $1,094,924 | $417,511 |
| 2019 | $2,671,110 | $643,123 | $1,482,510 | $516,003 | $1,098,617 | $411,400 |
| 2020 | $2,044,835 | $621,680 | $1,520,180 | $522,156 | $1,176,060 | $436,466 |
| 2021 | $2,223,497 | $728,548 | $1,695,064 | $582,919 | $1,258,125 | $491,344 |
| 2022 | $2,589,665 | $705,734 | $1,976,917 | $618,407 | $1,369,572 | $532,372 |
| 2023 | $2,585,938 | $726,969 | $1,998,090 | $640,829 | $1,462,449 | $556,268 |
Here’s how much prices have risen for flats and condos, in each of the three regions between 2020 to 2023:
| Period | Condo CCR | HDB CCR | Condo RCR | HDB RCR | Condo OCR | HDB OCR |
| 2020-2023 | $541,103 | $105,289 | $477,909 | $118,673 | $286,389 | $119,802 |
We see the same pattern across the board: resale flat prices climbed by only around $100,000, whereas condo prices increased by much bigger amounts (almost five times as much, in the CCR!)
Given that the flats are cheaper and bigger, this could drive some buyers to upgrade to a bigger or better-located flat, rather than a condo. This may explain some of the momentum behind the rise of million-dollar flats. Speaking of bigger, here’s a look at unit sizes for comparison:
| Year | Condo CCR | HDB CCR | Condo RCR | HDB RCR | Condo OCR | HDB OCR |
| 2013 | 114 | 81 | 95 | 83 | 89 | 99 |
| 2014 | 106 | 77 | 96 | 83 | 90 | 98 |
| 2015 | 116 | 90 | 92 | 85 | 88 | 99 |
| 2016 | 105 | 87 | 89 | 86 | 87 | 100 |
| 2017 | 107 | 88 | 93 | 88 | 91 | 100 |
| 2018 | 123 | 90 | 88 | 88 | 89 | 101 |
| 2019 | 112 | 90 | 82 | 88 | 84 | 99 |
| 2020 | 91 | 87 | 86 | 88 | 89 | 100 |
| 2021 | 95 | 91 | 87 | 90 | 94 | 100 |
| 2022 | 108 | 86 | 95 | 88 | 92 | 99 |
| 2023 | 107 | 84 | 87 | 86 | 88 | 97 |
In the CCR the size difference is smaller, but your flats in the RCR and OCR will be bigger than your condo counterparts on average.
Can we account for the age of the properties?
This is a bit challenging, not least due to the available transaction volumes. But let’s give it a shot:
Projects aged 20 years or less:
| Year | Condo CCR | HDB CCR | Condo RCR | HDB RCR | Condo OCR | HDB OCR |
| 2013 | $2,103,353 | $568,194 | $1,434,805 | $698,345 | $1,024,596 | $516,253 |
| 2014 | $2,239,962 | $557,099 | $1,457,099 | $680,833 | $1,019,722 | $475,515 |
| 2015 | $2,270,389 | $874,391 | $1,342,208 | $674,595 | $993,660 | $449,710 |
| 2016 | $2,240,614 | $873,349 | $1,275,586 | $698,865 | $1,021,745 | $447,556 |
| 2017 | $2,131,490 | $900,401 | $1,461,549 | $711,243 | $1,100,942 | $445,496 |
| 2018 | $2,874,319 | $894,191 | $1,498,406 | $722,463 | $1,095,974 | $437,868 |
| 2019 | $2,724,364 | $866,451 | $1,482,099 | $726,088 | $1,097,351 | $438,795 |
| 2020 | $2,021,273 | $914,642 | $1,519,666 | $749,656 | $1,188,030 | $465,673 |
| 2021 | $2,218,625 | $981,142 | $1,707,994 | $776,087 | $1,283,577 | $516,844 |
| 2022 | $2,604,186 | $1,079,216 | $2,012,179 | $815,180 | $1,392,818 | $563,385 |
| 2023 | $2,712,081 | $1,220,910 | $2,021,546 | $846,591 | $1,427,403 | $591,402 |
As of 2023, a resale flat that’s 20 years or newer, in a central area, is less than half the price of a condo counterpart ($1.2 million versus an average condo price of $2.7 million).
In the OCR, a resale condo in this age band averages just $1.4 million; but consider that for this price, you could get a prime location HDB project like Pinnacle @ Duxton. Having condo facilities may not justify the price difference when you consider access to areas like the CBD and its relevant amenities. Plus, prime location flats have conservancy fees that are much cheaper than the maintenance fees of even OCR condos (probably still around $300 to $400 a month).
If you look at unit sizes, flats also come out larger:
| Year | Condo CCR | HDB CCR | Condo RCR | HDB RCR | Condo OCR | HDB OCR |
| 2013 | 112 | 93 | 93 | 97 | 88 | 111 |
| 2014 | 102 | 88 | 94 | 97 | 89 | 108 |
| 2015 | 110 | 97 | 88 | 96 | 86 | 108 |
| 2016 | 100 | 96 | 85 | 97 | 84 | 106 |
| 2017 | 102 | 98 | 90 | 96 | 87 | 104 |
| 2018 | 120 | 98 | 85 | 95 | 85 | 101 |
| 2019 | 105 | 95 | 79 | 93 | 79 | 97 |
| 2020 | 84 | 98 | 81 | 92 | 84 | 96 |
| 2021 | 89 | 98 | 83 | 91 | 88 | 96 |
| 2022 | 104 | 98 | 91 | 89 | 86 | 94 |
| 2023 | 106 | 96 | 83 | 87 | 80 | 91 |
So it starts to explain why a million-dollar flat looks more and more sensible to some people in the current year, and why they continue to rise in number.
Projects aged 20 to 40 years:
| Year | Condo CCR | HDB CCR | Condo RCR | HDB RCR | Condo OCR | HDB OCR |
| 2013 | $2,679,670 | $543,015 | $1,325,501 | $491,420 | $1,153,772 | $427,967 |
| 2014 | $2,467,071 | $504,455 | $1,289,145 | $474,876 | $1,094,832 | $402,958 |
| 2015 | $2,117,624 | $552,947 | $1,509,405 | $487,385 | $1,053,213 | $394,638 |
| 2016 | $2,032,489 | $562,684 | $1,376,231 | $502,927 | $1,012,087 | $398,840 |
| 2017 | $2,048,379 | $566,497 | $1,432,132 | $539,544 | $1,008,511 | $402,208 |
| 2018 | $2,131,431 | $608,416 | $1,479,921 | $555,957 | $1,076,145 | $406,927 |
| 2019 | $2,442,445 | $646,862 | $1,527,204 | $553,410 | $1,090,791 | $399,855 |
| 2020 | $2,347,398 | $586,587 | $1,549,060 | $560,104 | $1,079,482 | $425,067 |
| 2021 | $2,201,381 | $688,423 | $1,636,032 | $621,954 | $1,121,048 | $488,623 |
| 2022 | $2,451,289 | $648,833 | $1,802,369 | $682,887 | $1,252,351 | $533,782 |
| 2023 | $2,038,027 | $793,980 | $1,858,532 | $729,768 | $1,560,831 | $557,389 |
In the past three years, the CCR has seen some notable price drops. This is mostly due to size:
| Year | Condo CCR | HDB CCR | Condo RCR | HDB RCR | Condo OCR | HDB OCR |
| 2013 | 202 | 83 | 132 | 86 | 123 | 90 |
| 2014 | 210 | 77 | 133 | 86 | 124 | 91 |
| 2015 | 165 | 85 | 139 | 90 | 123 | 93 |
| 2016 | 164 | 85 | 132 | 94 | 122 | 95 |
| 2017 | 168 | 88 | 127 | 98 | 121 | 98 |
| 2018 | 152 | 95 | 119 | 101 | 119 | 101 |
| 2019 | 171 | 101 | 119 | 102 | 120 | 103 |
| 2020 | 150 | 94 | 121 | 103 | 121 | 106 |
| 2021 | 129 | 105 | 120 | 106 | 118 | 108 |
| 2022 | 138 | 94 | 121 | 105 | 116 | 107 |
| 2023 | 101 | 104 | 115 | 105 | 108 | 106 |
The average size of a transacted condo unit in the CCR, as of 2023, is just 101 square metres, compared to the much larger 150 to 171 square metre units in 2019/20. Again, looking at the price gap between flats and condos relevant to size, flats stand out as a much better deal.
Projects aged 40 years or older:
| Year | Condo CCR | HDB CCR | Condo RCR | HDB RCR | Condo OCR | HDB OCR |
| 2013 | $1,358,500 | $303,445 | $1,121,067 | $349,135 | $785,444 | $315,778 |
| 2014 | $1,736,667 | $300,200 | $1,038,210 | $344,352 | $820,000 | $299,059 |
| 2015 | $1,535,000 | $468,680 | $882,579 | $344,236 | $598,333 | $278,542 |
| 2016 | $1,520,500 | $495,169 | $1,075,559 | $356,561 | $1,109,444 | $277,683 |
| 2017 | $1,400,894 | $445,664 | $1,043,805 | $358,844 | $1,056,772 | $289,475 |
| 2018 | $1,425,579 | $452,260 | $1,040,975 | $354,913 | $1,351,980 | $302,007 |
| 2019 | $1,710,407 | $439,919 | $1,059,331 | $343,253 | $1,393,409 | $313,804 |
| 2020 | $2,397,125 | $437,199 | $1,237,880 | $343,924 | $1,313,518 | $331,975 |
| 2021 | $2,447,912 | $475,346 | $1,093,588 | $388,930 | $1,445,024 | $380,815 |
| 2022 | $2,433,581 | $508,101 | $1,303,038 | $416,303 | $1,653,572 | $406,354 |
| 2023 | $2,220,349 | $498,735 | $1,462,061 | $430,490 | $1,746,712 | $429,229 |
There are relatively few projects of this age, and there may be more quirks specific to each project. As such, we do need to keep this in mind when comparing.
Nonetheless, one of the things to note is that - among the oldest flats - the price differences based on location tend to be smaller. In the 20 or under age range, a flat in the OCR versus the CCR saw a price difference of over $500,000 (see above).
For flats in the 40+ age range, the difference is just around $70,000, and even the gap between RCR and OCR flats is not too great.
Another difference is size because condos built in the ‘80s tended to be much bigger than the ones which came later:
| Year | Condo CCR | HDB CCR | Condo RCR | HDB RCR | Condo OCR | HDB OCR |
| 2013 | 134 | 54 | 114 | 61 | 124 | 67 |
| 2014 | 143 | 58 | 127 | 63 | 124 | 67 |
| 2015 | 132 | 73 | 98 | 66 | 116 | 65 |
| 2016 | 183 | 78 | 137 | 68 | 159 | 68 |
| 2017 | 163 | 71 | 129 | 70 | 133 | 72 |
| 2018 | 127 | 72 | 125 | 72 | 140 | 77 |
| 2019 | 169 | 70 | 105 | 73 | 149 | 80 |
| 2020 | 226 | 71 | 133 | 73 | 141 | 82 |
| 2021 | 224 | 72 | 108 | 75 | 149 | 83 |
| 2022 | 193 | 73 | 120 | 74 | 148 | 81 |
| 2023 | 151 | 70 | 121 | 73 | 143 | 81 |
At some point, this will be shaken up, as units here start to creep toward the end of their 99-year lease. For now however, most are new enough that we haven’t yet seen the effects.
But as a general conclusion, after factoring in location and age, HDB flats may be a more sensible option among pure owner-occupiers right now. We don’t think this eludes the market, which is why the pace of million-dollar flats never seems to slow.
As a final aside, consider that the effect of grants on a lower flat price could provide a significant cushion for HDB prices. The subsidy, as a percentage of the price, is huge for cheaper flats.
At Stacked, we like to look beyond the headlines and surface-level numbers, and focus on how things play out in the real world.
If you'd like to discuss how this applies to your own circumstances, you can reach out for a one-to-one consultation here.
And if you simply have a question or want to share a thought, feel free to write to us at stories@stackedhomes.com. We read every message.





3 Comments
If factor property tax and conservancy charges, HDB will even look more attractive. More so for a senior who does not drive a car.
Why not use psf to calculate instead to remove the size variable?