


Singapore’s Best And Worst Performing Property Districts Since The Pandemic: Here’s What We’ve Found
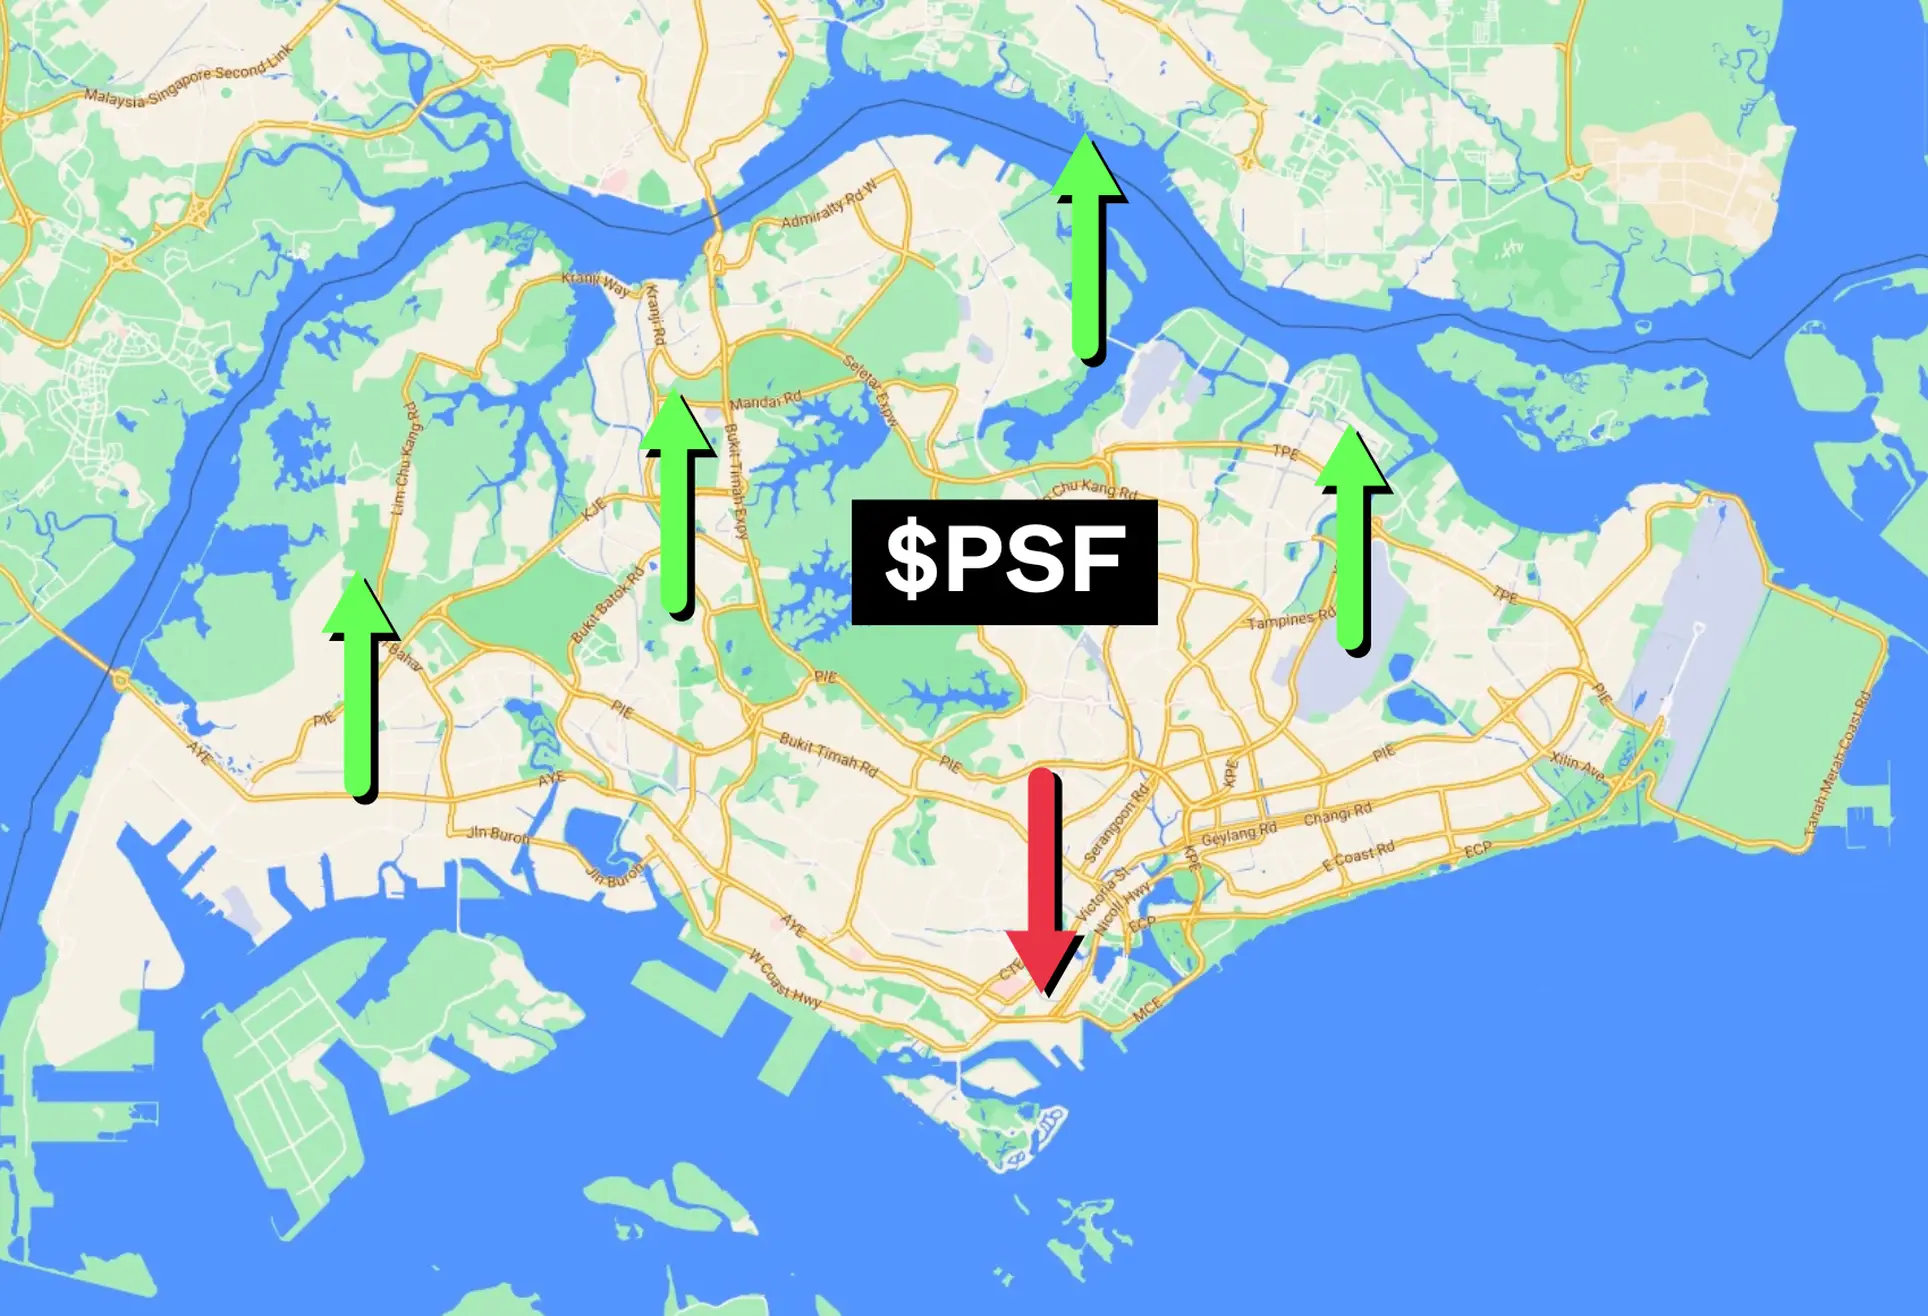
The times are changing, and it’s not just the pandemic that caused it (although it sped things up a bit). Amidst big moves like decentralisation, and Work From Home, the very idea of what constitutes “central” – and hence a premium price – is not what it was; and as the Marina South bid shows, even developers are rethinking the former “surefire” districts. Here’s where losses and gains are piling up these days, when it comes to the performance over the last few years:
So many readers write in because they're unsure what to do next, and don't know who to trust.
If this sounds familiar, we offer structured 1-to-1 consultations where we walk through your finances, goals, and market options objectively.
No obligation. Just clarity.
Learn more here.
Which districts have seen the best and worst performance?
First, here’s a look at the average $PSF for new and resale non-landed homes by district.
| Districts | 2020 | 2021 | 2022 | 2023 |
| 1 | $2,161 | $2,101 | $2,057 | $2,015 |
| 2 | $2,235 | $2,223 | $2,282 | $2,240 |
| 3 | $2,004 | $2,042 | $2,309 | $2,262 |
| 4 | $1,511 | $1,922 | $1,863 | $1,951 |
| 5 | $1,536 | $1,659 | $1,562 | $1,942 |
| 6 | $3,206 | $2,937 | $3,115 | $3,297 |
| 7 | $2,384 | $2,565 | $2,524 | $2,436 |
| 8 | $1,432 | $1,516 | $1,678 | $1,763 |
| 9 | $2,257 | $2,453 | $2,487 | $2,571 |
| 10 | $2,152 | $2,336 | $2,590 | $2,542 |
| 11 | $1,834 | $1,849 | $2,225 | $2,535 |
| 12 | $1,422 | $1,452 | $1,565 | $1,633 |
| 13 | $1,732 | $1,724 | $1,770 | $1,844 |
| 14 | $1,517 | $1,476 | $1,587 | $1,625 |
| 15 | $1,528 | $1,695 | $1,747 | $2,230 |
| 16 | $1,123 | $1,185 | $1,526 | $1,591 |
| 17 | $1,037 | $1,145 | $1,109 | $1,194 |
| 18 | $1,226 | $1,257 | $1,240 | $1,370 |
| 19 | $1,373 | $1,368 | $1,486 | $1,542 |
| 20 | $1,567 | $1,506 | $1,897 | $1,688 |
| 21 | $1,695 | $1,660 | $1,719 | $2,218 |
| 22 | $1,051 | $1,199 | $1,337 | $2,051 |
| 23 | $1,171 | $1,335 | $1,247 | $1,638 |
| 25 | $883 | $949 | $1,066 | $1,127 |
| 26 | $1,144 | $1,131 | $2,033 | $2,027 |
| 27 | $944 | $1,260 | $1,259 | $1,245 |
| 28 | $1,150 | $1,154 | $1,298 | $1,360 |
District Year on Year performance (New and resale non-landed properties)
Here’s a look at how it has performed on average since 2020:
| Districts | Segment | 2020-2021 | 2021-2022 | 2022-2023 | Average |
| 1 | CCR | -2.8% | -2.1% | -2.0% | -2.3% |
| 2 | CCR | -0.5% | 2.6% | -1.8% | 0.1% |
| 7 | RCR | 7.6% | -1.6% | -3.5% | 0.8% |
| 6 | CCR | -8.4% | 6.0% | 5.9% | 1.2% |
| 13 | RCR | -0.5% | 2.6% | 4.2% | 2.1% |
| 14 | RCR | -2.7% | 7.5% | 2.4% | 2.4% |
| 20 | RCR | -3.9% | 26.0% | -11.0% | 3.7% |
| 18 | OCR | 2.5% | -1.3% | 10.4% | 3.9% |
| 19 | OCR | -0.4% | 8.6% | 3.8% | 4.0% |
| 3 | RCR | 1.9% | 13.1% | -2.1% | 4.3% |
| 9 | CCR | 8.7% | 1.4% | 3.4% | 4.5% |
| 12 | RCR | 2.2% | 7.8% | 4.3% | 4.7% |
| 17 | OCR | 10.5% | -3.2% | 7.7% | 5.0% |
| 10 | CCR | 8.5% | 10.9% | -1.9% | 5.9% |
| 28 | OCR | 0.4% | 12.5% | 4.7% | 5.9% |
| 8 | RCR | 5.9% | 10.7% | 5.1% | 7.2% |
| 25 | OCR | 7.4% | 12.4% | 5.7% | 8.5% |
| 5 | RCR | 8.0% | -5.8% | 24.3% | 8.8% |
| 4 | RCR | 27.2% | -3.1% | 4.7% | 9.6% |
| 21 | OCR | -2.1% | 3.6% | 29.0% | 10.2% |
| 27 | OCR | 33.6% | -0.1% | -1.1% | 10.8% |
| 11 | CCR | 0.8% | 20.3% | 13.9% | 11.7% |
| 16 | OCR | 5.5% | 28.8% | 4.3% | 12.8% |
| 23 | OCR | 14.1% | -6.6% | 31.4% | 12.9% |
| 15 | RCR | 10.9% | 3.1% | 27.7% | 13.9% |
| 26 | OCR | -1.1% | 79.7% | -0.3% | 26.1% |
| 22 | OCR | 14.1% | 11.5% | 53.3% | 26.3% |
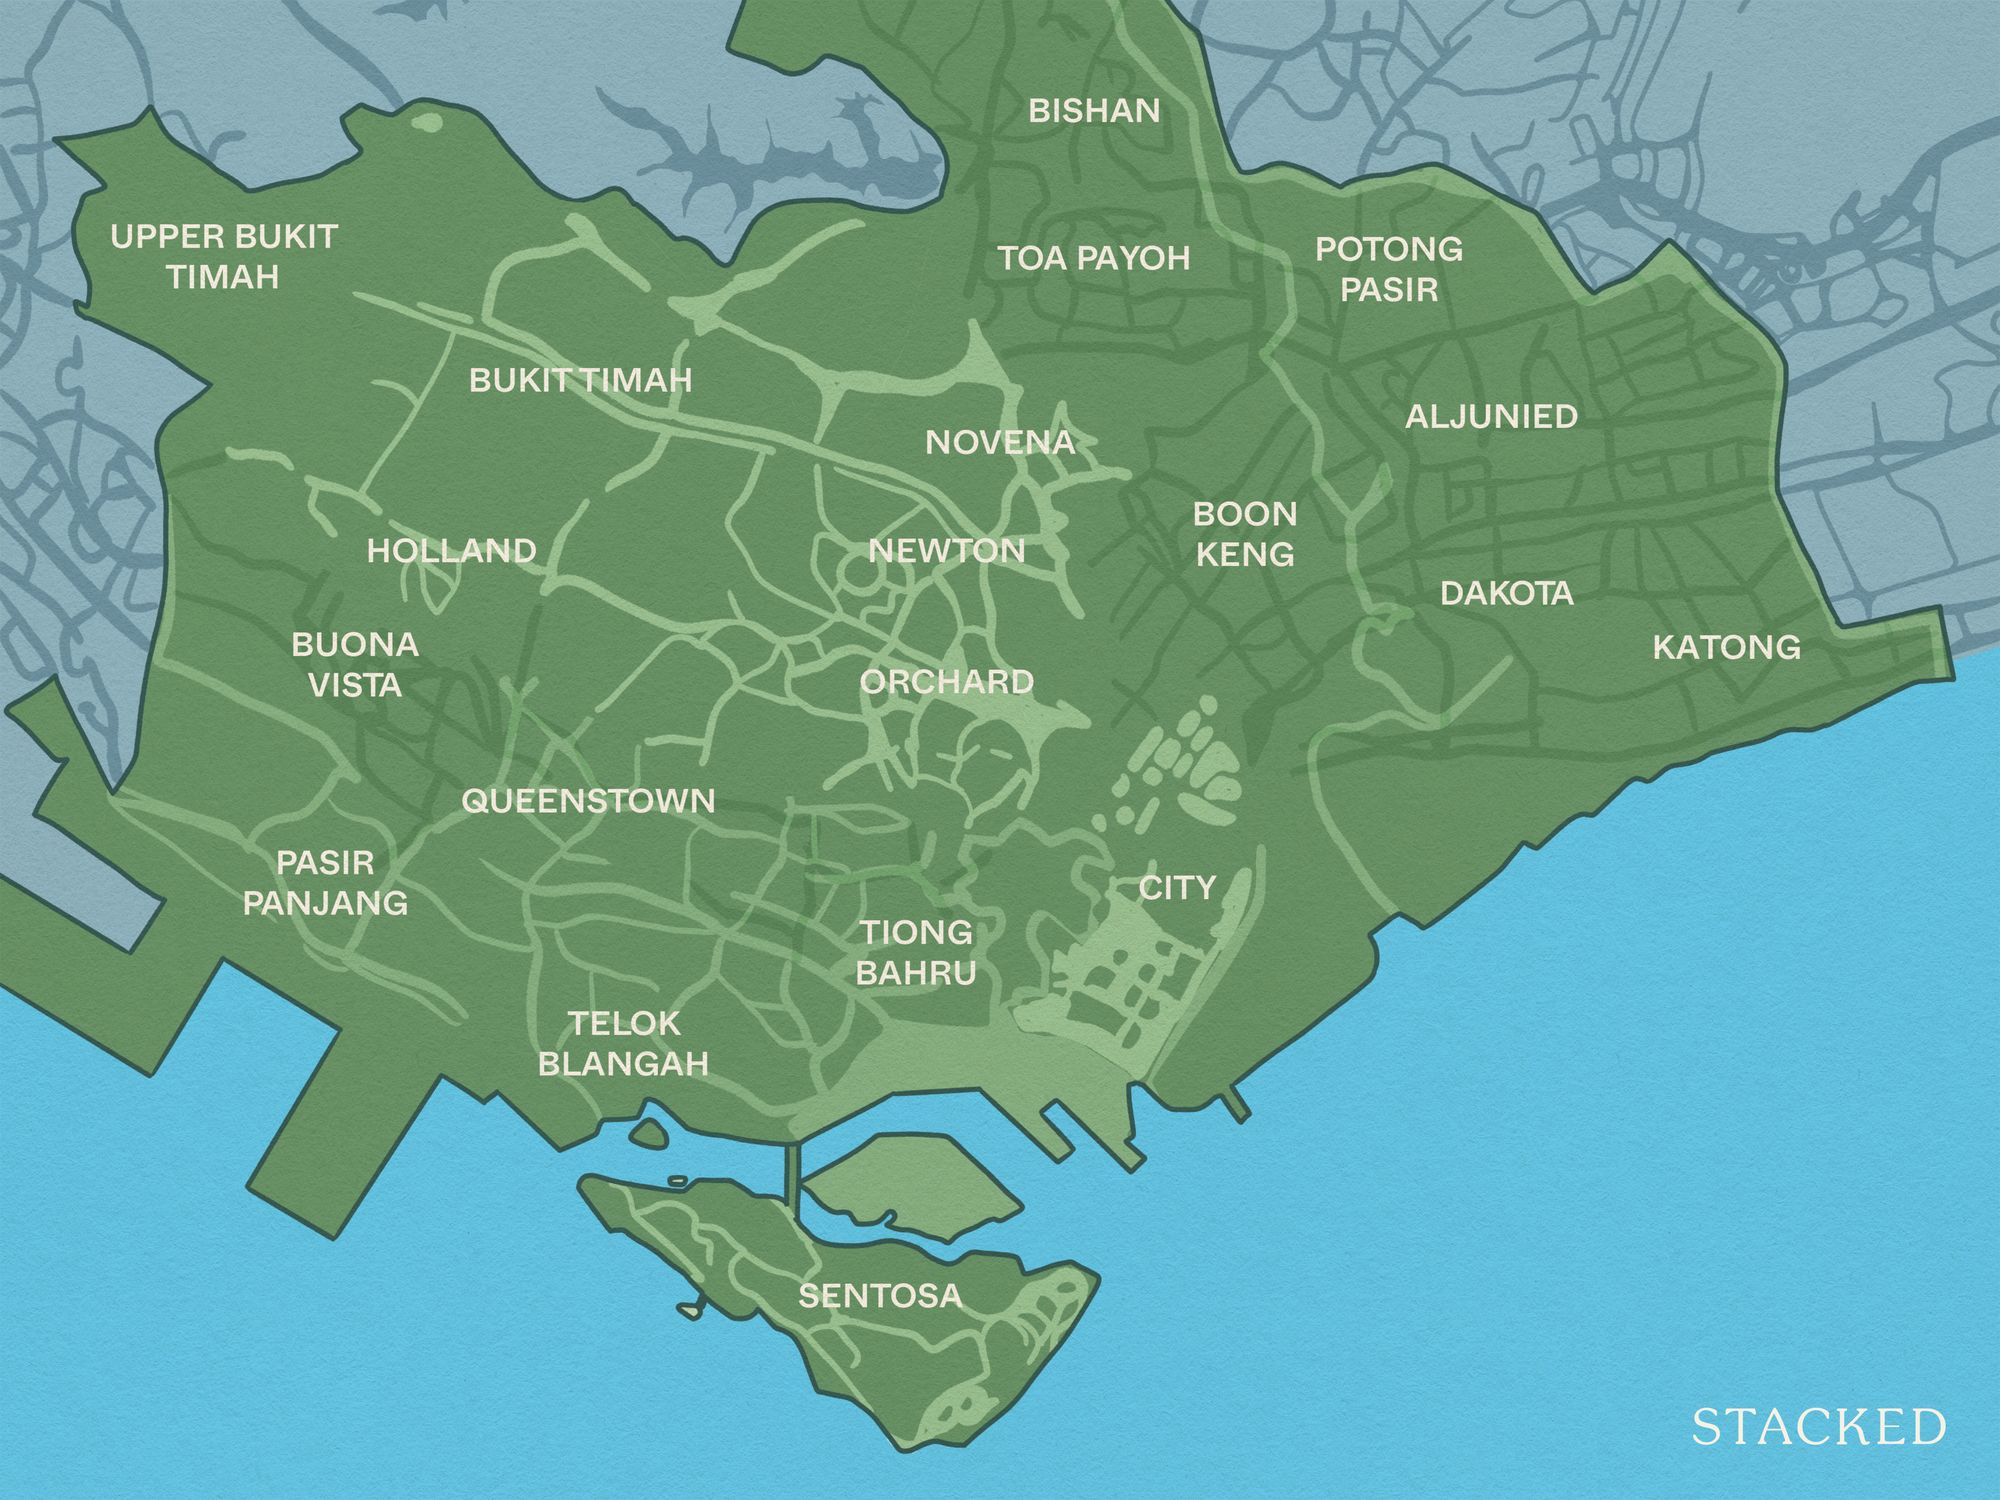
For reference, here is how the districts are grouped into regions:
- Core Central Region (CCR) – Districts 1, 2, 6, 9, 10, and 11
- Rest of Central Region (RCR) – Districts 3, 4, 5, 7, 8, 12, 13, 14, 15, and 20
- Outside Central Region (OCR) – Districts 16, 17, 18, 19, 21, 22, 23, 24, 25, 26, 27, and 28
As a sign of the times, note that 2021 was the last year in which we had 2 districts averaging below $1,000 psf (District 25 and 27); and from 2022 onward, there isn’t a single district where private home prices have averaged below $1,000 psf.
District 25 (Admiralty, Woodlands) is still the cheapest at $1,127 psf on average, while District 17 (Changi, toward the area of the airport and Changi Village) is a close second at $1,194 psf.
On the flip side, District 6 (City Hall) saw the highest average at $3,297 psf, while District 9 (Orchard) followed at $2,571 psf.
City Hall is almost always priciest on a psf basis though; this could be due to residential projects in the City Hall area tending to be smaller (a smaller unit tends to have a higher price psf, despite a lower quantum). Also note that District 6 prices can be quite volatile as there are very few residential properties here, as you’ll also see on the resale table below (the main suspect being Eden Residences Capitol).
One interesting change is that District 9 regained its lead from District 7 (Beach Road, Bugis). Notice that between 2020 to 2022, District 7 led District 9 in average price psf. Nonetheless, Districts 9, 10, and 7 are in constant close competition with each other; and despite District 7 being an RCR area, there are some signs that the centre of gravity is shifting more toward the midtown/Ophir-Rochor area.
With the completion of the Ophir-Rochor corridor in future, it’s possible that the Beach Road area and not Orchard or City Hall is the new buzzy area that the well-heeled want to live in.
In Year-On-Year changes, Districts 22 and 26 led the pack
District 22 (Jurong) and District 26 (Mandai/Upper Thomson) saw the biggest uptick in value. This does not come as a surprise given the new launches in both districts.
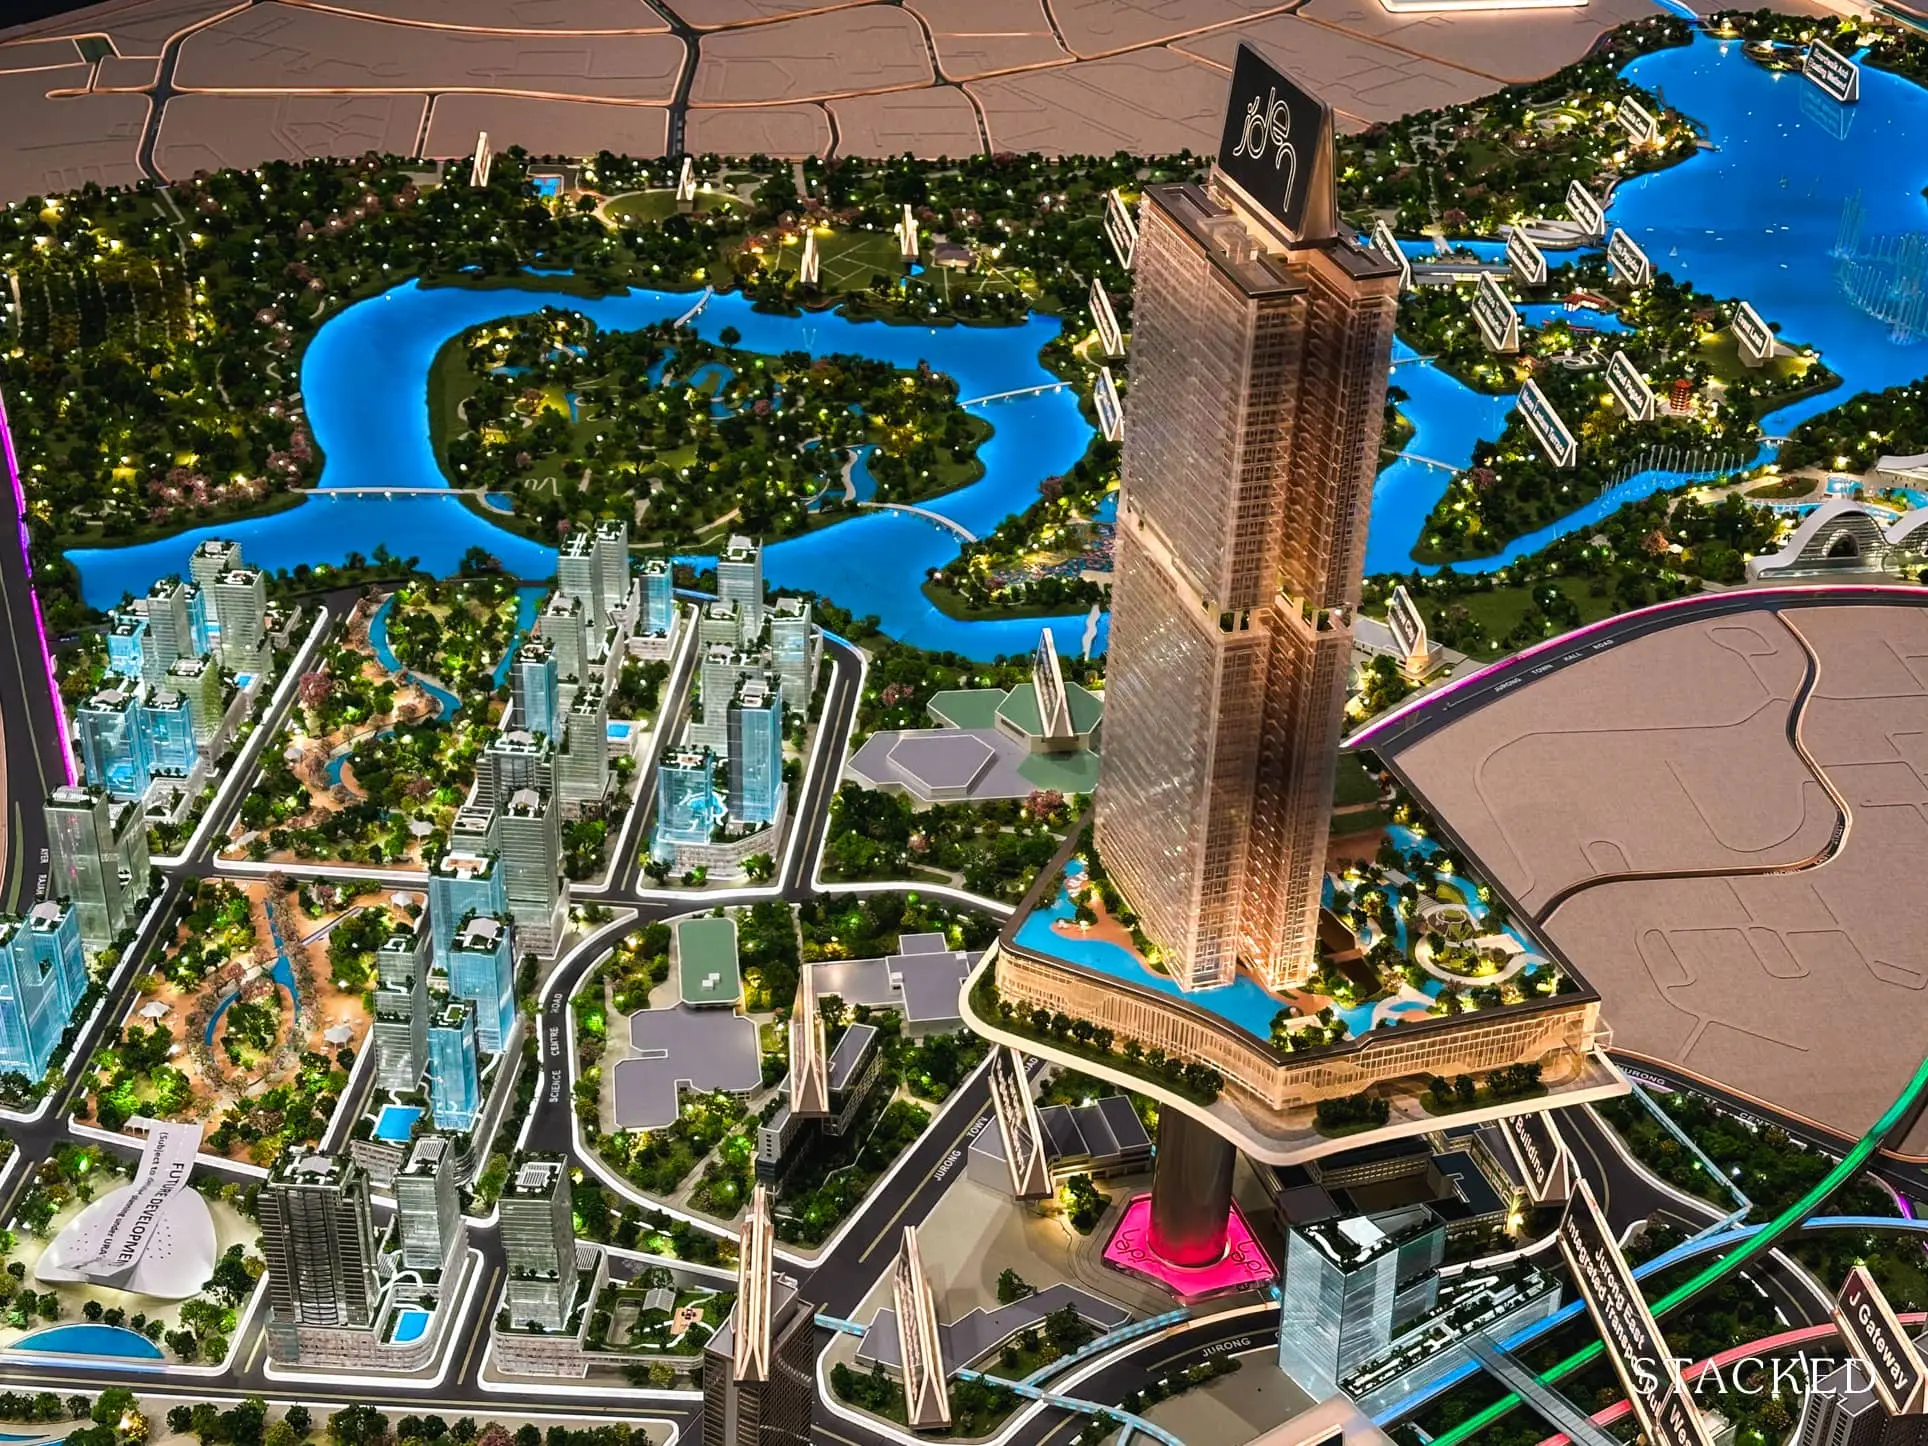
District 22 saw the launch of The Lakegarden Residences and J’den, averaging $2,111 psf and $2,474 psf respectively.
For District 26, the sale of Lentor Modern in 2022 averaged $2,125 psf, while in 2023, new launch projects such as Hillock Green and Lentor Hills Residences saw an average of $2,125 psf and $2,104 psf respectively. Lentor Modern continued selling in 2023 at an average of $2,087 psf.
What about resale only prices?
With the current high prices from a psf perspective, new launches may be distorting the picture a bit. Any district that has had a bigger influx of new launches will naturally have a higher psf growth, and we wanted to keep it constant. So we looked at the district performance excluding new launch projects:
| Districts | 2020 | 2021 | 2022 | 2023 |
| 1 | $2,161 | $2,101 | $2,057 | $2,015 |
| 2 | $2,106 | $2,015 | $2,126 | $1,956 |
| 3 | $1,611 | $1,651 | $1,873 | $1,988 |
| 4 | $1,511 | $1,598 | $1,835 | $1,886 |
| 5 | $1,206 | $1,331 | $1,464 | $1,552 |
| 6 | $3,206 | $3,104 | $3,863 | $3,544 |
| 7 | $1,697 | $1,763 | $1,841 | $1,756 |
| 8 | $1,296 | $1,405 | $1,528 | $1,662 |
| 9 | $2,095 | $2,190 | $2,219 | $2,232 |
| 10 | $1,871 | $1,989 | $2,220 | $2,229 |
| 11 | $1,598 | $1,704 | $1,771 | $1,929 |
| 12 | $1,327 | $1,377 | $1,526 | $1,601 |
| 13 | $1,375 | $1,471 | $1,596 | $1,736 |
| 14 | $1,191 | $1,273 | $1,411 | $1,521 |
| 15 | $1,316 | $1,438 | $1,602 | $1,692 |
| 16 | $1,105 | $1,168 | $1,344 | $1,410 |
| 17 | $888 | $940 | $1,079 | $1,159 |
| 18 | $960 | $1,021 | $1,193 | $1,273 |
| 19 | $1,121 | $1,194 | $1,359 | $1,440 |
| 20 | $1,253 | $1,421 | $1,555 | $1,628 |
| 21 | $1,263 | $1,351 | $1,518 | $1,600 |
| 22 | $1,051 | $1,199 | $1,337 | $1,409 |
| 23 | $1,013 | $1,081 | $1,216 | $1,331 |
| 25 | $883 | $949 | $1,066 | $1,127 |
| 26 | $1,043 | $1,112 | $1,184 | $1,299 |
| 27 | $871 | $978 | $1,176 | $1,233 |
| 28 | $1,075 | $1,137 | $1,253 | $1,360 |
Resale only performance by district
| Districts | Segment | 2020-2021 | 2021-2022 | 2022-2023 | Average |
| 1 | CCR | -2.8% | -2.1% | -2.0% | -2.3% |
| 2 | CCR | -4.3% | 5.5% | -8.0% | -2.3% |
| 7 | RCR | 3.9% | 4.4% | -4.7% | 1.2% |
| 9 | CCR | 4.5% | 1.3% | 0.6% | 2.1% |
| 6 | CCR | -3.2% | 24.4% | -8.2% | 4.3% |
| 10 | CCR | 6.3% | 11.6% | 0.4% | 6.1% |
| 12 | RCR | 3.7% | 10.8% | 5.0% | 6.5% |
| 11 | CCR | 6.6% | 4.0% | 8.9% | 6.5% |
| 3 | RCR | 2.5% | 13.4% | 6.1% | 7.3% |
| 26 | OCR | 6.6% | 6.5% | 9.7% | 7.6% |
| 4 | RCR | 5.7% | 14.8% | 2.8% | 7.8% |
| 13 | RCR | 7.0% | 8.5% | 8.8% | 8.1% |
| 28 | OCR | 5.7% | 10.2% | 8.6% | 8.2% |
| 21 | OCR | 7.0% | 12.3% | 5.4% | 8.2% |
| 25 | OCR | 7.4% | 12.4% | 5.7% | 8.5% |
| 14 | RCR | 6.9% | 10.9% | 7.7% | 8.5% |
| 16 | OCR | 5.7% | 15.0% | 4.9% | 8.6% |
| 8 | RCR | 8.4% | 8.8% | 8.8% | 8.6% |
| 19 | OCR | 6.5% | 13.8% | 6.0% | 8.7% |
| 15 | RCR | 9.3% | 11.4% | 5.6% | 8.8% |
| 5 | RCR | 10.4% | 10.0% | 6.0% | 8.8% |
| 20 | RCR | 13.4% | 9.4% | 4.7% | 9.2% |
| 17 | OCR | 5.9% | 14.7% | 7.5% | 9.4% |
| 23 | OCR | 6.7% | 12.5% | 9.5% | 9.6% |
| 18 | OCR | 6.3% | 16.9% | 6.7% | 10.0% |
| 22 | OCR | 14.1% | 11.5% | 5.3% | 10.3% |
| 27 | OCR | 12.3% | 20.3% | 4.8% | 12.4% |
When we focus only on resale condos, we still see a similar picture with one notable difference – gains aren’t as wide since there’s no new launch distortion.
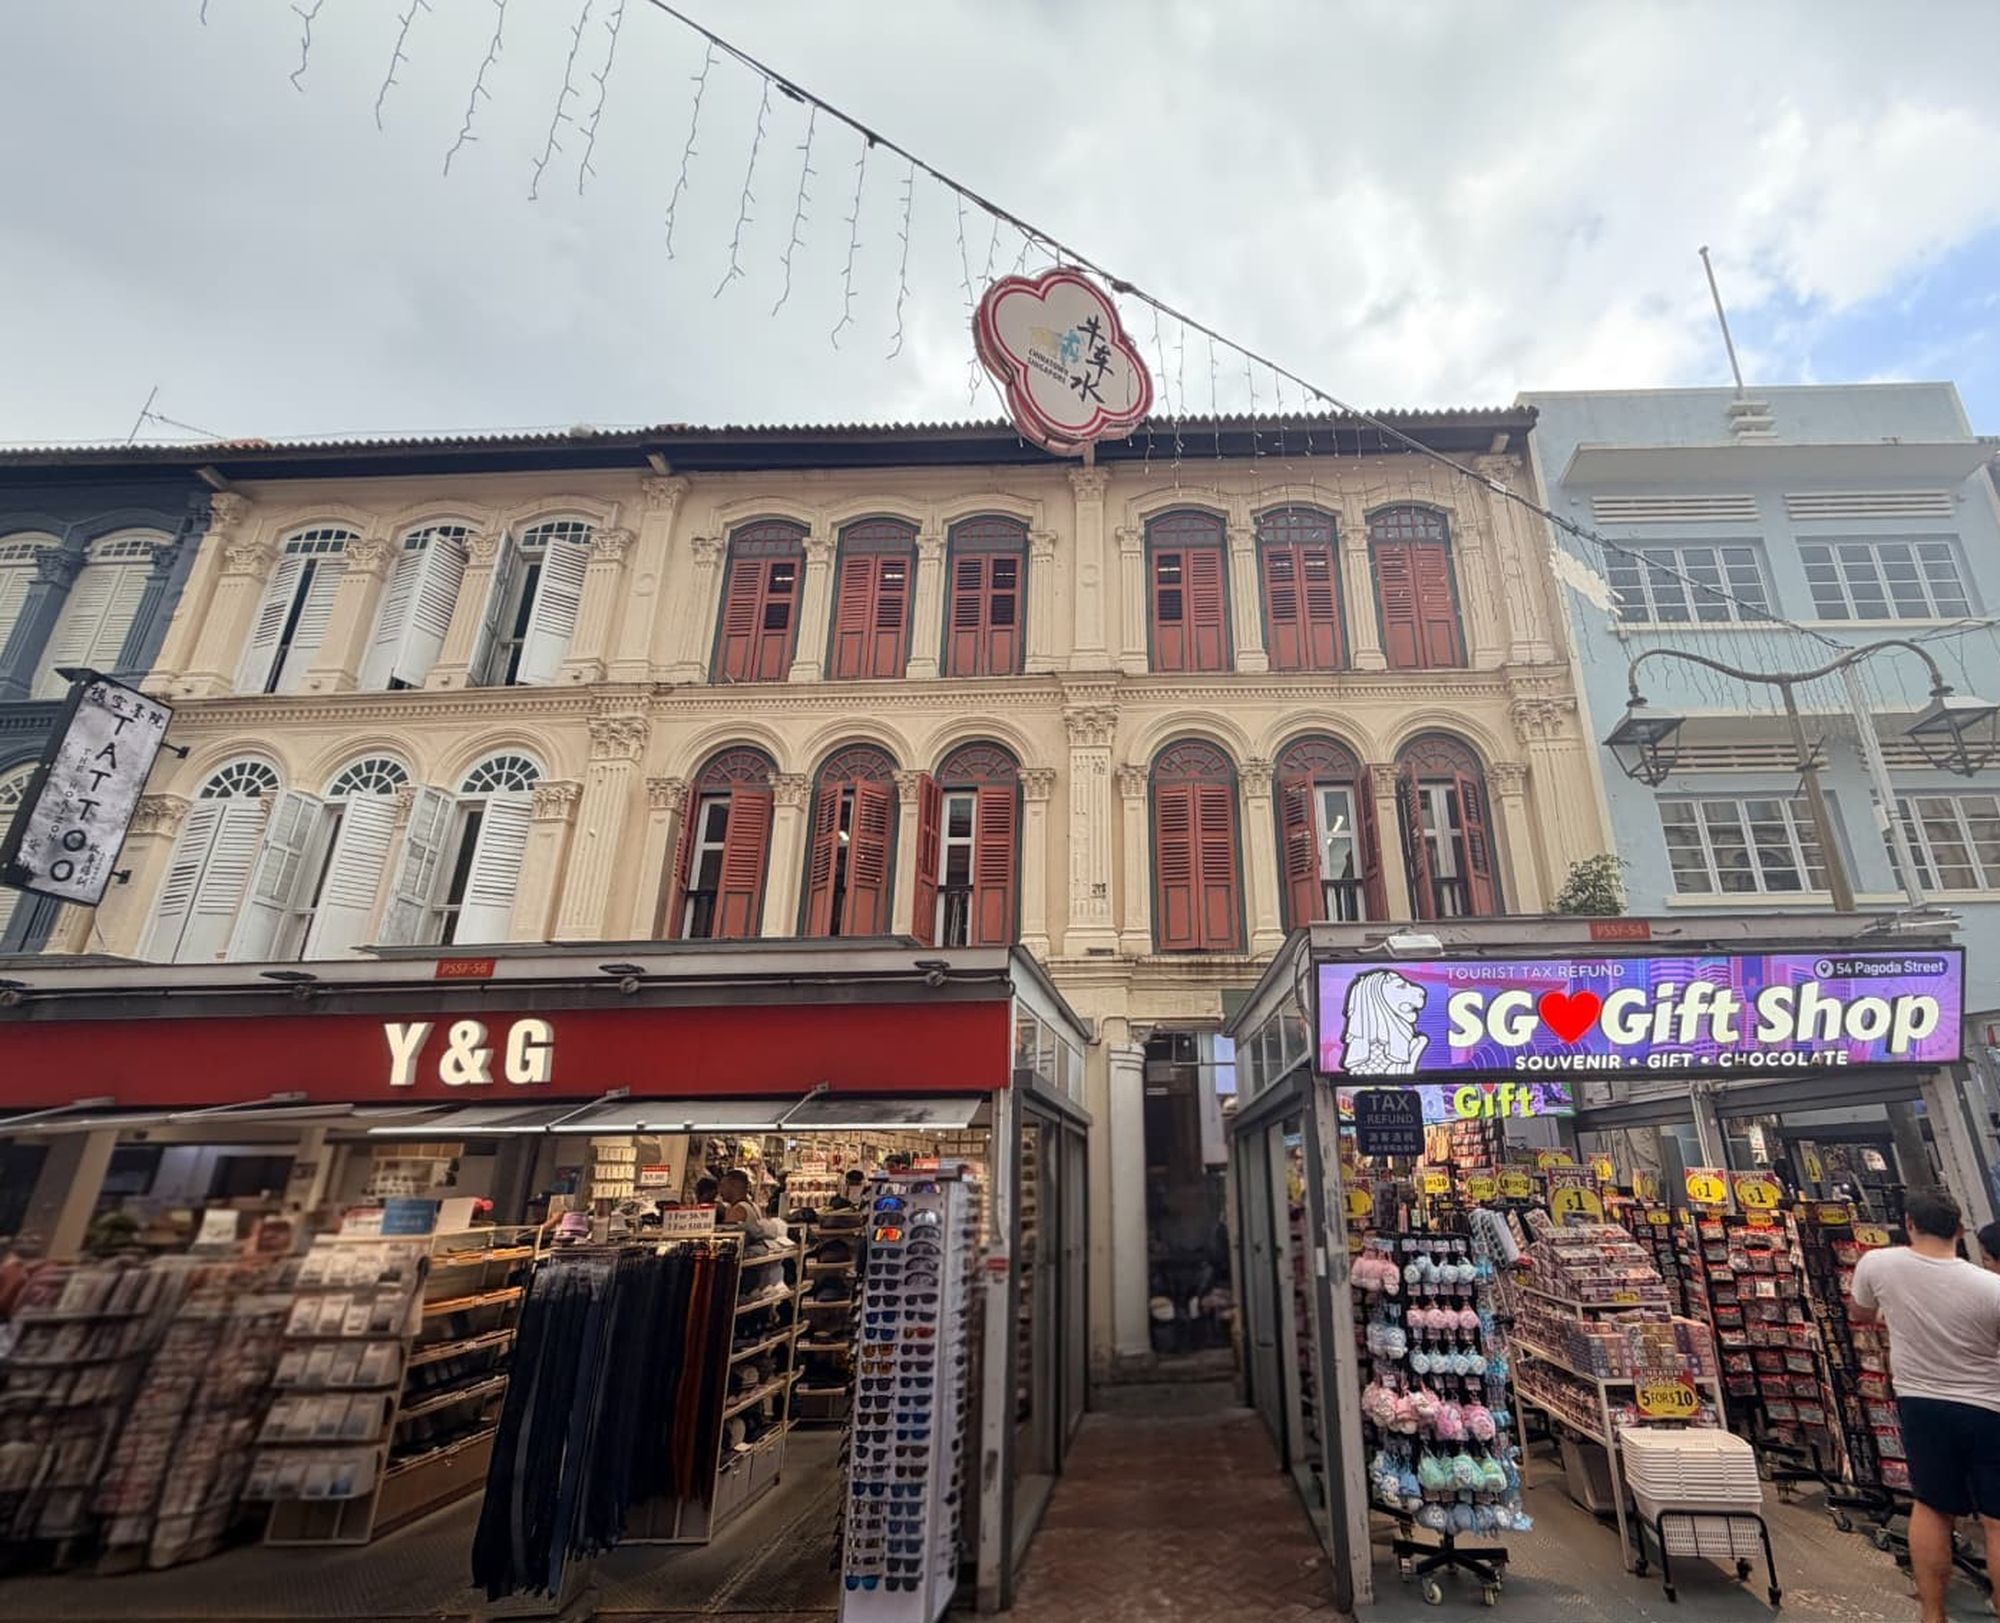
Note that in terms of year-on-year gains, it’s the OCR districts that are seeing the strongest growth. District 27 (Sembawang) and District 22 (Tuas, Boon Lay) beat out every other district; and the worst growth was in District 1 (Raffles Place, Boat Quay, Chinatown) and the nearby District 2 (Anson Road, Shenton Way).
If we focus on the projects in District 27, you’ll see that all of them have made pretty decent gains since then:
| Projects | 2020 | 2021 | 2022 | 2023 |
| CANBERRA RESIDENCES | $883 | $900 | $1,037 | $1,100 |
| D’BANYAN | $773 | $973 | $800 | $1,082 |
| EIGHT COURTYARDS | $992 | $1,032 | $1,159 | $1,221 |
| EUPHONY GARDENS | $665 | $728 | $824 | $889 |
| GOODLINK PARK | $626 | |||
| KANDIS RESIDENCE | $1,594 | $1,370 | ||
| NINE RESIDENCES | $932 | $1,170 | $1,223 | $1,243 |
| NORTH PARK RESIDENCES | $1,666 | $1,766 | ||
| NORTHWOOD | $898 | $984 | $1,124 | $1,075 |
| ORCHID PARK CONDO | $906 | $917 | ||
| ORCHID PARK CONDOMINIUM | $707 | $764 | $892 | $961 |
| SELETARIS | $860 | $909 | $1,135 | $1,117 |
| SEMBAWANG COTTAGE | $606 | $642 | $834 | |
| SKIES MILTONIA | $1,068 | $1,068 | $1,160 | $1,206 |
| SUN PLAZA | $681 | $736 | $750 | |
| SYMPHONY SUITES | $1,105 | $1,139 | $1,197 | $1,243 |
| THE ESTUARY | $976 | $1,021 | $1,129 | $1,184 |
| THE MILTONIA RESIDENCES | $936 | $956 | $1,103 | $1,160 |
| THE NAUTICAL | $959 | $1,044 | $1,152 | $1,268 |
| THE SENSORIA | $836 | $956 | $1,013 | |
| THE WISTERIA | $1,200 | $1,259 | $1,362 | |
| YISHUN EMERALD | $722 | $787 | $884 | $952 |
| YISHUN SAPPHIRE | $729 | $806 | $934 | $1,005 |
We would expect this trend to be even stronger in 2024, following the cooling measures in April 2023; the ABSD on foreigners is now 60 per cent, and these are a major demographic for prime districts like 1 and 2.
Nonetheless, based on the above, we can see that buyers seeking better appreciation would have done well by not focusing on prime locations. We gave some of the reasons in this article, but you can see above that there’s generally less room for appreciation in these already pricey districts.
We may also be seeing the effects of ongoing decentralisation
This has its roots way back in 1991, and we’re starting to see the fruits of this decade-long endeavour:
“Back then, it was realised that Singapore would face the potential problem of traffic congestion in and out of the Central Business District during peak hours. To tackle this problem before it came to a head, URA adopted a long-term strategy to decentralise commercial activities to commercial centres outside the city…
…As part of this long-term strategy, several locations strategically well spread throughout the island and well served by public transport networks were identified for development. Jurong and Paya Lebar were identified as two of these locations, together with others like Tampines and Novena. Today, the Novena Fringe Centre and Tampines Regional Centre have both been developed into vibrant office clusters supported by retail, food & beverage and entertainment amenities. The Jurong Lake District and Paya Lebar Central look set to become similarly successful areas in the future, and help mitigate possible congestion problems.” – URA, Planning for Sustainability
The impact is also reflected on the commercial side. In 2021, for instance, we heard analysts and veteran commercial investors question if prime area malls are, in fact, a worse investment choice than heartland malls.
While our glimpse of private home prices is on a smaller scale – just since 2020 – we can see the price movements reflect on the above changes.
It’s plausible that, in a few years, investors will be less focused on the district, and more on whether specific condos are near the heart of their given neighbourhood – much like HDB has abandoned the notion of pricing based on mature/non-mature towns, and simply relegated flats closer to the mall, MRT, etc. to Plus status.
It’s worth keeping in mind, before deciding that a prestigious District 9 or 10 condo is an infallible safeguard of value, as some salespeople continue to claim.
At Stacked, we like to look beyond the headlines and surface-level numbers, and focus on how things play out in the real world.
If you’d like to discuss how this applies to your own circumstances, you can reach out for a one-to-one consultation here.
And if you simply have a question or want to share a thought, feel free to write to us at stories@stackedhomes.com — we read every message.
1 Comments
Would u be able and comment on the future of Loyang regarding property prices in landed and non landed ?