New Launch Condo Profits Since 2017: A Look At How Over 1,000 Sub Sale Sellers Have Fared
February 3, 2023
With the housing supply still at an all-time low, some buyers are eager to snap up any units that are closer to completion – even if the seller foists Sellers Stamp Duty (SSD) costs onto them. As we saw last year, it’s been a rewarding market for those willing to dispose of their condos before they’re even built. This isn’t to say sub sales are entirely without risks or losses though, as these numbers show:
A note on subsales and SSD
By sub sales, we refer to the sale of a property before its’ actual completion. This is possible as construction usually takes three to four years; so a condo owner could sell their unit in this time (unlike flats there’s no Minimum Occupancy Period or related rules).
There is an SSD levied upon the sale proceeds. This is currently 12 per cent if sold in the first year, eight per cent in the second year, and four per cent in the third year. There’s no SSD for the fourth year and beyond (which is why most condo owners try to aim for the fourth year. It’s also usually the year closest to completion if you bought during launch, which is attractive to buyers in urgent need).
There’s also an often-overlooked advantage in sub sales. For properties under construction, a Progressive Payment Scheme (PPS) is used. The monthly loan repayments are not the full amount from the start – they increase over time, as different phases of construction are reached. This can work in favour of the original buyer, but to a highly variable degree (as different projects complete phases at different speeds). If you are the sort that works out your return on investment in the form of actual cash put in, this would be another advantage to think about.
Sub-sale units since March 2017
The following table reflects sub-sale profits in various projects, with results taken since 11 March 2017. We use this specific date as it’s the last time the SSD was revised (prior to this revision, the SSD rate was higher and stretched for four years).
Regarding some projects, such as Principal Gardens, this may mean not all sub-sale transactions of the development were reflected in the data; this is because some of the sub-sales may have occurred before the March 2017 revision.
| Project | No. of Units | Gain | Loss | ||
| % Returns Aft. SSD | Vol. | % Returns Aft. SSD | Vol. | ||
| BOULEVARD 88 | 154 | 30.7% | 2 | ||
| WHISTLER GRAND | 716 | 23.3% | 48 | -1.2% | 1 |
| STIRLING RESIDENCES | 1,259 | 19.9% | 76 | -0.9% | 1 |
| MARTIN MODERN | 450 | 19.4% | 31 | -5.2% | 5 |
| PARC ESTA | 1,399 | 19.2% | 74 | ||
| FOREST WOODS | 519 | 18.6% | 8 | ||
| THE FLORENCE RESIDENCES | 1,410 | 18.6% | 20 | ||
| SEASIDE RESIDENCES | 841 | 18.4% | 73 | -10.2% | 3 |
| JADESCAPE | 1,206 | 18.1% | 34 | -10.1% | 1 |
| NORTH PARK RESIDENCES | 920 | 17.2% | 17 | -2.1% | 1 |
| THE ALPS RESIDENCES | 626 | 17.2% | 25 | ||
| TWIN VEW | 520 | 17.0% | 45 | ||
| ARTRA | 400 | 17.0% | 23 | ||
| STURDEE RESIDENCES | 305 | 16.4% | 3 | ||
| PARC BOTANNIA | 735 | 16.2% | 62 | ||
| TREASURE AT TAMPINES | 2,203 | 16.2% | 24 | ||
| PARK COLONIAL | 805 | 16.2% | 50 | -4.7% | 2 |
| KI RESIDENCES AT BROOKVALE | 660 | 16.0% | 1 | ||
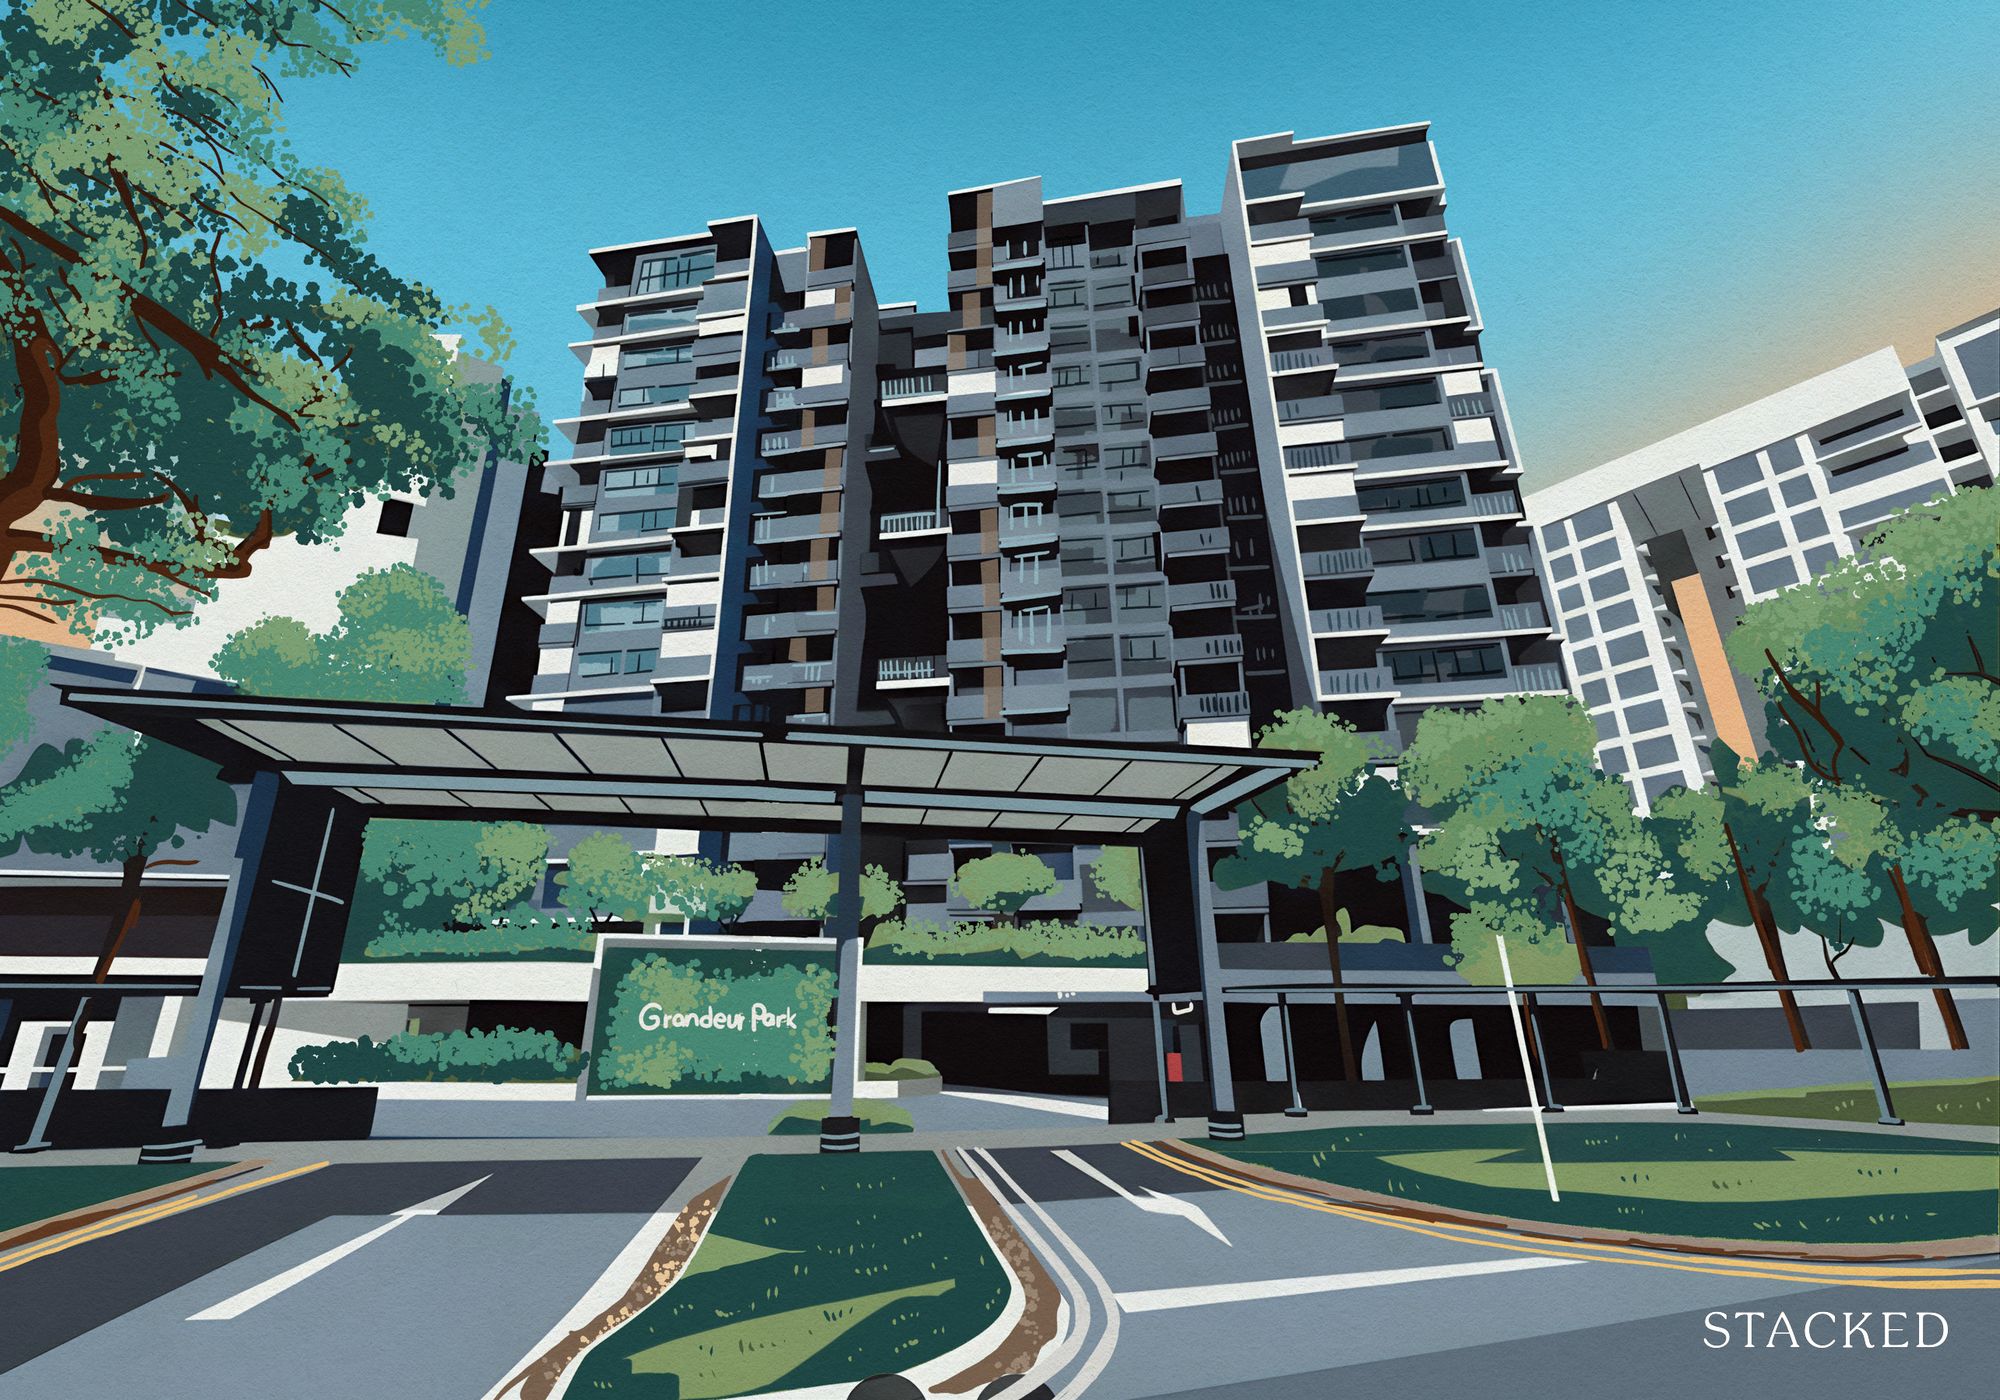
| GRANDEUR PARK RESIDENCES | 720 | 15.4% | 23 | ||
| THE TRE VER | 729 | 15.1% | 36 | -0.3% | 1 |
| THE JOVELL | 428 | 14.9% | 5 | ||
| PARC CLEMATIS | 1,468 | 14.3% | 3 | ||
| RIVERFRONT RESIDENCES | 1,472 | 14.2% | 127 | -8.3% | 1 |
| GEM RESIDENCES | 578 | 13.7% | 40 | -7.2% | 1 |
| CASA AL MARE | 49 | 13.5% | 1 | ||
| MAYFAIR MODERN | 171 | 13.5% | 1 | ||
| LE QUEST | 516 | 13.4% | 6 | ||
| DAINTREE RESIDENCE | 327 | 13.1% | 1 | -4.1% | 1 |
| AFFINITY AT SERANGOON | 1,052 | 12.9% | 33 | -1.7% | 1 |
| THE TAPESTRY | 861 | 12.7% | 18 | -11.8% | 1 |
| QUEENS PEAK | 736 | 12.6% | 16 | ||
| PARK PLACE RESIDENCES AT PLQ | 429 | 12.3% | 26 | -1.2% | 1 |
| KANDIS RESIDENCE | 130 | 12.2% | 3 | ||
| ARENA RESIDENCES | 98 | 12.2% | 2 | -1.1% | 1 |
| JUI RESIDENCES | 117 | 11.6% | 2 | ||
| STARS OF KOVAN | 395 | 11.5% | 11 | ||
| THE CLEMENT CANOPY | 505 | 11.3% | 5 | ||
| THE VERANDAH RESIDENCES | 170 | 11.2% | 4 | ||
| MARGARET VILLE | 309 | 11.1% | 4 | ||
| KENT RIDGE HILL RESIDENCES | 548 | 10.5% | 3 | ||
| PARC RIVIERA | 752 | 9.8% | 8 | -1.7% | 1 |
| REZI 24 | 110 | 9.4% | 1 | ||
| FOURTH AVENUE RESIDENCES | 476 | 8.5% | 2 | -11.0% | 1 |
| AMBER PARK | 592 | 8.4% | 1 | ||
| PARC KOMO | 276 | 8.2% | 1 | ||
| THE GARDEN RESIDENCES | 613 | 8.2% | 4 | ||
| SENGKANG GRAND RESIDENCES | 680 | 7.8% | 2 | ||
| MAYFAIR GARDENS | 215 | 6.4% | 5 | ||
| AMBER 45 | 139 | 6.1% | 1 | ||
| THE WOODLEIGH RESIDENCES | 667 | 5.5% | 1 | -2.4% | 1 |
| KINGSFORD WATERBAY | 1,165 | 5.4% | 1 | -1.6% | 1 |
| SKY EVERTON | 262 | 4.8% | 3 | -6.5% | 2 |
| AVENUE SOUTH RESIDENCE | 1,074 | 4.5% | 1 | ||
| KOPAR AT NEWTON | 378 | 3.9% | 1 | ||
| 33 RESIDENCES | 27 | -7.5% | 1 | ||
| BUKIT 828 | 34 | -12.3% | 1 | ||
| LEEDON GREEN | 638 | -5.8% | 1 | ||
| MIDTOWN BAY | 219 | -8.8% | 1 | ||
| MIDWOOD | 564 | -1.8% | 1 | ||
| ONE MEYER | 66 | -3.0% | 1 | ||
| PRINCIPAL GARDEN | 663 | -7.0% | 1 | ||
| RIVIERE | 455 | -10.8% | 1 | ||
| VIIO @ BALESTIER | 78 | -0.6% | 1 |
Some key details from the results
- Boulevard 88
and Parc Estaleads the pack - Results may look unusually good due to the market high and timing
- Potential gains tend to be higher in larger developments
- Most sub sale buyers will wait for the fourth year
- Some of the top winners are also among the top losers
1. Boulevard 88, Parc Esta, and Whistler Grand lead the pack
Boulevard 88 has a unit with a recorded gross sub-sale profit of $3,460,000 – in terms of sheer amount, this has never been beaten since 2017. This is likely a matter of the project’s target audience: with units that breach the $13 million mark, the buyers here probably aren’t fazed by having to fork out an extra million or two.
More from Stacked
Where You Can Buy A Resale 3-Bedder For The Price Of A New 2-Bedder In 2025
In this Stacked Pro breakdown:
(It also helps that the transaction took place outside of the SSD window)
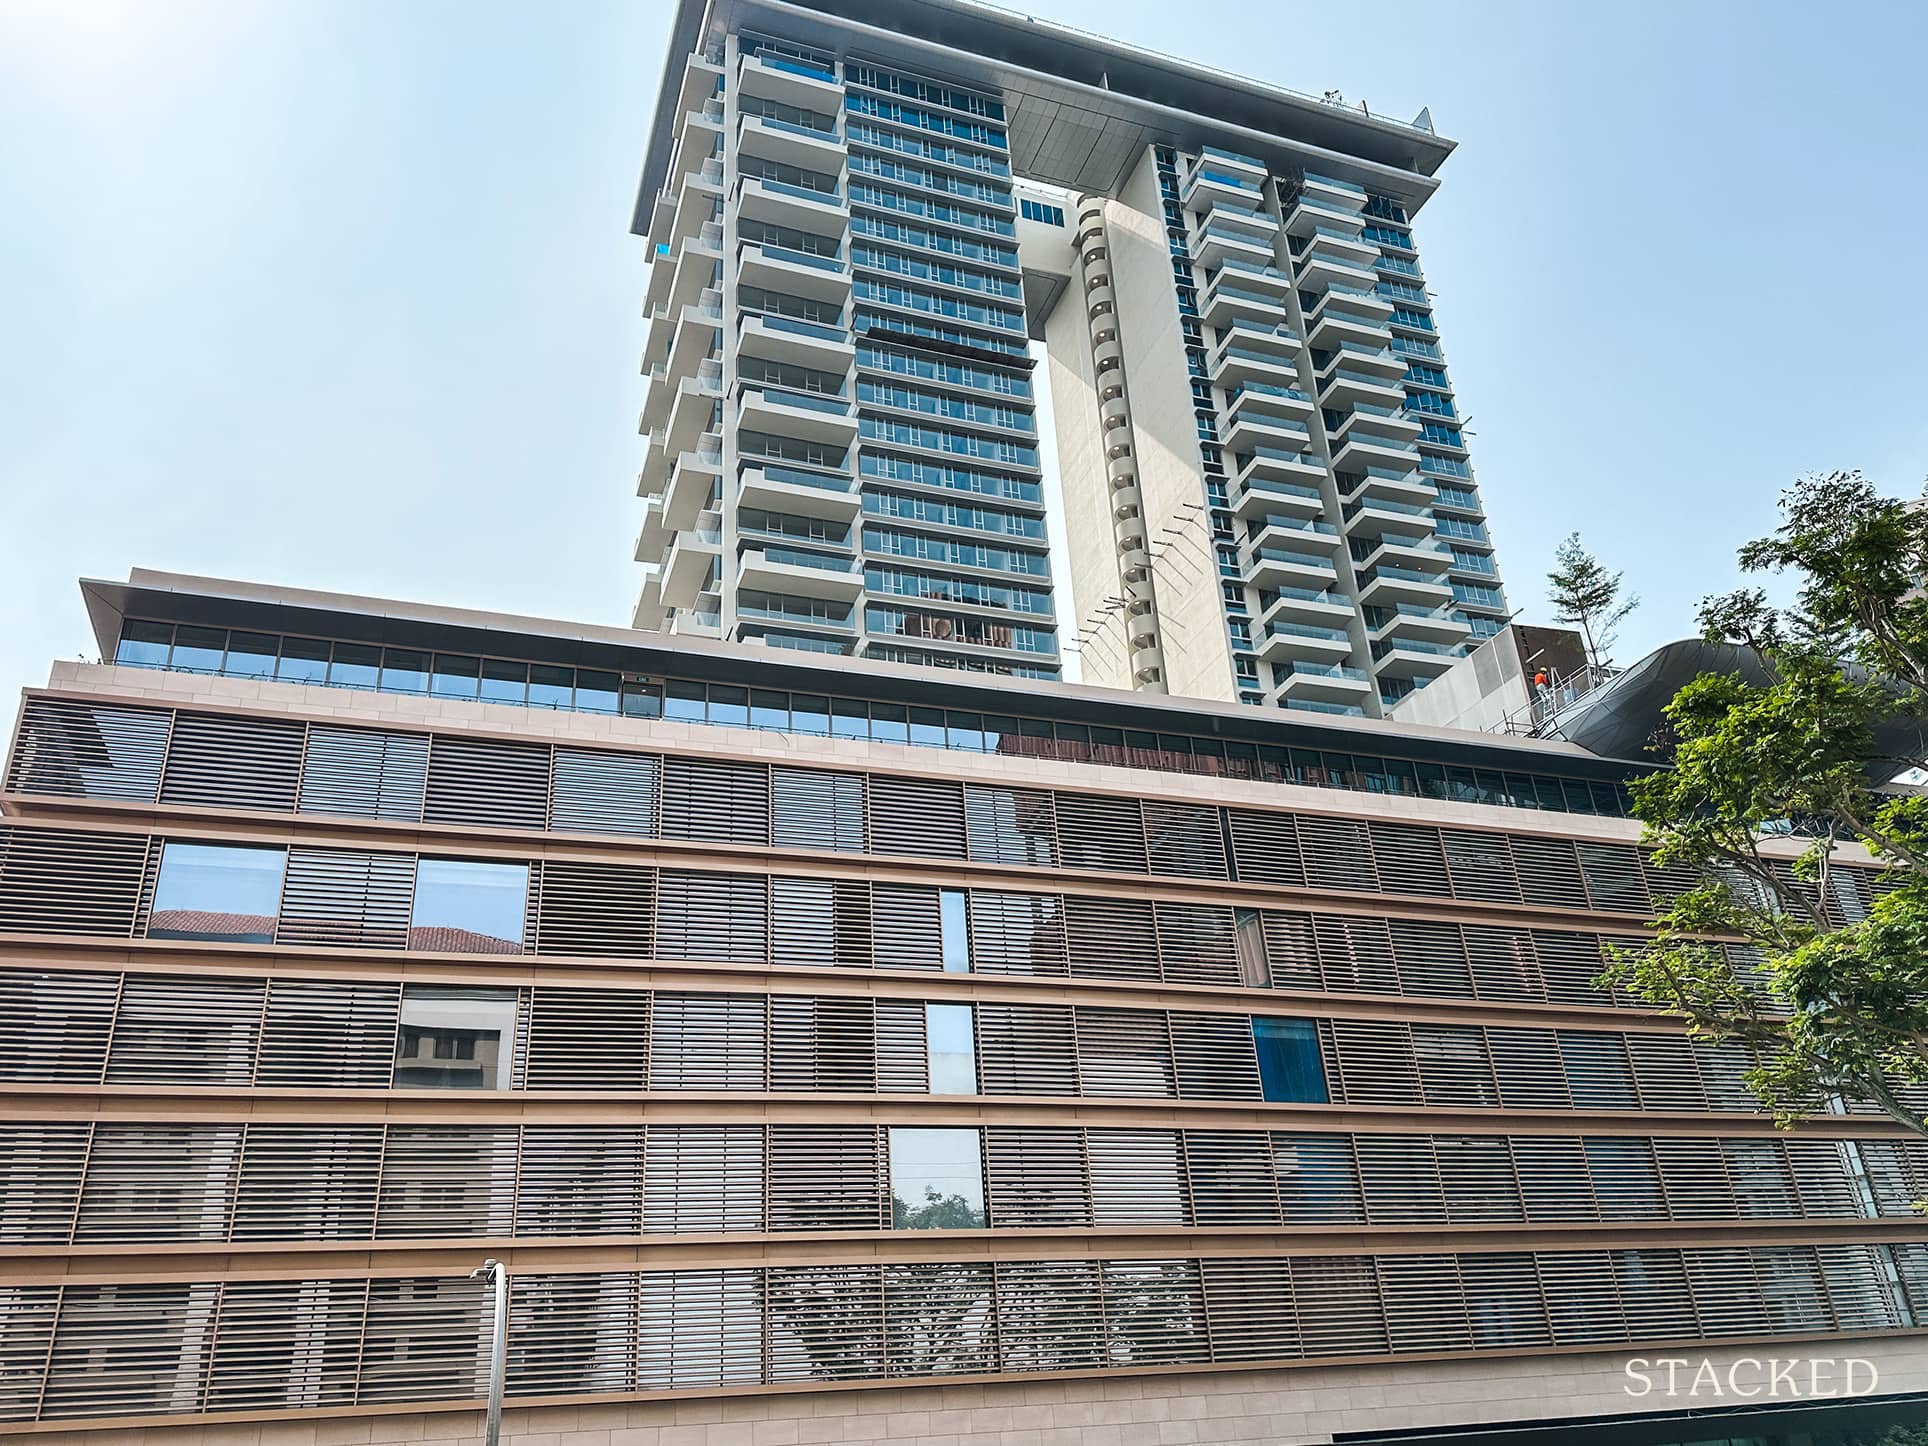
This is likely due to the reports of rich Chinese buyers flocking over to Singapore, and Boulevard 88 is the sort of trophy home that would attract them (designed by Moshe Safdie, with an MBS-like rooftop swimming pool in Orchard). At these price points of $13 million for a 4-bedroom unit, most local buyers would usually be looking to buy a landed home.
However, we’d caution that there are only two sub-sale transactions, so we won’t know if the same would have held true of other units. With super lux properties, transactions, and unit counts being so low, the numbers are often volatile.
In terms of Parc Esta, one of its units tops the list with a percentage gain of over 42 per cent. This is after a holding period of a little over three years, so SSD wasn’t involved.
We’re not too surprised to see Parc Esta on the list, as it sold out quite fast and many buyers missed the opportunity. It’s also one of the few condos close to the Eunos MRT (and by extension the vibrant Paya Lebar Quarter).
Whistler Grand is the last among the trio in the West Coast area (along with Parc Riviera and Twin VEW) that has rewarded its buyers for buying in early and at a low psf. Those who bought in 2018 at a low of $1,2xx psf have managed to transact at more than $1,7xx psf in late 2022 – with gains of more than $600,000.
Editor’s Note 13 Feb 2023: It was previously reported that Parc Esta had a gain of 42.3% between 19 August 2019 to 18 Jan 2023 for the 635 sqft unit. This is incorrect. The difference was made over 2 transactions. The first was between 19 August 2019 to 22 December 2022 for a 23.9% gain, and another between 22 December 2022 and 18 Jan 2023 for a 14.8% gain, excluding SSD. Due to the short holding period of the 2nd transaction, almost all gains are wiped out due to the SSD for the second transaction. We apologise for any inconvenience caused.
2. Results may look unusually good due to the market high and timing
The overwhelming number of original buyers made profits, which shouldn’t be surprising given the market situation. Private housing supply is at historical lows, and desperate home buyers will be glad to find units closer to completion.
The 2022/23 period might be exceptional, and may not reflect sub-sale profits in more normal market cycles. If you’re intending to “flip” a property this way, be aware that the risk could be higher than present numbers reflect.
3. Potential gains tend to be higher in larger developments
| Size | Gain | Loss | ||
| % Returns Aft. SSD | Vol. | % Returns Aft. SSD | Vol. | |
| Massive (>1,000 Units) | 16.8% | 393 | -4.5% | 5 |
| Large (300 – 1,000 Units) | 16.3% | 599 | -5.6% | 24 |
| Medium (50 – 300 Units) | 11.0% | 25 | -4.4% | 6 |
| Small (<50 Units) | 13.5% | 1 | -9.9% | 2 |
Subsale gains seemed to be stronger for developments with more than 300 units, and among the lowest for projects with 50 to 300 units. Even boutique projects, with 50 units or less, tend to fare better than 50 to 300-unit projects.
For boutique condos, it’s not a surprise they outdid small condos – most such exclusive projects are also higher priced, and targeted at wealthier buyers. This demographic can afford what it wants, as we saw with Boulevard 88.
But it does suggest that for those who want to try sub-sales, going for bigger unit counts is their best bet.
Property Investment InsightsJust 5% Of All Property Transactions In 2022 Were Unprofitable: Here’s 5 Interesting Learning Lessons
by Ryan J. Ong4. Most sub-sale buyers are still waiting for the fourth year
As the SSD period ends in the third year, this is not surprising. Of the 1,058 transactions on the list, only 75 of them (around seven per cent) took place within the SSD.
Of these 75 sellers, only 17 saw losses taking into account the Seller’s Stamp Duty (which shows the strength of the performances so far of these new launches).
| Gain/Loss Before SSD | Gain/Loss After SSD | Change | |||
| Project | Gain | Loss | Gain | Loss | Gains To Loss After SSD |
| ARENA RESIDENCES | 3 | 2 | 1 | 1 | |
| DAINTREE RESIDENCE | 2 | 1 | 1 | 1 | |
| JADESCAPE | 35 | 34 | 1 | 1 | |
| KINGSFORD WATERBAY | 2 | 1 | 1 | 1 | |
| LEEDON GREEN | 1 | 1 | 1 | ||
| MIDWOOD | 1 | 1 | 1 | ||
| PARC RIVIERA | 9 | 8 | 1 | 1 | |
| PARK COLONIAL | 51 | 1 | 50 | 2 | 1 |
| PRINCIPAL GARDEN | 1 | 1 | 1 | ||
| RIVERFRONT RESIDENCES | 128 | 127 | 1 | 1 | |
| SEASIDE RESIDENCES | 74 | 2 | 73 | 3 | 1 |
| STIRLING RESIDENCES | 77 | 76 | 1 | 1 | |
| THE TRE VER | 37 | 36 | 1 | 1 | |
| VIIO @ BALESTIER | 1 | 1 | 1 | ||
| WHISTLER GRAND | 49 | 48 | 1 | 1 | |
| MARTIN MODERN | 33 | 3 | 31 | 5 | 2 |
Going forward though, we may see more transactions that are within the third year of the SSD. Even a four per cent tax may seem insignificant, in the face of 2023’s sky-high prices.
5. Some of the top winners are also among the top losers
At first glance, it might seem strange how some top winners, such as Martin Modern, are also among the greatest loser by quantum loss. Seaside Residences has the same puzzling trait, appearing on both the best winners and worst losers.
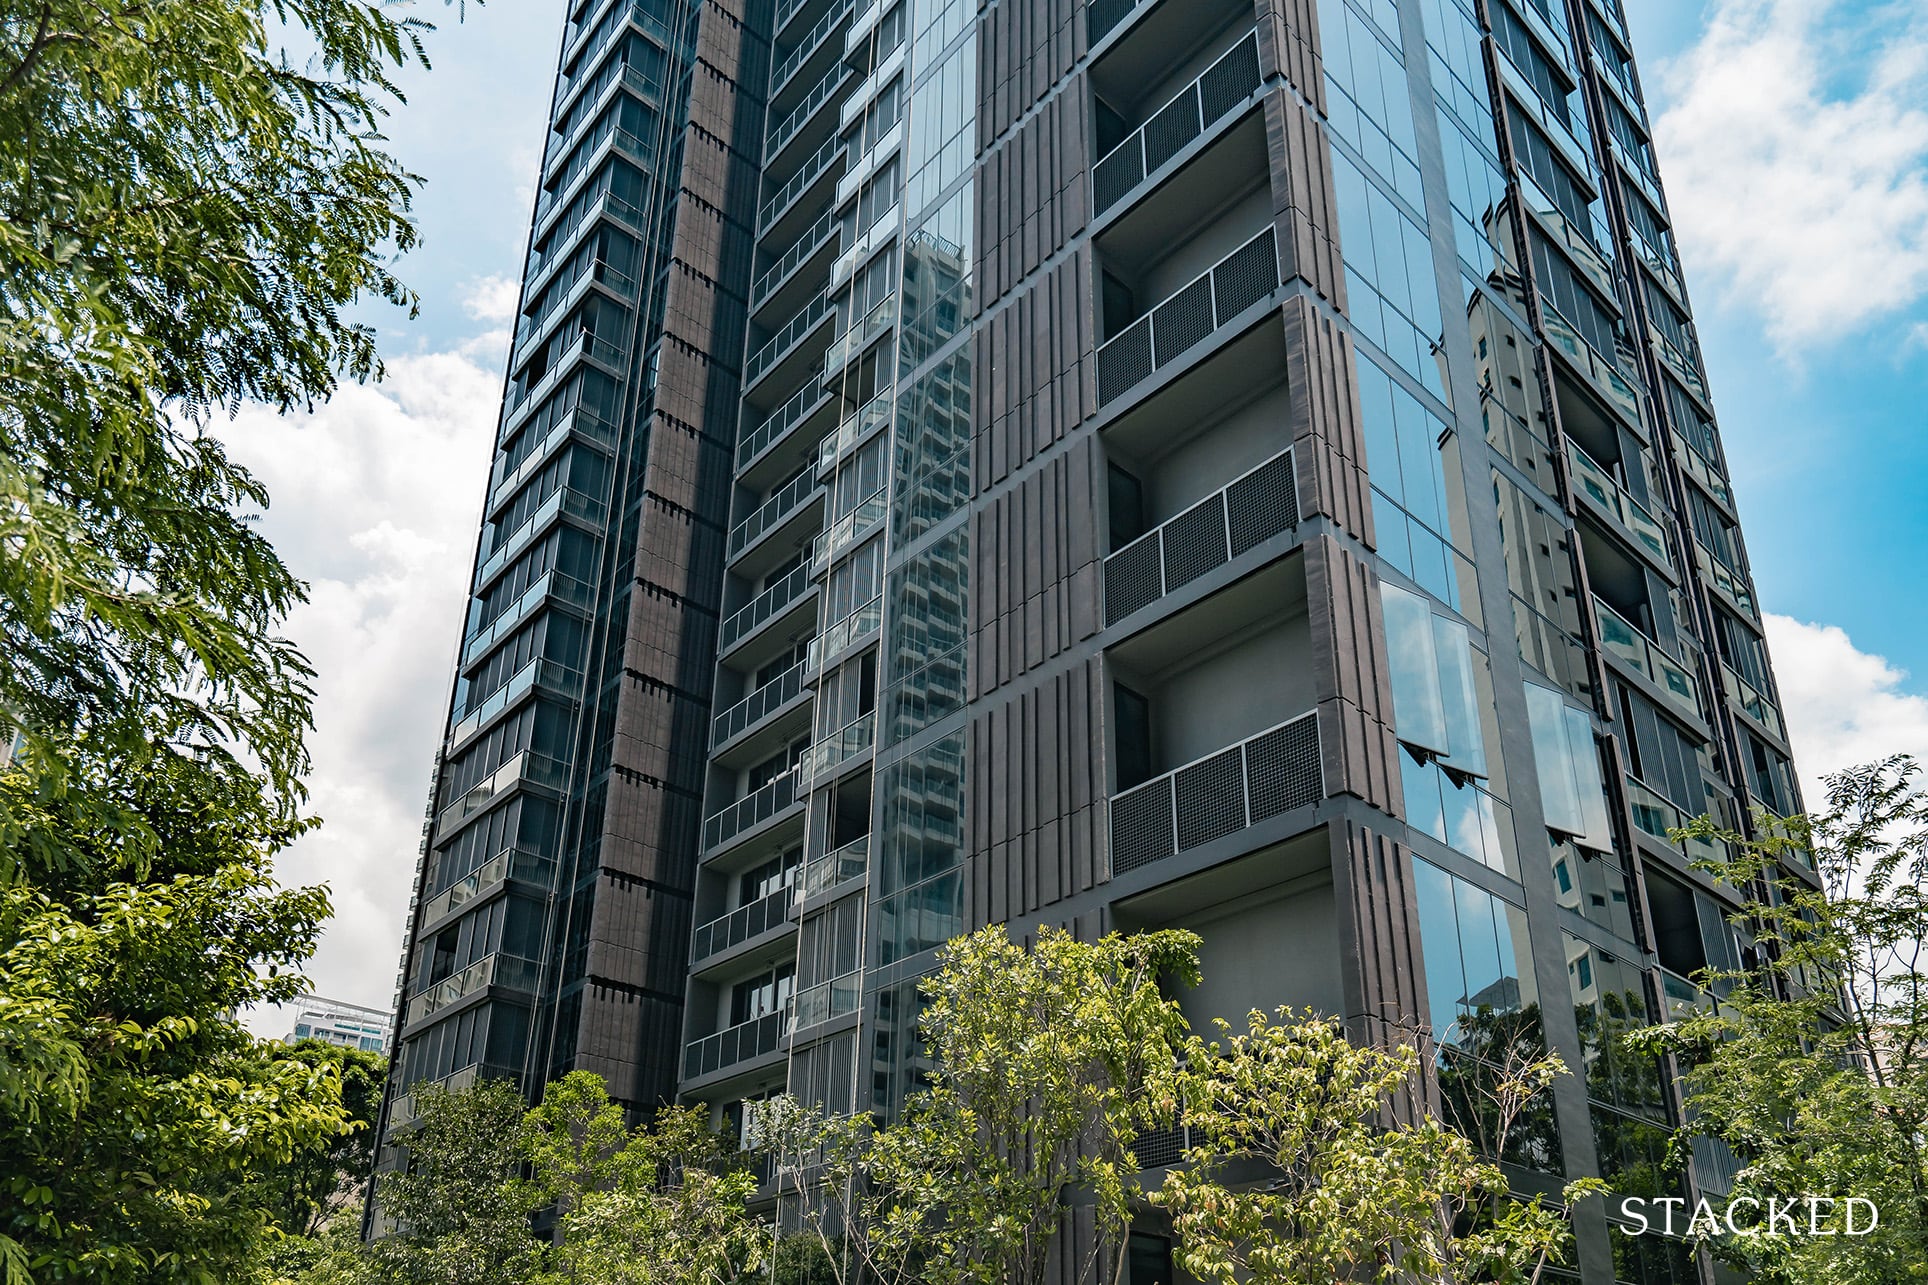
But don’t let the appearances of some losses fool you – it boils down to specific units and quite a bit of luck (read: the desperation of the buyer). Being a “top loser” for sub sale doesn’t always reflect on project quality.
Once you look deeper into the top 5 losses, you’ll see that save for Martin Modern, these were all sold within the SSD period. In fact, Seaside Residences and Jadescape were sold before a year was even up.
As such, it is rather obvious to point out that these weren’t issues with the development, but were more likely born out of unfortunate circumstances (divorce cases, etc).
With regards to Martin Modern given that the vast majority have been profitable (and quite significantly so as well), it seems more plausible that this was due to the timing of when it was sold. November 2020 was still during the uncertain Covid-19 period, and this may have had some effect on the price.
Finally, for those who are curious to know which were the biggest winners and losers in terms of transactions, here they are:
Top 5 quantum gains
| Project Name | Price | Size (Sq Ft) | $PSF | Sale Date | Buy Price | Buy Date | Holding Period (Years) | Gains Aft SSD |
| BOULEVARD 88 | $13,780,000 | 2799 | $4,924 | 9 Dec 2022 | $10,320,000 | 29/7/19 | 3.4 | $3,460,000 |
| BOULEVARD 88 | $12,500,000 | 2777 | $4,501 | 12 Jan 2022 | $9,380,000 | 6/6/19 | 2.6 | $2,620,000 |
| MARTIN MODERN | $4,900,000 | 1733 | $2,827 | 11-Nov-21 | $3,753,260 | 21/7/17 | 4.3 | $1,146,740 |
| MARTIN MODERN | $4,230,000 | 1399 | $3,023 | 11-Aug-21 | $3,161,362 | 21/7/17 | 4.1 | $1,068,638 |
| MARTIN MODERN | $3,980,000 | 1421 | $2,801 | 24-May-21 | $3,190,560 | 23/7/17 | 3.8 | $789,440 |
Top 5 quantum losses
| Project Name | Price | Size (Sq Ft) | $PSF | Sale Date | Buy Price | Buy Date | Holding Period (Years) | Loss Aft SSD |
| RIVIERE | $3,900,000 | 1711 | $2,279 | 14 Dec 2022 | $4,197,600 | 5/11/20 | 2.1 | -$453,600 |
| SEASIDE RESIDENCES | $1,988,800 | 1270 | $1,566 | 19-Apr-21 | $2,108,800 | 29/8/20 | 0.6 | -$358,656 |
| BUKIT 828 | $1,890,000 | 1335 | $1,416 | 10 Feb 2022 | $1,982,000 | 28/6/20 | 1.6 | -$243,200 |
| MARTIN MODERN | $1,650,000 | 764 | $2,159 | 16-Nov-20 | $1,876,800 | 14/10/17 | 3.1 | -$226,800 |
| JADESCAPE | $2,180,000 | 1259 | $1,731 | 10-Dec-21 | $2,135,000 | 4/3/21 | 0.8 | -$216,600 |
Top 5 percentage gains
| Project Name | Price | Size (Sq Ft) | $PSF | Sale Date | Buy Price | Buy Date | Holding Period (Years) | % Gains Aft SSD |
| WHISTLER GRAND | $2,220,000 | 1281 | $1,733 | 5 Dec 2022 | $1,588,000 | 14/12/18 | 4 | 39.80% |
| WHISTLER GRAND | $1,136,500 | 603 | $1,885 | 15 Nov 2022 | $819,200 | 3/11/18 | 4 | 38.70% |
| WHISTLER GRAND | $2,200,000 | 1270 | $1,732 | 5 Sept 2022 | $1,589,600 | 11/12/18 | 3.7 | 38.40% |
| SEASIDE RESIDENCES | $1,718,000 | 786 | $2,186 | 17-Mar-21 | $1,246,410 | 22/4/17 | 3.9 | 37.80% |
| GRANDEUR PARK RESIDENCES | $2,768,000 | 1,744 | $1,587 | 16-Jul-21 | $2,013,000 | 3/5/17 | 4.2 | 37.51% |
Top 5 percentage losses
| Project Name | Price | Size (Sq Ft) | $PSF | Sale Date | Buy Price | Buy Date | Holding Period (Years) | % Loss Aft SSD |
| SEASIDE RESIDENCES | $1,988,800 | 1270 | $1,566 | 19-Apr-21 | $2,108,800 | 29/8/20 | 0.6 | -17.00% |
| BUKIT 828 | $1,890,000 | 1335 | $1,416 | 10 Feb 2022 | $1,982,000 | 28/6/20 | 1.6 | -12.30% |
| MARTIN MODERN | $1,650,000 | 764 | $2,159 | 16-Nov-20 | $1,876,800 | 14/10/17 | 3.1 | -12.10% |
| THE TAPESTRY | $780,000 | 603 | $1,294 | 10-Dec-20 | $848,800 | 24/3/18 | 2.7 | -11.80% |
| FOURTH AVENUE RESIDENCES | $1,580,000 | 689 | $2,294 | 12-Oct-20 | $1,634,000 | 1/5/19 | 1.5 | -11.00% |
In the meantime, you can check out in-depth reviews of the above condos on Stacked. If you missed out on any new launches, you can also reach out to us – perhaps some of the original buyers may be looking to sell early.
At Stacked, we like to look beyond the headlines and surface-level numbers, and focus on how things play out in the real world.
If you’d like to discuss how this applies to your own circumstances, you can reach out for a one-to-one consultation here.
And if you simply have a question or want to share a thought, feel free to write to us at stories@stackedhomes.com — we read every message.
Frequently asked questions
What are sub sales in Singapore real estate and how do they work?
Which Singapore condo projects have shown the highest profits from sub sales since 2017?
Do larger condo developments tend to yield higher profits in sub sales?
When do most buyers typically sell their units in the sub sale market?
Can a property's profit or loss in sub sales be affected by market timing or specific circumstances?
Ryan J. Ong
A seasoned content strategist with over 17 years in the real estate and financial journalism sectors, Ryan has built a reputation for transforming complex industry jargon into accessible knowledge. With a track record of writing and editing for leading financial platforms and publications, Ryan's expertise has been recognised across various media outlets. His role as a former content editor for 99.co and a co-host for CNA 938's Open House programme underscores his commitment to providing valuable insights into the property market.Need help with a property decision?
Speak to our team →Read next from Property Investment Insights

Property Investment Insights We Compared Lease Decay Across HDB Towns — The Differences Are Significant

Property Investment Insights This Singapore Condo Skipped 1-Bedders And Focused On Space — Here’s What Happened 8 Years Later
Property Investment Insights Why Buyers in the Same Condo Ended Up With Very Different Results

Property Investment Insights What Happens When a “Well-Priced” Condo Hits the Resale Market
Latest Posts

Singapore Property News Nearly 1,000 New Homes Were Sold Last Month — What Does It Say About the 2026 New Launch Market?

Property Market Commentary How I’d Invest $12 Million On Property If I Won The 2026 Toto Hongbao Draw

Overseas Property Investing Savills Just Revealed Where China And Singapore Property Markets Are Headed In 2026


0 Comments