A Behind the Scenes: ‘What Really Caused Singapore’s Impending Property Oversupply’?
December 27, 2019
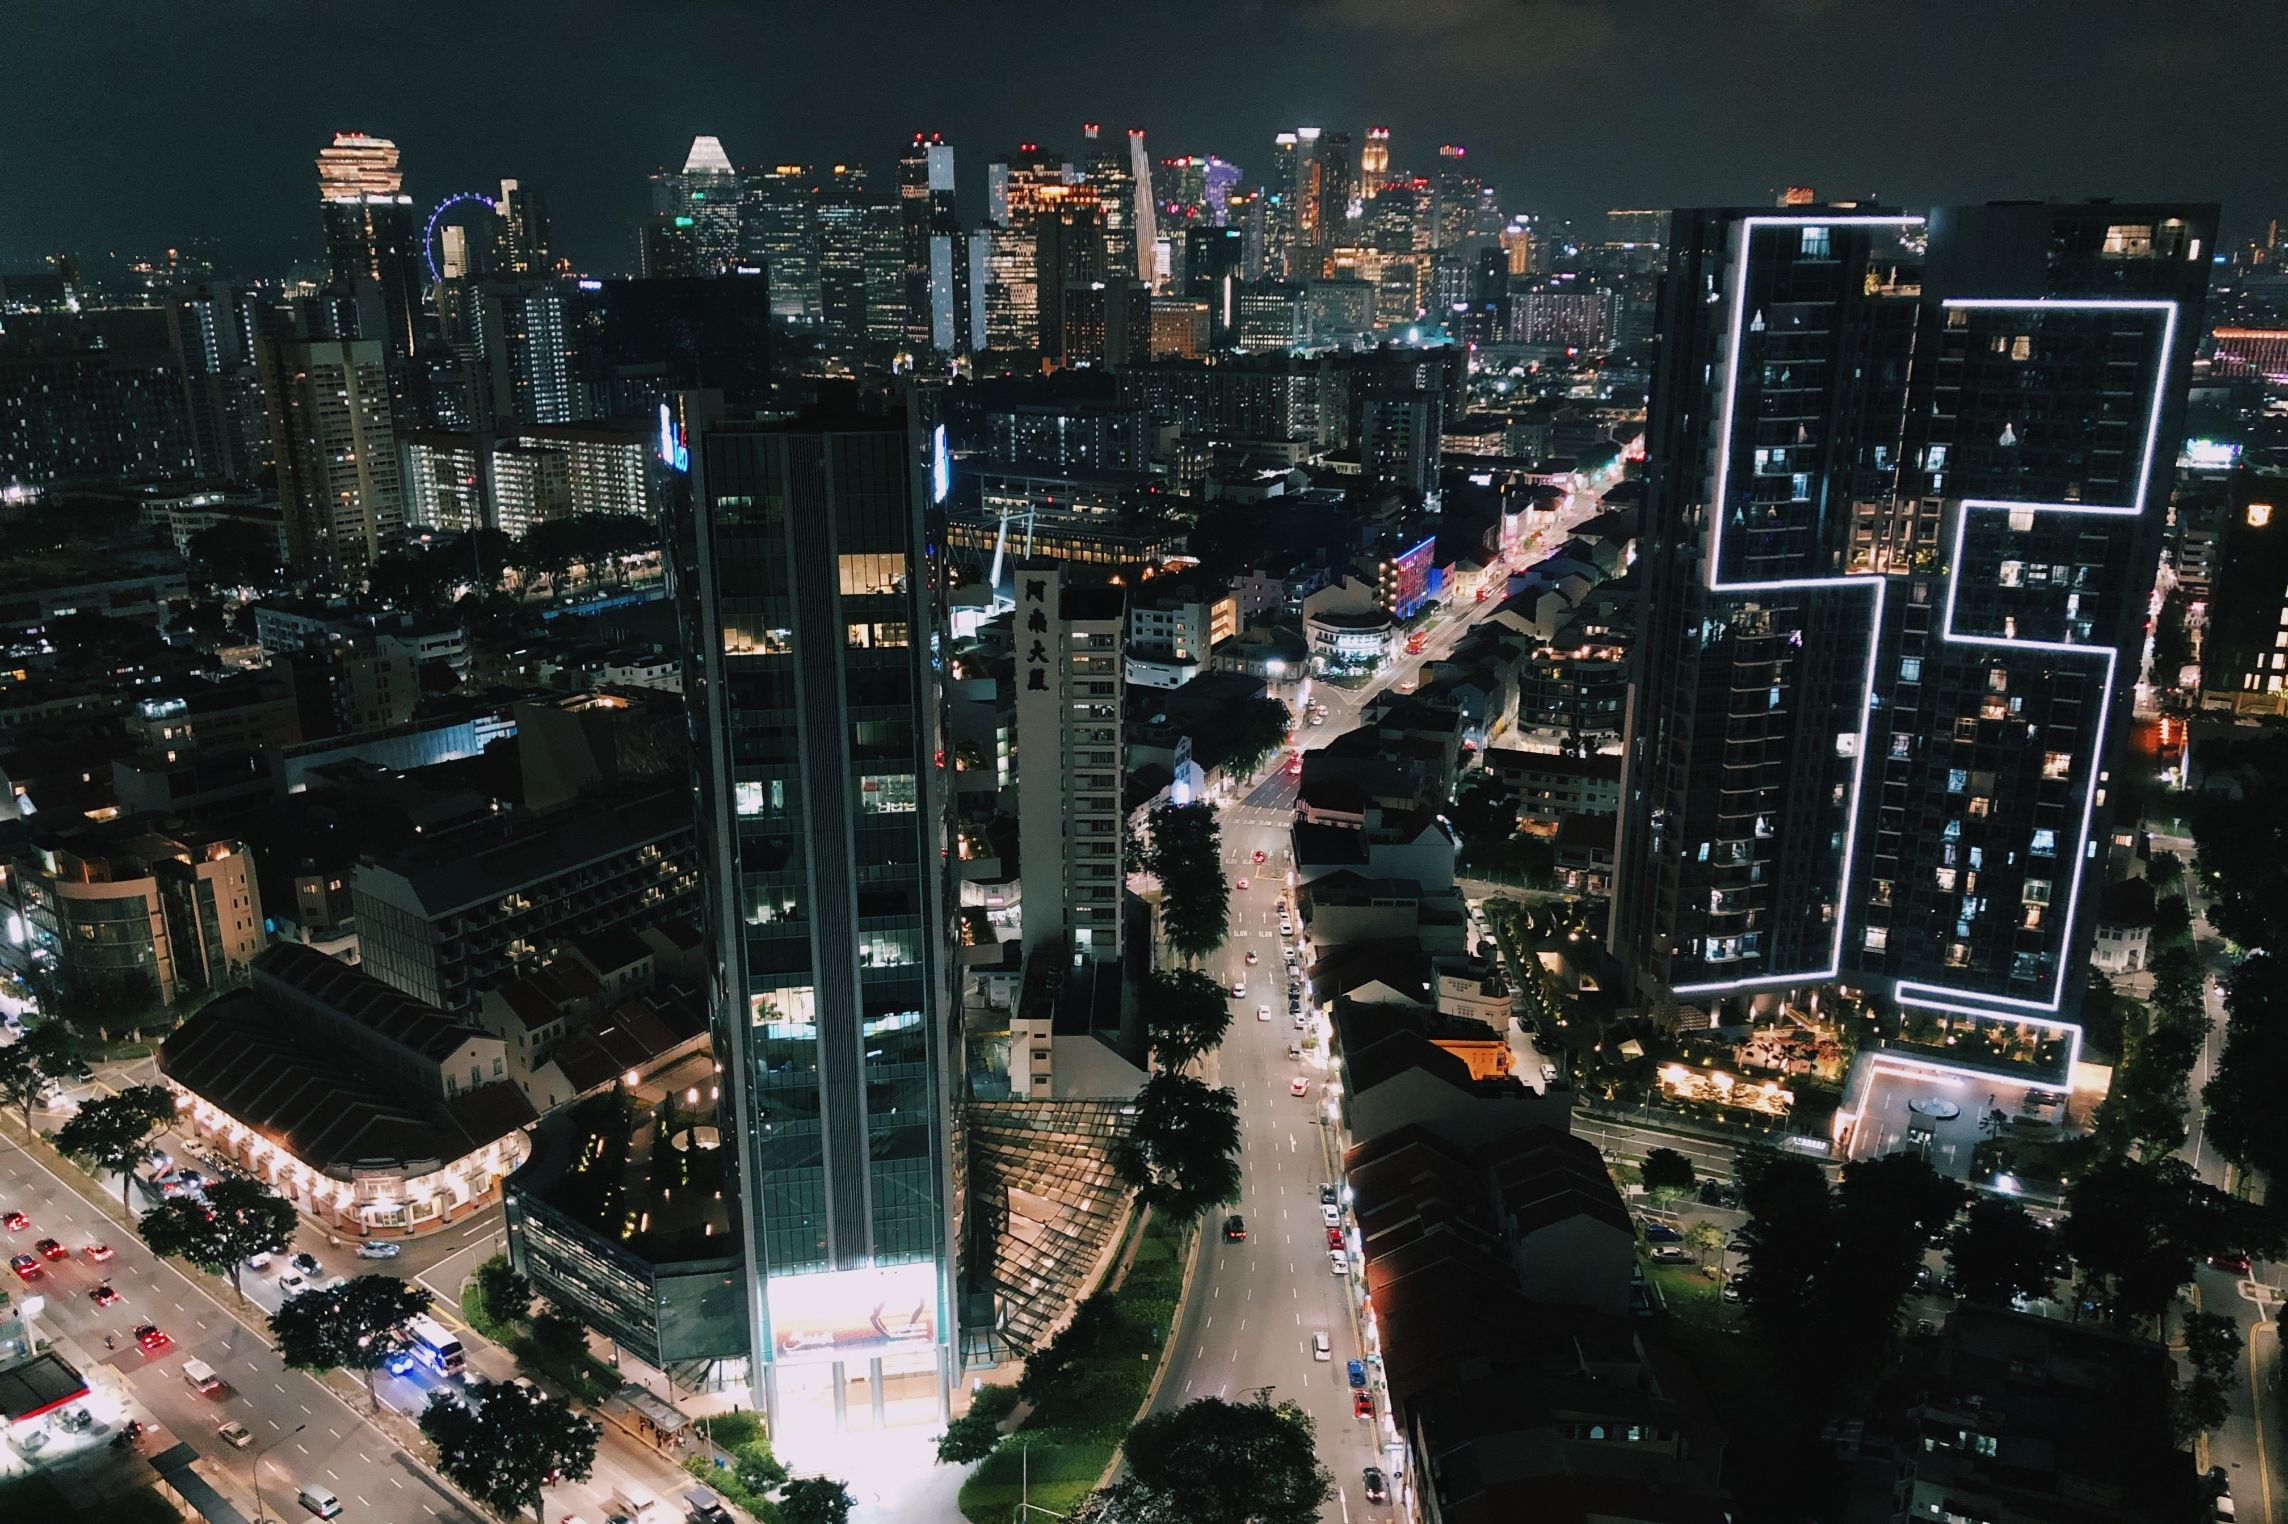
Singapore has a property oversupply. And it isn’t going away anytime soon.
31,948 is the magic number as of September 2019. 31,948 vacant homes – out of which an estimated 24,000 are private units (as of end H1, 2019).
While it might seem incredulous, the vacancy figures do not come as a surprise to avid market watchers – a trend that can be statistically traced back to 2014 and even beyond.
Perhaps more alarming, however, is the fact that we have a whopping 44,000 (and counting) new private units waiting to surface in the next few years. A dilemma that has prompted the government to cut the availability of GLS housing sites in H2, 2019 by 15% with ‘broadly similar’ allocations going into H1, 2020.
As a further precaution, the ministry is limiting the number of confirmed GLS sites — the lowest in 5 years — and leaving the bulk of the land to its reserve list. (*Learn more about the GLS process here).
On the bright side, market sentiment has seen an over-night (month) increase with 1,168 units sold last month – a 21.9% increase from the month before. This is due in part to the launch of Sengkang Grand Residences early last month which has since seen a 35% or 238 unit uptake thus far. Parc Esta has also contributed with a 102 unit uptake.
On a broader scale, the market has already seen the sale of 9,547 units (excluding ECs) up till this point, a sizable 8.5% year-on-year increase from the total 8,795 units sold last year.
Still, these ‘minute’ rises aren’t enough for most developers.
By now, many of you would have heard about Singapore’s 2nd biggest developer making the news just a few days back with its public appeal to the government.
‘Ease the cooling measures’ was the resonating theme of the message.
Unsurprisingly, the ministry is not likely to budge, with many coming together to back the government on that front.
“It would be “unwise” for the Government to bail out developers by easing cooling measures…If this precedent of a bailout is set, developers will not exercise restraint in acquiring en-bloc sites in future cycles, flooding the market with supply and relying on the government to rescue them again.”
Ms. Li, Cushman & Wakefield
On the other hand, it is easy to see where the developers are coming from. With this many vacant homes, ensuring a full uptake of any new or current development in 5 years (or less) is going to be increasingly harder. More so given the implementation of additional stamp duty fees for both foreigners and locals purchasing multiple homes in Singapore. A measure that has encouraged prudent investor purchases across the board.
It therefore comes with little surprise that City Development Limited’s CEO, Sherman Kwek wants an additional 2-5 years ABSD deadline extension alongside pro-rated ABSD charges based on balance units.
More interestingly, he suggests that the current property oversupply of housing units actually goes back to the first hike of ABSD in 2013. This amidst the public’s outcry against ‘land-hungry’ developers who fueled the en-bloc craze.
Yet despite the slight discontentment of the public on the matter, however, most view the rising property oversupply as a welcome piece of news that could finally signify a quantum drop despite the estimated property price surges.
… or so we think.
Our research shows that the truth might actually lie somewhere in the middle.
And thus Our Quest For Today: To explore the cause of Singapore’s increasing ‘Property Oversupply’.
Now let’s begin our journey with a rundown of the past historical events that led to this impending property oversupply.
(Hint: Grab some coffee (or tea) and get comfy – it’s gonna be a long read!)
Key Historical Points – ‘A chronological walk through time’
12 January 2013 (Peak of 7th-straight Cooling Measures since 2009)
2013 was the year of drastic cooling measures that highlighted the ministry’s incredible power amidst a swift, but effective dampener on a quickly exploding property market.
(While there were a myriad of measures that affected HDB and EC sectors, let’s keep our focus on imposed measures that affected the broader spectrum and discuss them in a bit.)
ABSD Revision
| Citizenship | ABSD Rate on 1st Purchase | ABSD Rate on 2nd Purchase | ABSD Rate on 3rd & Subsequent Purchase |
| Singapore Citizens | No Change | Before: 0%After: 7% | Before: 3% After: 10% |
| Permanent Residents | Before: 0% After: 5% | Before: 3% After: 10% | Before: 3% After: 10% |
| Foreigners and non- individuals (corporate entities) | Before: 10% After: 15% | Before: 10% After: 15% | Before: 10% After: 15% |
LTV Revision
| 1st Housing Loan | 2nd Housing Loan | From 3rd Housing Loan | |
| LTV Limit | No change | Before: 60%; or 40% if the loan tenure is more than 30 years or extends past age 65 After: 50%; or 30% if the loan tenure is more than 30 years or extends past age 65 | Before: 60%; or 40% if the loan tenure is more than 30 years or extends past age 65 After: 40%; or 20% if the loan tenure is more than 30 years or extends past age 65 |
| Minimum Cash Down Payment | No change | Before: 10% After: 25% | Before: 10% After: 25% |
| Non-Individual Borrowers | Before: 40% After: 20% |
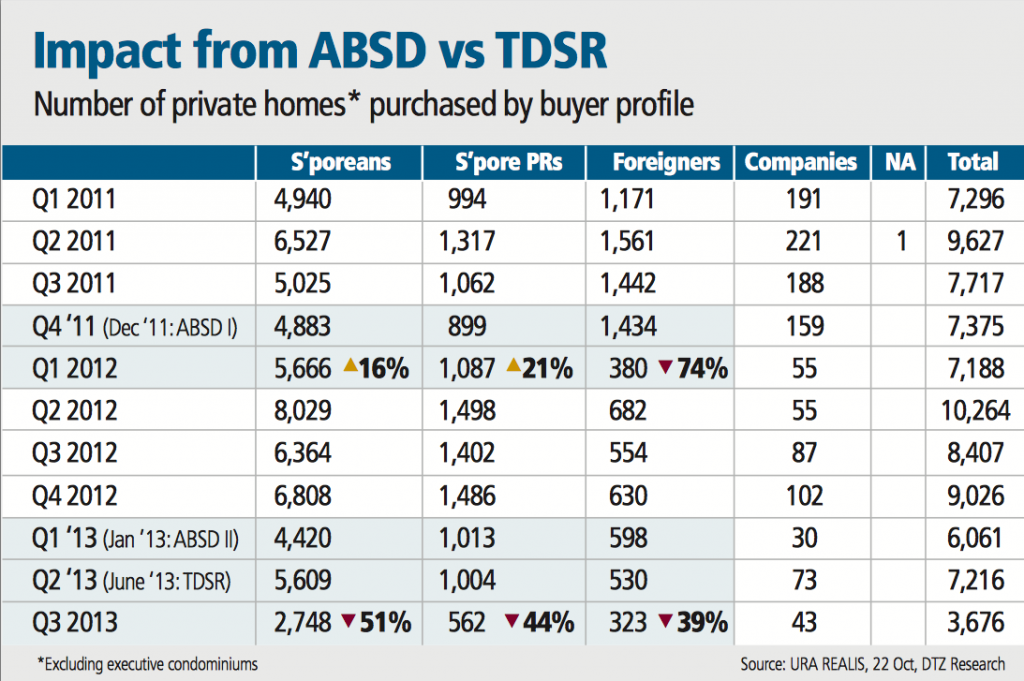
29 June 2013 (Introduction of Total Debt Servicing Ratio – TDSR)
To ease the rising issue of debt woes at that time (and coincidentally strengthen the grip on the property market), the TDSR was implemented by the Monetary Authority of Singapore 5 months later. To briefly extrapolate, it:
“Restricts borrowers from taking on home loans if their existing monthly loan repayments on all borrowings exceed 60 percent of gross monthly income.”
OR in the case that you have a blank slate, can borrow up to 60% of your gross monthly income with certain age requirements (if you are a couple, the income is averaged out based on both party’s age and salary).
Of course, there were many more implementations that came alongside to address the various demographics and minimise the loopholes of the TDSR.
For example, liquid assets (eg. stocks, foreign currency deposits or unit trusts etc.), ‘unstable jobs’ (eg. freelancing, odd-jobs or self-employment) and monthly rental income are just some of the few factors that can add to this ‘gross monthly income’ value (even if they are only valued at 70% based on risk).
Likewise, other outstanding debts like loans and credit card purchase balances will further reduce the amount you can loan from financial institutions.
Add in the stress tests (simulation of an interest hike due to factors like inflation) that the banks perform, and even those with minimal or zero debt would naturally receive a lesser loan sum than before.
TLDR: It assesses the debt servicing ability of borrowers from financial institutes and ‘safeguards’ against risky loan behaviour.
(You can read all about the full details of the TDSR here.)
Unbeknownst to many, however, there was yet another turning point before the en-bloc gold rush of 17’/18.’
11 March 2017 (Easing of Cooling Measures)
In a bid to counteract snail-like economic growth (amidst slow property sales), the Singaporean Government implemented 2 ‘minor’ changes that came into effect in March 2017.
- A reduction of SSD rates for Residential Properties
- And an easing of TDSR (catered toward retirees)
| Before March 2017 | After March 2017 |
| Property loans from all financial entities could not exceed 60% of TDSR threshold | TSDR measure eased from Mortgage Equity Withdrawal loans (50% Loan-To-Value ratio still imposed) |
While these implementations might not have been the biggest causation of the en bloc explosion soon after, it did provide the initial spring in (property) market sentiment. More investors/’resalers’ were beginning to come out of hibernation to ride on the new 3-year SSD-free resale period.
A measure that allowed greater resale flexibility amidst lower penalties.
More from Stacked
Why We Chose A $2.7M 4-Bedder At Lentor Mansion Over A Resale Condo
In 2025, high prices for new launch condos have resulted in more families choosing resale projects. This was not the…
Developers had begun to sense the draft of fresh air from the staleness of the 2013-2017 property crawl.

Property AdviceHow to avoid ABSD in Singapore: 2 ingenious ways to go about it
by Stanley GohMay 2017 – July 2018 (En Bloc Craze + ABSD Hike/LTV Tightening)
2 months later and the first en bloc sale of the 17’/18’ craze began with the sale of One Tree Hill Gardens to developers Lum Chang Group.
A $65 million purchase – signaling the start of a $20-billion en bloc explosion that would go on to rock the very foundations of Singapore’s property market.
Many of you will no doubt remember this period as the news spotlights constantly switched between an alarming increase in overnight Singaporean millionaires to islandwide relocation frenzies.
And then bam. A sudden and unprecedented alteration to two major rulings on 6 July 2018 that was strangely reminiscent of the cooling measures in 2013.
Loan-To-Value Tightening
| Loan extends past 30 years OR 65 years of age: | ||||
| LTV Limits | Before | After | Before | After |
| 1st home | 80% | 75% | 60% | 55% |
| 2nd home | 50% | 45% | 30% | 25% |
| 3rd home onwards | 40% | 35% | 20% | 15% |
The LTV alterations also meant that in addition to the 5% mandatory downpayment, the minimum downpayment (as of logical calculations) a 1st homeowner would now have to fork up would be 20%, as opposed to the 15% before the LTV tightening.
ABSD Hike
According to Mr Lawrence Wong, Minister of National Development, the swift ‘correction’ came amidst the ‘concern that prices were running ahead of economic fundamentals’ and that ‘a severe destabilizing correction later on (as opposed to the present time of measure implementations) could have more destabilising consequences’.
‘Destabilising consequences’ that City Development Limited’s CEO, Sherman Kwek spoke about when he attributed the cause of the en bloc fever to the 4 drawn-out years (2013-2017) of ‘depressed market sentiment’ – a result of the government’s ABSD hike and Total Debt Servicing Ratio (TDSR) framework implementation at the start of 2013.
A full circle indeed.
But how did a depressed market sentiment co-relate to an aggressive war for land that resulted in an incredulous 53 successful en bloc acquisitions between 2017 and 2018 – hence the property oversupply situation today?
Let’s dig a little deeper.
(*For a full highlight of all the past cooling measures, be sure to check this out!)
Conclusion: Cause-and-Effect (A Breakdown)
Origins of the En Bloc Craze
When talking solely about the En Bloc Craze, we can safely attribute its birth to:
- 2013 ABSD/TDSR implementations
- 2017 easing of cooling measures
- Land-scarcity fear
In brief, the 2013 cooling measures resulted in a ‘less risky’ and hence ‘quieter’ property market. Investors/resellers took time to adjust to a new ‘normal’ that discouraged the reckless ‘buy-and-sell’ theme (higher resale penalties and tighter loans) responsible for the 2013 property price peaks.
The 44% dip in non-residential unit sales and 3.5% fall in private property price index in 2014 was a testament to this.
With a ‘depressed’ market sentiment, developers naturally focused on avoiding the ABSD hits by clearing their ‘land-bank’. All this with limited land purchase investments.
When the cooling measure ease popped up in 2017, market sentiment gladly acceded to the boost it had been waiting for. Investors ventured out to capitalise on the new SSD relaxation and soon after, developers entered the market to replenish their land banks that were fast emptying.
One en bloc bid became two, and by the time a healthy number of collective sales deals were underway, ‘peer-pressure-buying’ and the concern over land being limited (and therefore valuable) resource sent developers into a buying frenzy.
Most of them would choose to exclude the possible drawbacks of this ferocious bidding.
The Big Picture (Causes of the property oversupply)

Now if you were to get a birds’ eye view of the entire situation, you’d realise that the en bloc craze was just one of three major causations that has led to this massive impending property oversupply. The other two being:
- An Already Existing Residential Property Oversupply (On 2 fronts – Vacant Completed Units/Unsold Pipeline Units )
| Quarter/ Year | Completed Unit Vacancy | Uncompleted Pipeline units | Unsold Pipeline Units | Vacant Completed Units | Sold New Launch Units | Yearly Average New Launch Transactions | Sold Resale Units | Yearly Average Resale Transactions |
| 2013 Q1 | 5.2% | 88,623 | 35,564 | – | 5,412 | 1,871 | ||
| 2013 Q2 | 5.6% | 87,789 | 33,255 | – | 4,538 | 2,075 | ||
| 2013 Q3 | 6.1% | 84,917 | 31,004 | – | 2,430 | 1,340 | ||
| 2013 Q4 | 6.2% | 83,702 | 30,819 | – | 2,568 | 3,737 | 1,206 | 1,623 |
| 2014 Q1 | 6.6% | 80,261 | 29,482 | – | 1,744 | 899 | ||
| 2014 Q2 | 7.1% | 76,014 | 27,024 | – | 2,665 | 1,389 | ||
| 2014 Q3 | 7.1% | 74,496 | 28,120 | 21,569 | 1,531 | 1,377 | ||
| 2014 Q4 | 7.8% | 68,960 | 26,742 | 24,062 | 1,376 | 1,829 | 1,151 | 1,204 |
| 2015 Q1 | 7.2% | 68,201 | 27,061 | 22,346 | 1,311 | 1,250 | ||
| 2015 Q2 | 7.9% | 61,237 | 24,435 | 25,071 | 2,116 | 1,827 | ||
| 2015 Q3 | 7.8% | 58,348 | 22,456 | 25,169 | 2,410 | 1,619 | ||
| 2015 Q4 | 8.1% | 55,638 | 23,271 | 26,517 | 1,603 | 1,860 | 1,464 | 1,540 |
| 2016 Q1 | 7.5% | 53,512 | 22,370 | 24,919 | 1,419 | 1,340 | ||
| 2016 Q2 | 8.9% | 47,250 | 21,489 | 30,310 | 2,256 | 2,140 | ||
| 2016 Q3 | 8.7% | 43,693 | 20,577 | 29,836 | 1,609 | 2,477 | ||
| 2016 Q4 | 8.4% | 40,913 | 19,071 | 29,197 | 2,944 | 2,057 | 1,944 | 1976 |
| 2017 Q1 | 8.1% | 36,942 | 15,930 | 28,442 | 2,962 | 2,170 | ||
| 2017 Q2 | 8.1% | 35,423 | 15,085 | 28,888 | 3,077 | 3,698 | ||
| 2017 Q3 | 8.4% | 35,022 | 16,031 | 30,136 | 2,663 | 3,949 | ||
| 2017 Q4 | 7.8% | 36,029 | 18,891 | 28,560 | 1,864 | 2,642 | 4,226 | 3,511 |
| 2018 Q1 | 7.4% | 40,330 | 23,514 | 26,906 | 1,581 | 3,666 | ||
| 2018 Q2 | 7.1% | 45,003 | 26,943 | 26,064 | 2,366 | 4,700 | ||
| 2018 Q3 | 6.8% | 50,330 | 30,467 | 25,105 | 1,836 | 2,672 | ||
| 2018 Q4 | 6.4% | 51,498 | 34,824 | 23,596 | 3,012 | 2,199 | 1,971 | 3,253 |
| 2019 Q1 | 6.3% | 53,284 | 36,839 | 23,357 | 1,838 | 1,858 | ||
| 2019 Q2 | 6.4% | 50,674 | 33,673 | 23,639 | 2,350 | 2,371 | ||
| 2019 Q3 | 6.1% | 50,964 | 31,948 | 22,819 | 3,281 | 2,378 | ||
| 2019 Q4 | TBA | TBA | TBA | TBA | TBA | TBA | TBA | TBA |
(*Note that the table above includes Private Residential-only stats with the exemption of ECs)
- And the 2018 ABSD/LTV Hike (as displayed earlier)
As you can see, the property oversupply has been a prevalent issue for some time now.
Perhaps the reason it has once again come under news’ scrutiny is because of the recent comments from public figures made on the post-en bloc craze and ABSD/LTV hike effect.
Logically speaking, the impending increased oversupply (from the 17’/18’ craze) wouldn’t possibly have had such an alarming ring (on the contrary, the new supply could even be welcome) to it if the *follow-through* effect of the 2013 price/supply peak was no longer affecting the market today.
To briefly extrapolate, this follow-through effect stems from the number of units architected from the massive 2013 pipeline units. Hypothetically, the increased supply + ABSD tax hits meant that more focus was spent on selling off New Launch units post-2013 and not the older existing vacant units (even if it remains to be seen from which period the bulk of these unsold units come from). Naturally, a lack of this ‘supply’ from the 2013 period would have resulted in lesser vacancy but a possible en bloc craze in earlier years (with other snowballed effects).
Moving on, and as mentioned earlier (in the birth of the en bloc craze), the 2013 measures also led to a slightly depressed property market in which lesser new launch sales were transacted over the following years despite the increase in finished units (*note that monthly new launch unit sales naturally rise with the respective new launches in that month – hence our focus on the yearly average).
The follow-up 2018 ABSD/LTV increments undoubtedly made the matter at hand more pressing.
With developers now facing levies of up to 32.5% of their land purchase fees on the condition that units are not all sold/built within 5 years of land takeover, storing these individual ‘plots’ in ‘land-banks’ have now been firmly cemented as a thing of the past (if they weren’t already).
Cue over 20,000 units from the 53 collective sale sites during the en bloc craze flooding the market in the next 5 years (this excluding GLS sales).
Final Word
In essence, the housing oversupply has been a long-standing issue in Singapore’s property market.
With the impending increase in houses expected to flood the market in the next few years courtesy of the 17’/18’ en bloc craze however, a number of interesting effects could come into play.
Bigger new-launch unit discounts, heftier developer-associated monetary losses and more competitive/attractively built new-launch condominium offerings are just some of the possible brews from the cauldron.
Perhaps more pressing however, is the possibility of a drop in residential quantum.
While public and expert opinions vary greatly (and understandably) on this, the impact of the glut on pricing quantums is certain.
In our next piece – “So Is There Really A Property Oversupply? (And How It Might Affect Housing Prices)”, we decryptify and explore the possibility of a highly-anticipated housing price that could impact the lives of millions living here in Singapore.
Whether it’ll be for good or for bad – remains to be seen.
What do you think? Could Singapore’s impending rise in housing oversupply really lead to a housing price fall in the next decade? Leave us a comment below with your thoughts or reach out to us at stories@stackedhomes.com with your ideas. As always, we can’t wait to hear from you!
At Stacked, we like to look beyond the headlines and surface-level numbers, and focus on how things play out in the real world.
If you’d like to discuss how this applies to your own circumstances, you can reach out for a one-to-one consultation here.
And if you simply have a question or want to share a thought, feel free to write to us at stories@stackedhomes.com — we read every message.
Frequently asked questions
What is causing Singapore's property oversupply?
How have government policies impacted Singapore's property market?
Why are there so many vacant homes in Singapore?
What measures is the government taking to address property oversupply?
How has the en bloc property sale trend contributed to oversupply?
Reuben Dhanaraj
Reuben is a digital nomad gone rogue. An avid traveler, photographer and public speaker, he now resides in Singapore where he has since found a new passion in generating creative and enriching content for Stacked. Outside of work, you’ll find him either relaxing in nature or retreated to his cozy man-cave in quiet contemplation.Need help with a property decision?
Speak to our team →Read next from Property Market Commentary

Property Market Commentary How I’d Invest $12 Million On Property If I Won The 2026 Toto Hongbao Draw

Property Market Commentary We Review 7 Of The June 2026 BTO Launch Sites – Which Is The Best Option For You?

Property Market Commentary Why Some Old HDB Flats Hold Value Longer Than Others

Property Market Commentary We Analysed HDB Price Growth — Here’s When Lease Decay Actually Hits (By Estate)
Latest Posts

On The Market A 40-Year-Old Prime District 10 Condo Is Back On The Market — As Ultra-Luxury Prices In Singapore Hit New Highs

Pro This Singapore Condo Has Bigger Units Near The MRT — But Timing Decided Who Made Money

Editor's Pick Happy Chinese New Year from Stacked




0 Comments