BTO-To-Resale Price Gap: Are They Always The Same? A Look At 19 Years Of Data
September 3, 2021
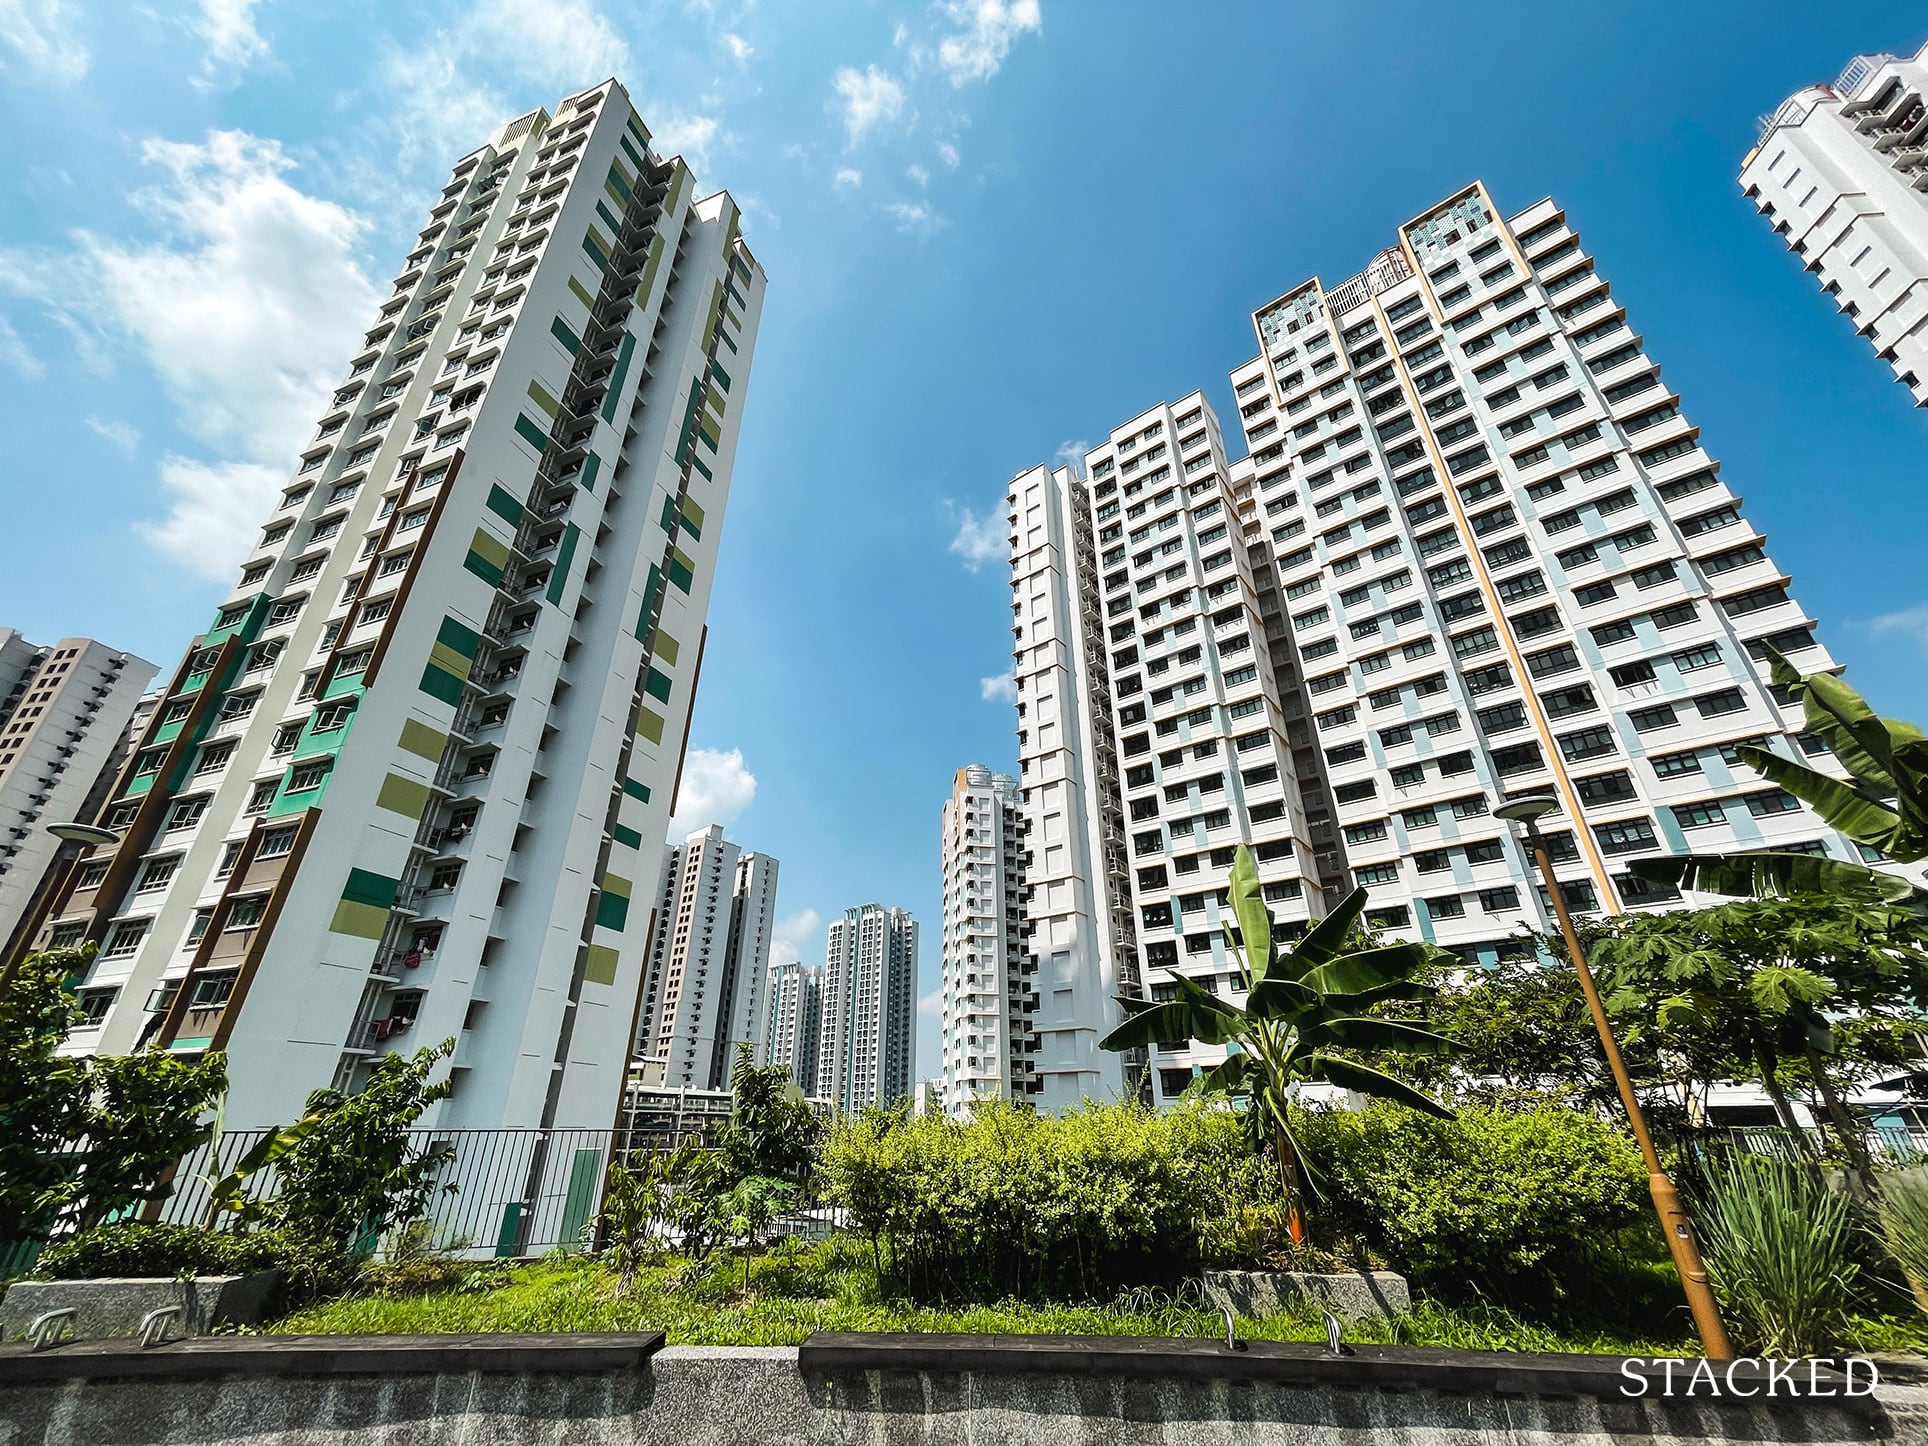
Resale flat prices are at their highest in around eight years, and it’s painful for first-time flat buyers. In this Covid-19 environment, with high risks of construction delays, picking between BTO and resale is the proverbial “rock and a hard place” scenario. However, have we developed a skewed perspective of how big the price difference really is? Here’s a look at how the price gap between BTO and resale HDB flats has changed over the years:
How did we derive the data for the following?
The following is based on transaction data from HDB. From here, we derived the average resale flat price for the given year and flat type. We then compared it to the average BTO price for the estate and flat type, in the given year.
As some of the information – such as BTO prices for some areas and years – are patchy, there is invariably some room for error. More recent data will be more accurate, as HDB does show the likely sale price during a launch exercise (but the information for past exercises wasn’t always still around). For BTO data, the average price is determined by averaging the minimum and maximum selling price without grants for that flat type and estate.
In addition, note that the remaining lease is a major factor in the price gap (more on this below).
The general price gap between BTO and resale
In determining the price gap, there were many variables based on location, flat size, etc., many of which we address below. However, to give you a sense of the general price gap, we can look at the average prices of BTO vs. resale 4-room flats, on an island-wide basis.
(We use 4-room flats because these are the most common flat sizes)
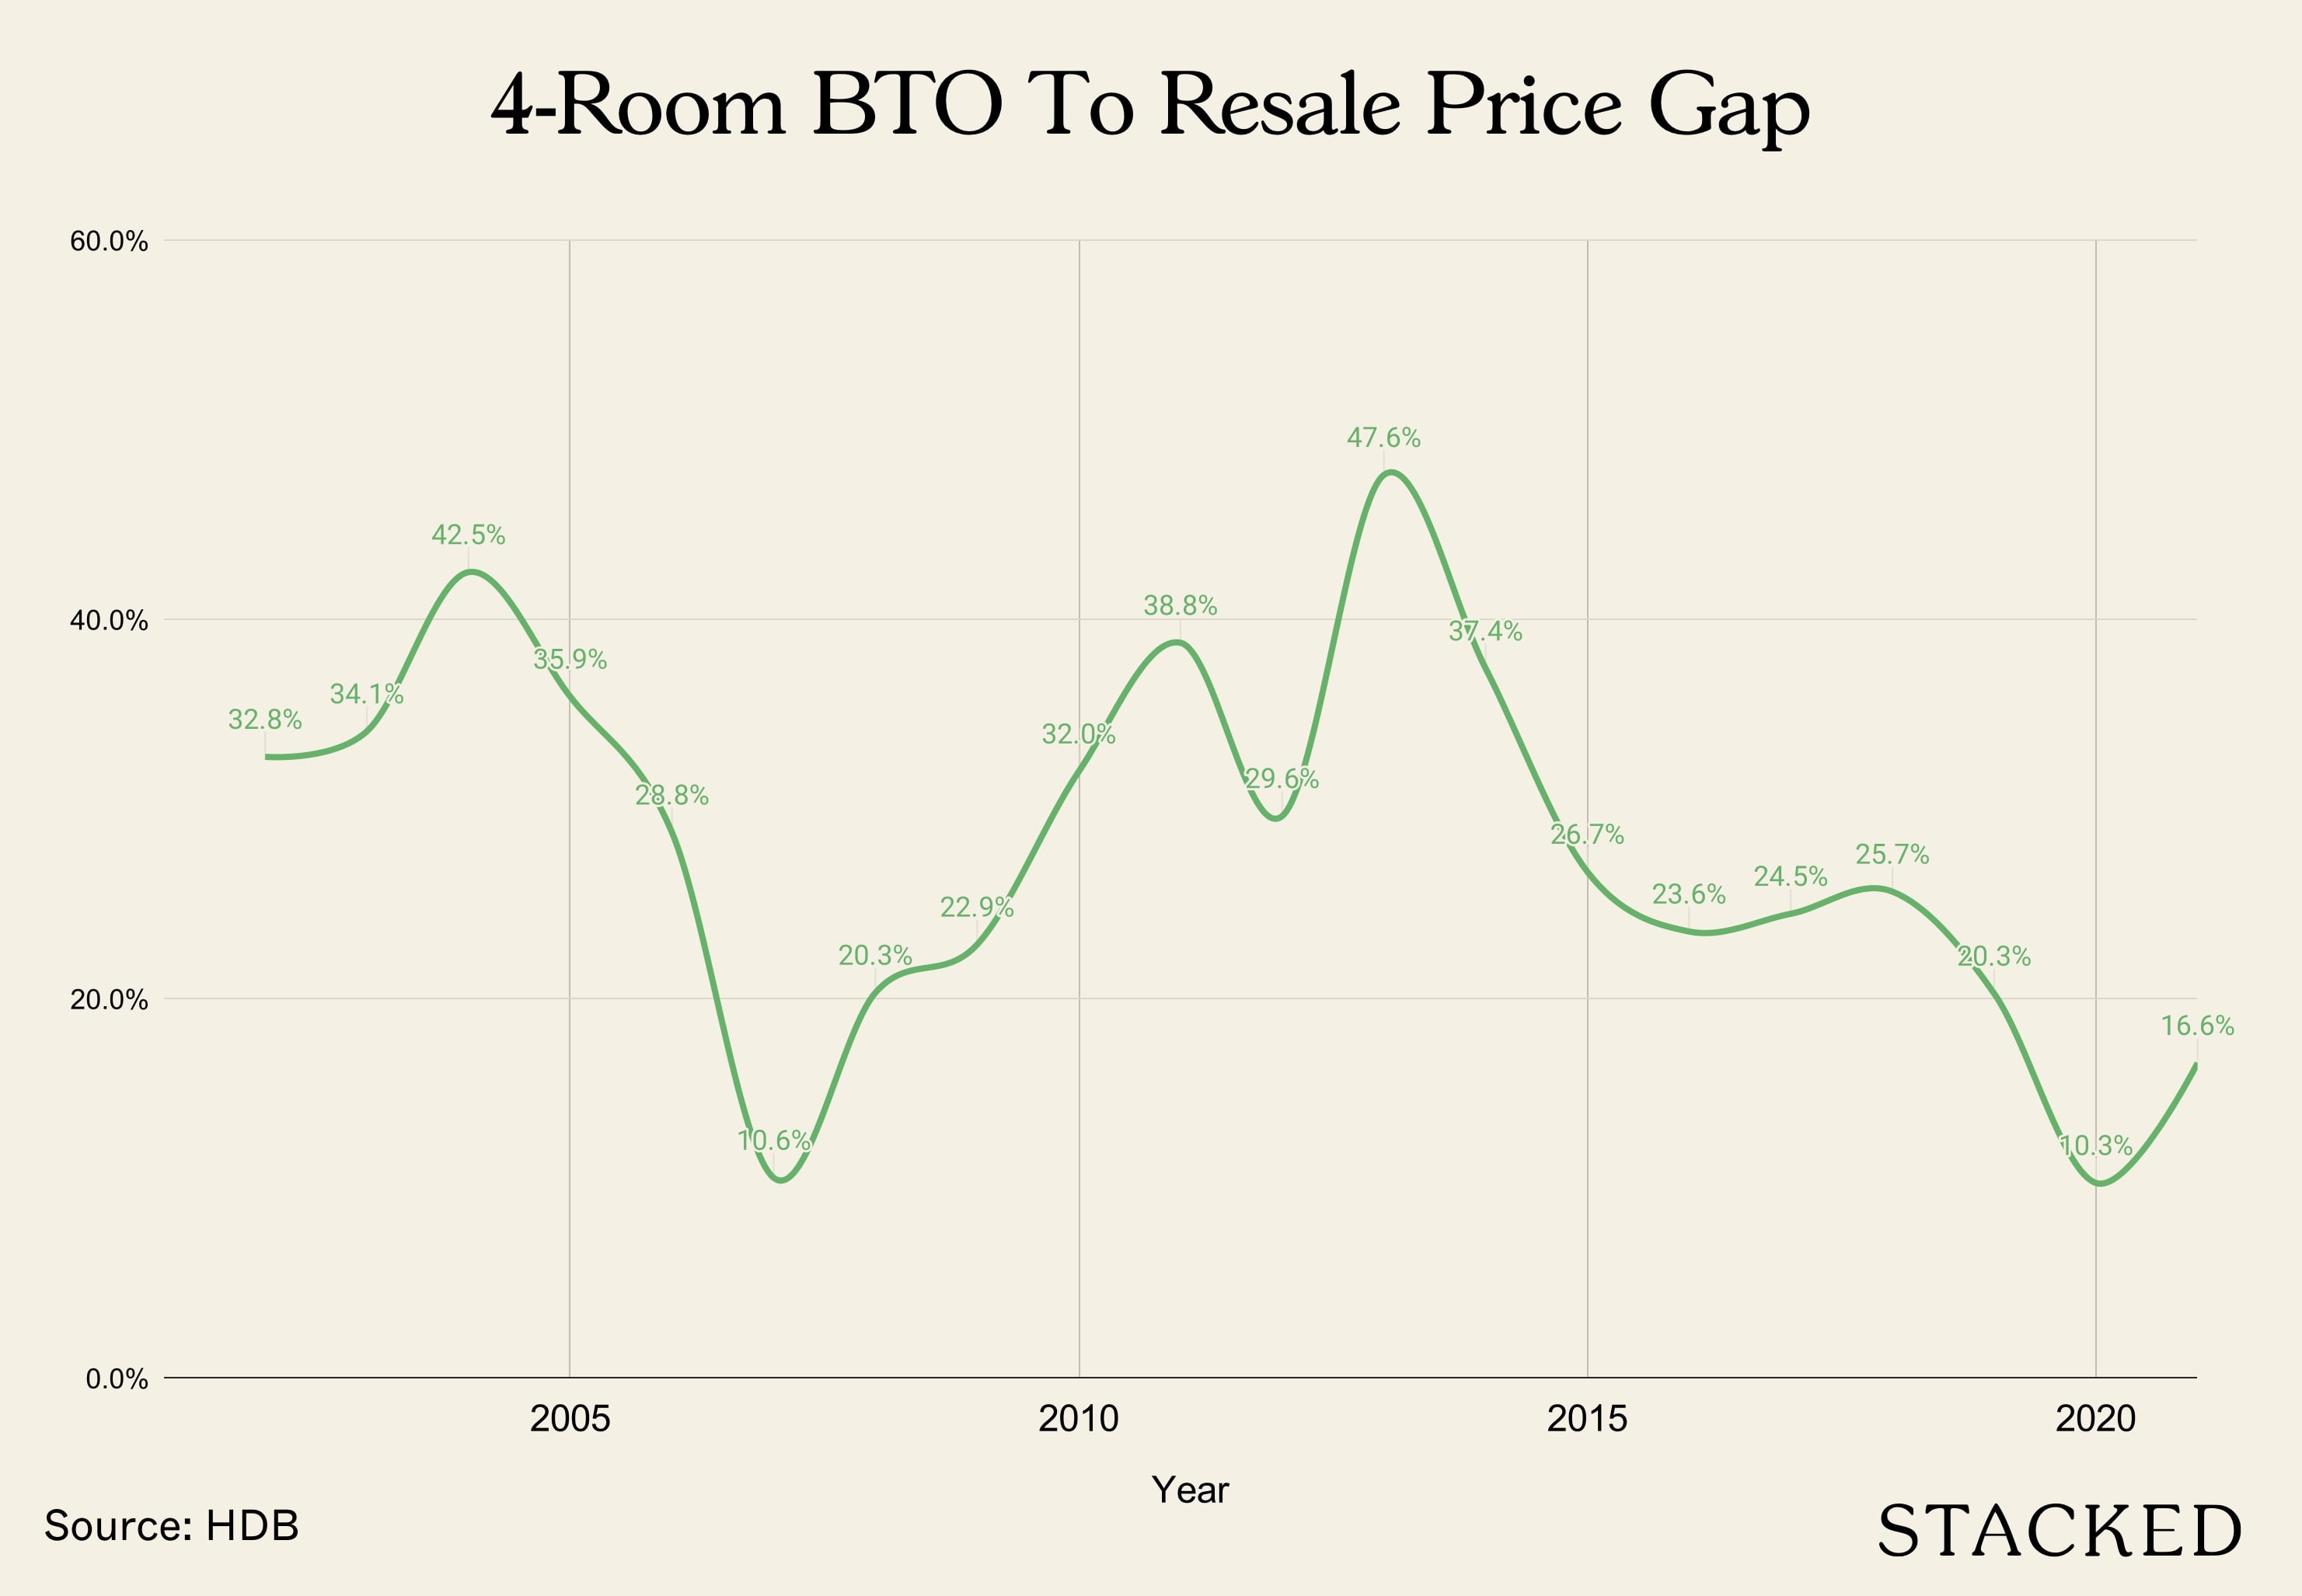
In a general sense, you can see there has been a sharp recent uptick from 2020. The price gap has risen by around 6.3 percentage points, in the span of just a year.
While that’s concerning, however, it’s important to realise that – in a wider context – the situation is nowhere close to how bad it was in the early 2000’s, or just prior to 2013 (which was the last property peak).
We may well be getting to that point again, but for now, we’re still some distance from it.
Specifics based on HDB town
Not every HDB town follows the same, island-wide patterns. Here’s the price gap for different flat types and towns, where the data was available:
3-Room BTO-Resale Gap:
| Year | Ang Mo Kio | Bedok | Bishan | Bukit Batok | Bukit Merah | Bukit Panjang | Choa Chu Kang | Clementi | Geylang | Hougang | Jurong East | Jurong West | Kallang/Whampoa | Pasir Ris | Punggol | Queenstown | Sembawang | Sengkang | Tampines | Toa Payoh | Woodlands | Yishun |
| 2007 | -2.5% | 4.6% | 28.3% | |||||||||||||||||||
| 2008 | 26.8% | 43.3% | 27.6% | 31.6% | 49.0% | |||||||||||||||||
| 2009 | 60.1% | 45.5% | 39.4% | -13.7% | 30.8% | |||||||||||||||||
| 2010 | 61.8% | 68.6% | 66.7% | 39.2% | 60.4% | 59.8% | ||||||||||||||||
| 2011 | 36.0% | 88.4% | 91.0% | 70.6% | 65.1% | 58.2% | 27.9% | 60.0% | 48.6% | 70.5% | ||||||||||||
| 2012 | 20.2% | 21.9% | 43.6% | 19.2% | 112.4% | 104.6% | 8.6% | 6.5% | 16.1% | 13.4% | 96.3% | 81.2% | 12.5% | 78.1% | ||||||||
| 2013 | 59.6% | 24.7% | 115.8% | 82.2% | 83.9% | 132.0% | 75.7% | 106.2% | 75.1% | |||||||||||||
| 2014 | 66.2% | 72.5% | 65.5% | 1.7% | 102.7% | 74.6% | 9.3% | 75.0% | 89.0% | |||||||||||||
| 2015 | 58.3% | 2.1% | 70.7% | 84.6% | 97.3% | 61.6% | -6.8% | |||||||||||||||
| 2016 | -25.9% | 5.2% | 55.4% | 60.7% | 60.9% | -3.5% | 96.3% | 92.4% | 43.8% | -10.4% | 68.1% | |||||||||||
| 2017 | 31.7% | 41.7% | 8.8% | -23.2% | 92.7% | 86.2% | 42.1% | -8.5% | 62.5% | 68.3% | ||||||||||||
| 2018 | 40.9% | -9.1% | 18.4% | 61.6% | 56.2% | 54.5% | 41.3% | 7.2% | 72.4% | 38.8% | ||||||||||||
| 2019 | 17.8% | -18.1% | 50.1% | 50.3% | 58.3% | 43.2% | ||||||||||||||||
| 2020 | -17.7% | 62.4% | -25.6% | 25.9% | 86.4% | 23.6% | -29.6% | 29.2% | ||||||||||||||
| 2021 | 56.0% | -14.5% | -13.2% | 24.5% | 26.5% | -6.5% | -3.2% | 36.3% | -9.3% | 50.4% |
4-Room BTO-Resale Gap:
| Year | Ang Mo Kio | Bedok | Bishan | Bukit Batok | Bukit Merah | Bukit Panjang | Choa Chu Kang | Clementi | Geylang | Hougang | Jurong East | Jurong West | Kallang/Whampoa | Pasir Ris | Punggol | Queenstown | Sembawang | Sengkang | Tampines | Toa Payoh | Woodlands | Yishun |
| 2002 | 32.77% | |||||||||||||||||||||
| 2003 | 34.11% | |||||||||||||||||||||
| 2004 | 42.50% | |||||||||||||||||||||
| 2005 | 33.9% | 38.01% | ||||||||||||||||||||
| 2006 | -7.4% | 25.0% | 51.9% | 45.60% | ||||||||||||||||||
| 2007 | 2.7% | 9.6% | 19.7% | 26.04% | -5.23% | |||||||||||||||||
| 2008 | 14.7% | 29.2% | 18.6% | 15.3% | 32.87% | 20.32% | 11.37% | |||||||||||||||
| 2009 | 29.7% | 26.2% | 25.9% | 20.5% | 3.5% | 26.2% | 38.69% | 12.18% | ||||||||||||||
| 2010 | 25.4% | 37.0% | 36.7% | 24.3% | 22.7% | 48.5% | 35.94% | 29.53% | 27.95% | |||||||||||||
| 2011 | 50.9% | 52.3% | 36.1% | 28.5% | 33.4% | 29.8% | 37.3% | 40.2% | 48.01% | 32.50% | 37.63% | |||||||||||
| 2012 | 5.8% | 6.9% | 22.1% | 27.0% | 57.9% | 59.3% | 5.8% | 9.4% | 12.9% | 52.1% | 26.4% | 43.98% | 41.39% | 23.67% | 43.29% | 36.46% | ||||||
| 2013 | 22.7% | 37.6% | 31.9% | 65.5% | 43.2% | 49.2% | 29.0% | 52.4% | 63.0% | 75.10% | 47.43% | 59.01% | 43.21% | |||||||||
| 2014 | 41.8% | 42.2% | 39.5% | 3.8% | 44.7% | 45.2% | 50.47% | 49.74% | 18.61% | 40.82% | 34.74% | |||||||||||
| 2015 | 37.6% | -3.7% | 13.3% | 36.3% | 30.9% | 36.6% | 45.47% | 37.45% | 6.40% | |||||||||||||
| 2016 | -14.7% | -4.7% | 35.1% | 28.5% | 34.9% | 6.8% | 43.1% | 37.2% | 40.10% | 31.66% | 10.43% | 34.33% | ||||||||||
| 2017 | 35.7% | 18.9% | 14.3% | -7.1% | 40.3% | 42.45% | 29.52% | 12.65% | 27.45% | 30.69% | ||||||||||||
| 2018 | 15.2% | 12.2% | 16.4% | 38.9% | 21.3% | 31.65% | 24.08% | 39.14% | 35.44% | 22.22% | ||||||||||||
| 2019 | 16.9% | -7.6% | 34.4% | 17.3% | 36.02% | 24.59% | ||||||||||||||||
| 2020 | 2.2% | 0.4% | 28.3% | -0.5% | 4.0% | 25.1% | 21.12% | 4.60% | 7.42% | |||||||||||||
| 2021 | 43.5% | 5.8% | 3.6% | 8.1% | 13.1% | 2.8% | 26.8% | 21.59% | 15.78% | 25.15% |
5-Room BTO-Resale Gap:
| Year | Ang Mo Kio | Bedok | Bukit Batok | Bukit Panjang | Choa Chu Kang | Clementi | Hougang | Jurong West | Pasir Ris | Punggol | Queenstown | Sembawang | Sengkang | Tampines | Toa Payoh | Woodlands | Yishun |
| 2007 | -15.6% | ||||||||||||||||
| 2008 | 24.1% | 4.6% | 11.3% | 18.7% | |||||||||||||
| 2009 | 6.0% | 1.2% | 20.8% | 27.0% | |||||||||||||
| 2010 | 17.3% | 20.7% | 12.4% | 20.2% | 28.4% | 26.1% | |||||||||||
| 2011 | 40.7% | 36.1% | 27.5% | 26.3% | 20.2% | 23.5% | 31.5% | 23.2% | 37.2% | ||||||||
| 2012 | 17.4% | 17.5% | 21.2% | 45.0% | 46.9% | 10.6% | 33.9% | 29.7% | 31.1% | 33.8% | 38.1% | ||||||
| 2013 | 27.9% | 36.8% | 48.6% | 47.4% | 39.8% | 28.4% | 42.4% | 36.7% | 48.5% | 44.5% | |||||||
| 2014 | 38.3% | 42.6% | 28.4% | 31.4% | 24.4% | 39.9% | 26.8% | 27.5% | |||||||||
| 2015 | 40.5% | 5.0% | 28.7% | 6.2% | 26.9% | 29.9% | 17.0% | ||||||||||
| 2016 | 16.8% | 5.9% | 41.2% | 30.4% | 11.0% | 18.6% | 25.2% | 21.1% | 20.1% | ||||||||
| 2017 | 41.6% | 17.3% | 19.0% | 23.7% | 21.7% | 26.8% | 22.7% | 30.1% | |||||||||
| 2018 | 9.6% | 7.8% | 9.6% | 11.4% | 15.2% | 31.2% | 23.1% | ||||||||||
| 2019 | 10.8% | 6.0% | 5.5% | 22.1% | 12.1% | ||||||||||||
| 2020 | 14.9% | -5.9% | 11.7% | 11.6% | 7.7% | -8.1% | |||||||||||
| 2021 | 35.3% | 36.4% | 11.9% | 17.4% | 12.9% |
Key takeaways for flat buyers:
- Resale flat prices can rebound sharply after a crisis
- Policy changes like MSR and concealed COV can drive down prices for significant periods
- There seems to be some truth that 3-room flats are worse for resale
- 35+ years is roughly when lease decay seems to kick in
1. Resale flat prices can rebound sharply after a crisis
The gap between resale and BTO flat prices began to widen in 2008/9, after an initial drop in resale prices. There may be some parallels between this event, and the sharp spike in resale flat prices following Covid-19.
(Note that the same pattern exists for private housing, where a major recession is followed by sharply increased property prices).
This is often attributed to interest rates: in 2008/9, as with today, the United States Federal Reserve cuts interest rates to stimulate economic recovery, when there’s a crisis. And in the aftermath of the ‘08/09 crisis, interest rates were so low that some homeowners on a Swap Offer Rate (SOR) loan saw negative interest rates.
At present, interest rates from bank loans average just 1.3 per cent, as opposed to the HDB loan’s 2.6 per cent (you can choose to use either bank or HDB loans for flats).
Another common reason is that buyers who could afford private housing pick resale flats instead. They’re trying to be prudent, in difficult times.
Now there’s no income ceiling for resale flats. Even a couple who earn $30,000 a month can buy one, so long as they meet other eligibility requirements. Having a lot of these buyers, competing for flats in desirable areas, can significantly drive up prices.
These are inferences and not facts; there’s no decisive way to prove the market’s motives. But there does seem to be some correlation, between the aftermath of a crisis and rising flat prices.
2. Policy changes like MSR and concealed COV can drive down prices for significant periods
Toward 2013, the property market began to overheat. While a lot of attention goes toward cooling measures, we tend to overlook what happened with HDB flats.
Prior to the 2013 peak, Cash Over Valuation (COV) was rampant, with amounts like $35,000 to $50,000 becoming common; this was even in non-mature neighbourhoods like Pasir Ris.
It took only two small tweaks by the government, to send resale flat prices into a roughly seven-year tailspin.
The first change was the Mortgage Servicing Ratio (MSR), capping home loan repayments at 30 per cent of the borrower’s monthly income.
The second change was deciding not to reveal the valuation, until the Option has been secured. Today you agree on the price first – and if the subsequent valuation is under the price, only then do you end up paying COV.
This was devastating to resale flat values. Notice that from 2013 up till very recently, the price gap between resale and BTO flats had been steadily falling; and it’s only the recent crisis that’s changed things.
As such, buyers should keep in mind that changing policies can quickly change their planned property outcomes.
3. There seems to be some truth that 3-room flats are worse for resale
In the rare cases where the price gap became negative (i.e., the average resale price was lower than the average BTO price), it was most evident among 3-room flats.
For example, in Ang Mo Kio in 2016, 3-room flats were 25.9 per cent lower than BTO counterparts. To be clear, this is because they were old flats, and resale 4-room flats there were also below the BTO average.
However, the 4-room counterparts were only around 14.7 per cent below BTO prices, while the 5-room flats still managed to be 16.85 per cent higher than BTO prices.
In Queenstown in 2009, the average price of a resale 3-room flat was around 13.7 per cent lower than a BTO counterpart. Again, these were older flats; but the equally old 4-room flats here were 3.5 per cent higher than the BTO average, and the 5-room units were 1.24 per cent higher.
Another instance is in Geylang which has consistently registered negative a BTO-To-Resale gap since 2017.
If you go through the tables above, you’ll see that in almost every instance where resale prices fall below BTO prices, it’s in the category of 3-room flats.
From anecdotal evidence, realtors have long told us that 3-room flats are harder to sell, and often see lower demand. Agents have also pointed out that, given the relatively low quantum difference between 3-room and 4-room flats, all but the most budget-sensitive buyers will want the 4-room.
4. The gap between BTO and resale prices narrow as the estate ages
From the tables below, you can see the flats in newer estates tend to have a pretty wide gap. As the estate ages and the older the resale flats gets, the narrower this gap becomes. In some cases, it actually turns negative as BTOs start to cost more than its resale peers (such as in Geylang).
| Sengkang Estate | BTO Average Price | Resale Average Price | Average Quantum Gap | Average % Gap | Average Resale Lease Remaining (Years) |
| 2012 | $312,000 | $466,266 | $154,266 | 56.66% | 90.9 |
| 2013 | $283,667 | $478,682 | $195,016 | 81.25% | 91.1 |
| 2014 | $243,500 | $415,008 | $171,508 | 76.61% | 92.0 |
| 2015 | $277,500 | $412,460 | $134,960 | 56.54% | 89.6 |
| 2017 | $279,333 | $402,677 | $123,344 | 50.77% | 89.0 |
| 2018 | $308,667 | $395,699 | $87,032 | 32.52% | 89.2 |
| Yishun Estate | BTO Average Price | Resale Average Price | Average Quantum Gap | Average % Gap | Average Resale Lease Remaining (Years) |
| 2011 | $256,167 | $371,228 | $115,061 | 48.45% | 74.9 |
| 2012 | $278,333 | $407,285 | $128,952 | 50.89% | 74.0 |
| 2013 | $277,500 | $419,352 | $141,852 | 54.28% | 72.6 |
| 2014 | $272,000 | $386,974 | $114,974 | 50.43% | 72.1 |
| 2016 | $223,500 | $329,435 | $105,935 | 51.21% | 71.7 |
| 2017 | $264,167 | $365,526 | $101,359 | 43.04% | 71.3 |
| 2018 | $281,667 | $355,957 | $74,291 | 28.03% | 70.9 |
| Toa Payoh Estate | BTO Average Price | Resale Average Price | Average Quantum Gap | Average % Gap | Average Resale Lease Remaining (Years) |
| 2020 | $530,667 | $518,088 | -$12,579 | -5.78% | 65.7 |
| 2021 | $509,500 | $565,391 | $55,891 | 7.96% | 67.0 |
| Geylang Estate | BTO Average Price | Resale Average Price | Average Quantum Gap | Average % Gap | Average Resale Lease Remaining (Years) |
| 2020 | $462,500 | $413,081 | -$49,419 | -13.06% | 65.3 |
| 2021 | $465,750 | $450,987 | -$14,763 | -4.82% | 66.3 |
This is not too different from private properties where newer leasehold properties are priced more than its older peers for obvious reasons that the land value goes down for leasehold properties over time.
This has a knock-on effect when it comes to financing too. When it comes to bank loans, you may not get the full 75 per cent Loan To Value (LTV) ratio, for properties that have 60 years or less on the lease. Bank loans are no longer possible when the lease falls to 30 years or below.
So if your flat is already 35 years old, your next buyers know they won’t see much resale value. This can lower demand and prices, even if the flat is located in a mature area.
Overall, the price difference between resale flats and BTO flats may be considered low now (based on the estate averages for a 4-room flat), however, it does look set to increase in the near term if history serves as a guide.
Work From Home arrangements, the demand for bigger homes, and construction delays all compound the demand for resale flats, and if BTO prices do not catch up, then this gap is set to widen as it has done so before.
For more on this situation as it unfolds, follow us on Stacked. You can also find in-depth reviews on new and resale developments alike.
At Stacked, we like to look beyond the headlines and surface-level numbers, and focus on how things play out in the real world.
If you’d like to discuss how this applies to your own circumstances, you can reach out for a one-to-one consultation here.
And if you simply have a question or want to share a thought, feel free to write to us at stories@stackedhomes.com — we read every message.
Frequently asked questions
What is the recent trend in the price gap between BTO and resale flats?
How did policy changes affect resale flat prices around 2013?
Are 3-room flats generally worse for resale compared to other flat types?
Does the age of the estate influence the price gap between BTO and resale flats?
Why might resale flat prices rebound sharply after a crisis?
Ryan J. Ong
A seasoned content strategist with over 17 years in the real estate and financial journalism sectors, Ryan has built a reputation for transforming complex industry jargon into accessible knowledge. With a track record of writing and editing for leading financial platforms and publications, Ryan's expertise has been recognised across various media outlets. His role as a former content editor for 99.co and a co-host for CNA 938's Open House programme underscores his commitment to providing valuable insights into the property market.Need help with a property decision?
Speak to our team →Read next from Property Trends
Property Trends The Room That Changed the Most in Singapore Homes: What Happened to Our Kitchens?
Property Trends Condo vs HDB: The Estates With the Smallest (and Widest) Price Gaps

Property Trends Why Upgrading From An HDB Is Harder (And Riskier) Than It Was Since Covid
Property Trends Should You Wait For The Property Market To Dip? Here’s What Past Price Crashes In Singapore Show
Latest Posts

Pro This Singapore Condo Skipped 1-Bedders And Focused On Space — Here’s What Happened 8 Years Later
Singapore Property News One Of The Last Riverfront Condos In River Valley Is Launching — From $2,877 PSF

Property Market Commentary Why Some Old HDB Flats Hold Value Longer Than Others













0 Comments