


When Treasure at Tampines first launched, it was one of those projects that captured the attention of many and divided the opinion of many too. Launched about a year before the onset of the pandemic in March 2019, it sold 272 of 490 units released for sale, at an average of $1,280 psf. This sounds like an insanely afforded price in 2024, given the average new EC price has risen to $1,4/5xx psf).
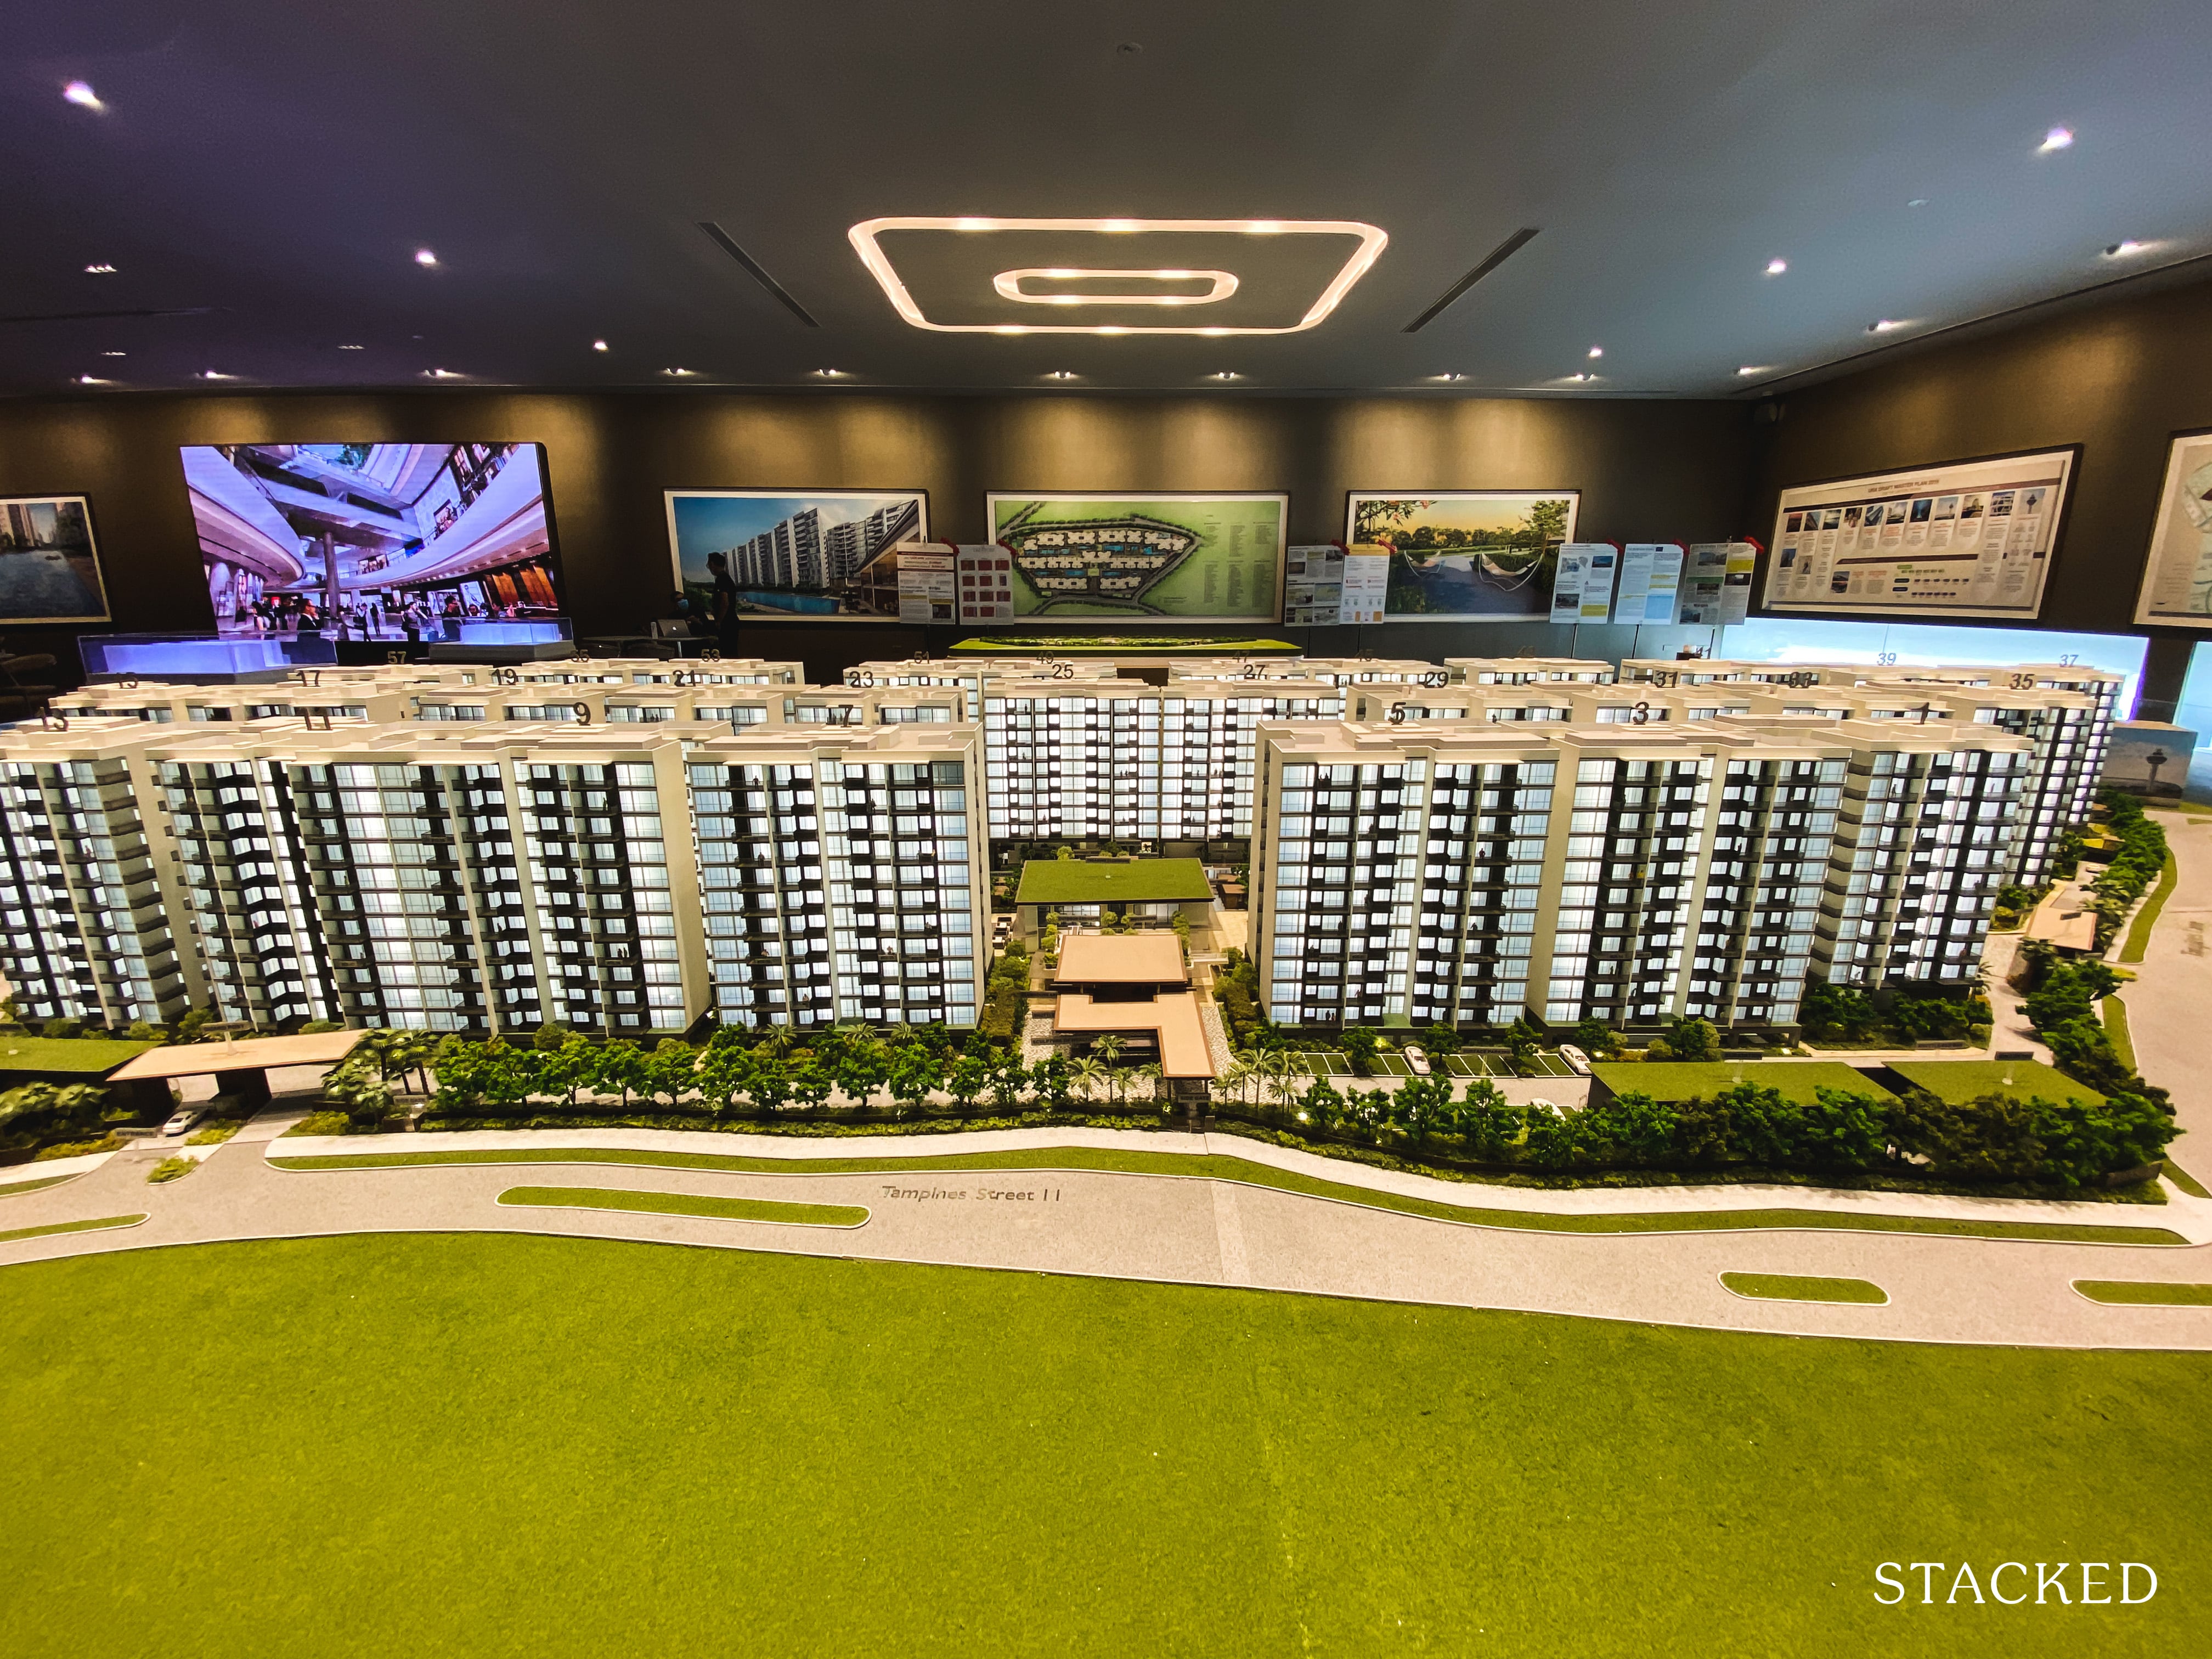
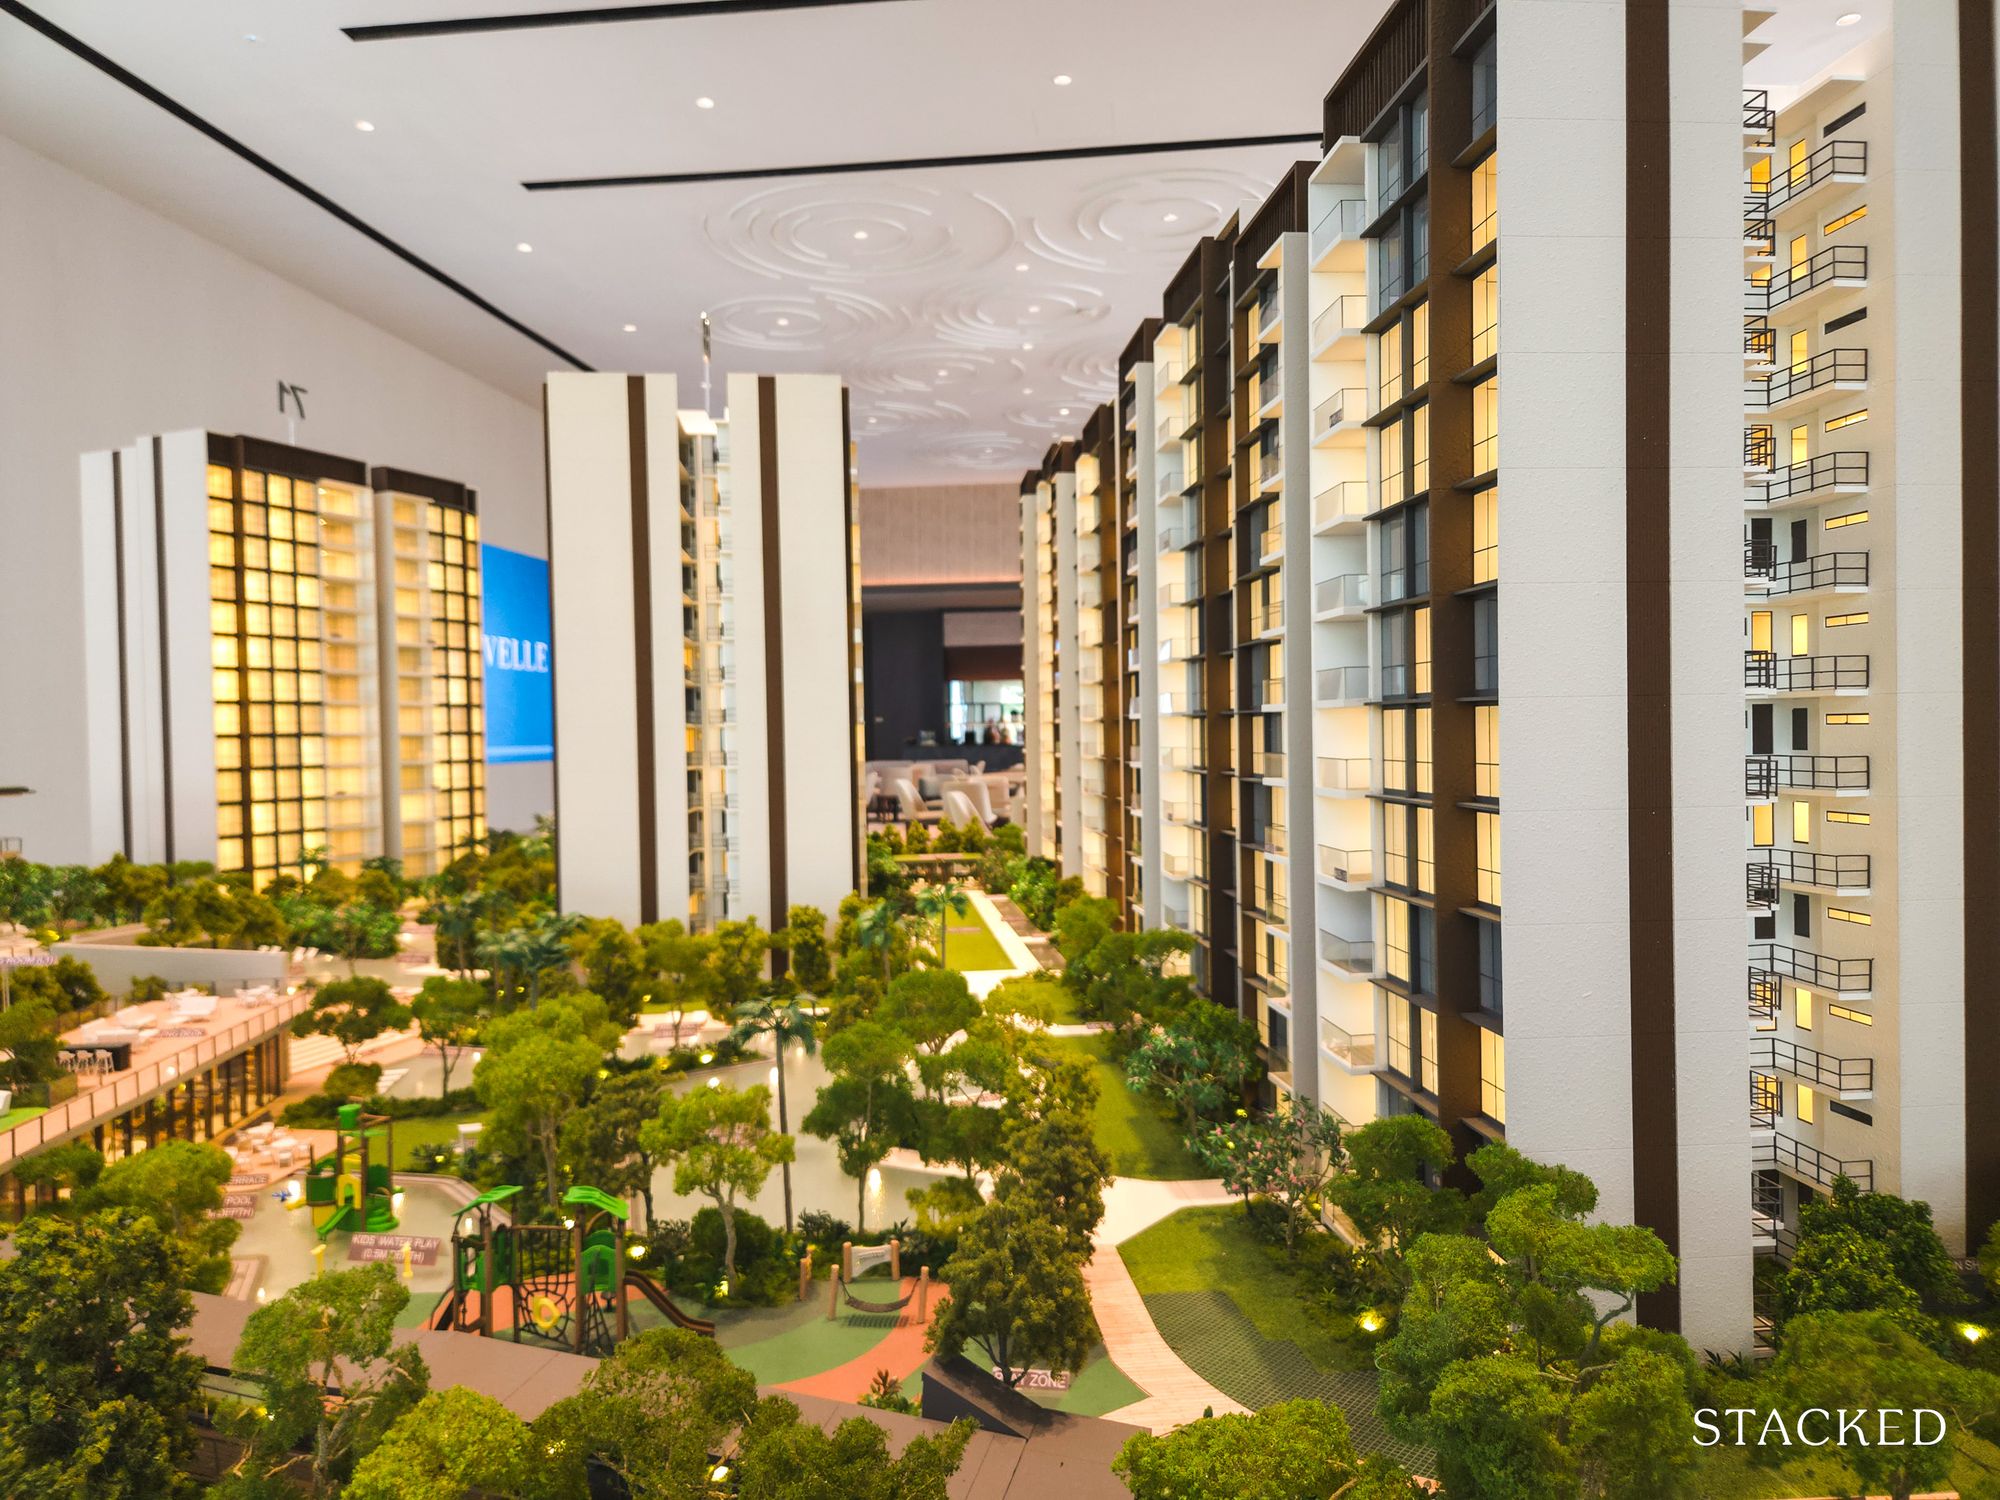
What caught the eye of many though, was its mind-boggling size. It may not be the biggest land plot around, but it certainly was the largest in terms of units – 2,203 to be exact. Despite offering a wide range of facilities, including 11 swimming pools and a 24-hour gym, the unprecedented size of the development raised questions among potential buyers about the feasibility of renting or selling units in such a large complex, due to the internal competition.
That said, the most attractive selling point was its price. At launch, the development was marketed as a full-fledged condo at EC prices. So despite the 5-year ABSD deadline, Treasure at Tampines managed to sell out before its timeline was up.
Fast forward to today though, it is hard to argue against Treasure at Tampines as a success for many buyers. To date, there has been a total of 241 transactions, and all have been profitable so far at an average gross gain of $233,000 or 21.5%.
In fact, a particular unit stood out among all – a 5-bedroom 1,690 square feet unit sold in January 2024 at a stunning profit of close to a million ($981,000).
Here’s a look at the floor plan of the unit:
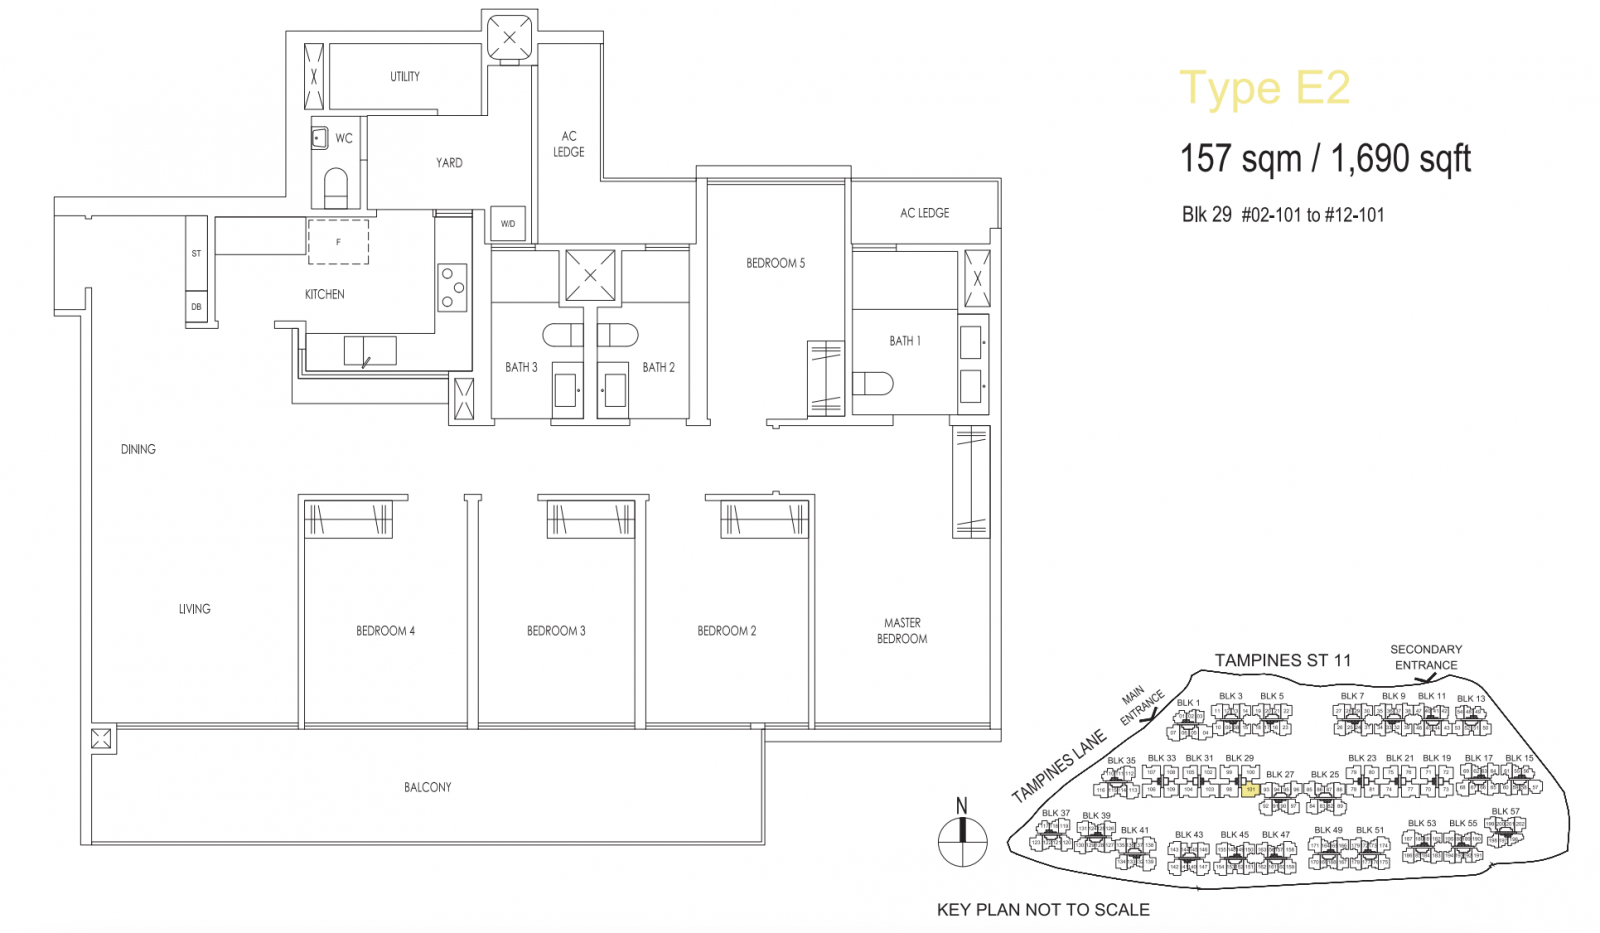
There are many possible reasons why these particular units managed to sell at such high profits, but this is mainly down to the low entry price, and low supply of new units of such sizes.
Some of these 5-bedroom units were bought for under $2 million (again, unheard of in today’s property market), and the earliest was resold in early 2023 for a nearly $500k profit. This has steadily increased over the year, to the highest profit of $981,000 so far.
Even if you think this may be a crazy price to pay, the truth is that it is still the cheapest you can find in the market today – if you are looking for a new 5-bedder unit:
| Project Name | Bought Price | Sell Price | Area (SQFT) | Sell Date | Gains ($) |
| TREASURE AT TAMPINES | $2,089,000 | $2,550,000 | 1,722 | 1/31/2023 | $461,000 |
| TREASURE AT TAMPINES | $1,996,000 | $2,580,000 | 1,690 | 7/7/2023 | $584,000 |
| TREASURE AT TAMPINES | $1,924,000 | $2,600,000 | 1,722 | 1/12/2023 | $676,000 |
| RIVERFRONT RESIDENCES | $2,157,000 | $2,752,888 | 1,679 | 3/6/2023 | $595,888 |
| TREASURE AT TAMPINES | $2,115,000 | $2,788,888 | 1,722 | 9/19/2023 | $673,888 |
| THE GARDEN RESIDENCES | $2,522,500 | $2,790,000 | 1,539 | 4/27/2022 | $267,500 |
| AFFINITY AT SERANGOON | $2,471,000 | $2,860,000 | 1,572 | 8/25/2023 | $389,000 |
| RIVERFRONT RESIDENCES | $2,144,000 | $2,900,000 | 1,679 | 4/27/2023 | $756,000 |
| OLLOI | $2,486,000 | $2,920,000 | 1,625 | 5/23/2023 | $434,000 |
| TREASURE AT TAMPINES | $2,007,000 | $2,988,000 | 1,690 | 1/23/2024 | $981,000 |
| PARC KOMO | $2,596,000 | $3,100,000 | 1,819 | 7/14/2023 | $504,000 |
| KENT RIDGE HILL RESIDENCES | $2,955,000 | $3,173,000 | 1,787 | 10/18/2022 | $218,000 |
| PARC CLEMATIS | $2,647,000 | $3,280,000 | 1,668 | 11/14/2023 | $633,000 |
| PARC CLEMATIS | $2,768,000 | $3,500,000 | 1,711 | 10/25/2023 | $732,000 |
| JADESCAPE | $2,863,600 | $3,570,000 | 1,647 | 11/20/2023 | $706,400 |
| PARK COLONIAL | $2,950,200 | $3,620,000 | 1,711 | 4/4/2023 | $669,800 |
| MARINA ONE RESIDENCES | $3,988,000 | $3,830,000 | 1,561 | 8/1/2022 | -$158,000 |
| RIVIERE | $4,197,600 | $3,900,000 | 1,711 | 12/14/2022 | -$297,600 |
| AMBER 45 | $3,848,000 | $3,920,000 | 1,593 | 3/2/2022 | $72,000 |
| AVENUE SOUTH RESIDENCE | $3,519,000 | $3,950,000 | 1,668 | 12/21/2023 | $431,000 |
| BOULEVARD 88 | $6,261,300 | $6,500,000 | 1,776 | 10/16/2023 | $238,700 |
| BOULEVARD 88 | $6,164,100 | $6,600,000 | 1,776 | 11/9/2023 | $435,900 |
High profits aside, here are a couple of things that we’ve learned from looking at all the sub-sale transactions so far:
| Bedrooms | Sub-sales | Total | Proportion Sold | Avg Profit ($) | Avg Profit (%) |
| 1 | 45 | 231 | 19.5% | $120,214.76 | 18.4% |
| 2 | 87 | 738 | 11.8% | $160,126.34 | 18.3% |
| 3 | 87 | 761 | 11.4% | $302,748.32 | 25.0% |
| 4 | 16 | 363 | 4.4% | $428,368.00 | 25.2% |
| 5 | 5 | 110 | 4.5% | $675,177.60 | 33.4% |
As you might expect, the smaller units such as the 1 and 2-bedders formed a higher proportion of units sold so far, at 19.5% and 11.8% respectively. What is worth highlighting, is that the average gain has increased significantly the bigger the unit gets. As a matter of fact, the 5-bedroom units have recorded nearly double the profit as compared to the smaller units (although it must be said this isn’t unique to Treasure at Tampines, and common to see in other developments).
| Bedrooms | HDB | PRIVATE | Grand Total | |
| 1 | 31 | 13 | 44 | 70.5% |
| 2 | 58 | 22 | 80 | 72.5% |
| 3 | 45 | 36 | 81 | 55.6% |
| 4 | 5 | 8 | 13 | 38.5% |
| 5 | 1 | 4 | 5 | 20.0% |
| Grand Total | 140 | 83 | 223 | 62.8% |
Interestingly enough, a large number of those who bought and sold the smaller 1 and 2-bedders held an HDB address, as compared to the bigger units where a much bigger proportion held a private address.
| Floor | Vol | Proportion | Average $ Gain | Average % Gain |
| 2 | 19 | 8% | $220,257.26 | 21.1% |
| 3 | 31 | 13% | $195,967.74 | 19.6% |
| 4 | 24 | 10% | $234,893.33 | 20.9% |
| 5 | 17 | 7% | $246,875.76 | 22.3% |
| 6 | 26 | 11% | $243,346.15 | 22.7% |
| 7 | 19 | 8% | $226,912.00 | 22.1% |
| 8 | 33 | 14% | $230,148.12 | 22.0% |
| 9 | 20 | 8% | $277,688.80 | 22.1% |
| 10 | 20 | 8% | $229,283.20 | 20.7% |
| 11 | 18 | 8% | $228,987.56 | 21.8% |
| 12 | 13 | 5% | $255,452.92 | 22.5% |
| Grand Total | 240 | $232,956.40 | 21.5% |
We did take a look at profits per floor level too, but there wasn’t much to glean from this given that Treasure at Tampines isn’t a tall development anyway and isn’t really a point of differentiation for buyers.
| Stack | Vol | Proportion | % Gain |
| 21 | 5 | 2.1% | 16.9% |
| 29 | 5 | 2.1% | 17.7% |
| 90 | 5 | 2.1% | 17.2% |
| 151 | 5 | 2.1% | 24.5% |
| 167 | 5 | 2.1% | 22.9% |
| 10 | 4 | 1.7% | 24.7% |
| 24 | 4 | 1.7% | 19.3% |
| 30 | 4 | 1.7% | 22.0% |
| 49 | 4 | 1.7% | 28.0% |
| 63 | 4 | 1.7% | 17.2% |
| 110 | 4 | 1.7% | 24.5% |
| 152 | 4 | 1.7% | 18.7% |
| 161 | 4 | 1.7% | 10.0% |
| 162 | 4 | 1.7% | 25.2% |
| 1 | 3 | 1.3% | 28.0% |
| 8 | 3 | 1.3% | 19.0% |
| 41 | 3 | 1.3% | 23.1% |
| 52 | 3 | 1.3% | 15.8% |
| 54 | 3 | 1.3% | 23.5% |
| 58 | 3 | 1.3% | 16.8% |
| 61 | 3 | 1.3% | 26.8% |
| 144 | 3 | 1.3% | 15.9% |
| 145 | 3 | 1.3% | 17.0% |
| 149 | 3 | 1.3% | 19.2% |
| 153 | 3 | 1.3% | 19.6% |
| 155 | 3 | 1.3% | 26.5% |
| 165 | 3 | 1.3% | 14.1% |
| 172 | 3 | 1.3% | 13.6% |
| 176 | 3 | 1.3% | 25.6% |
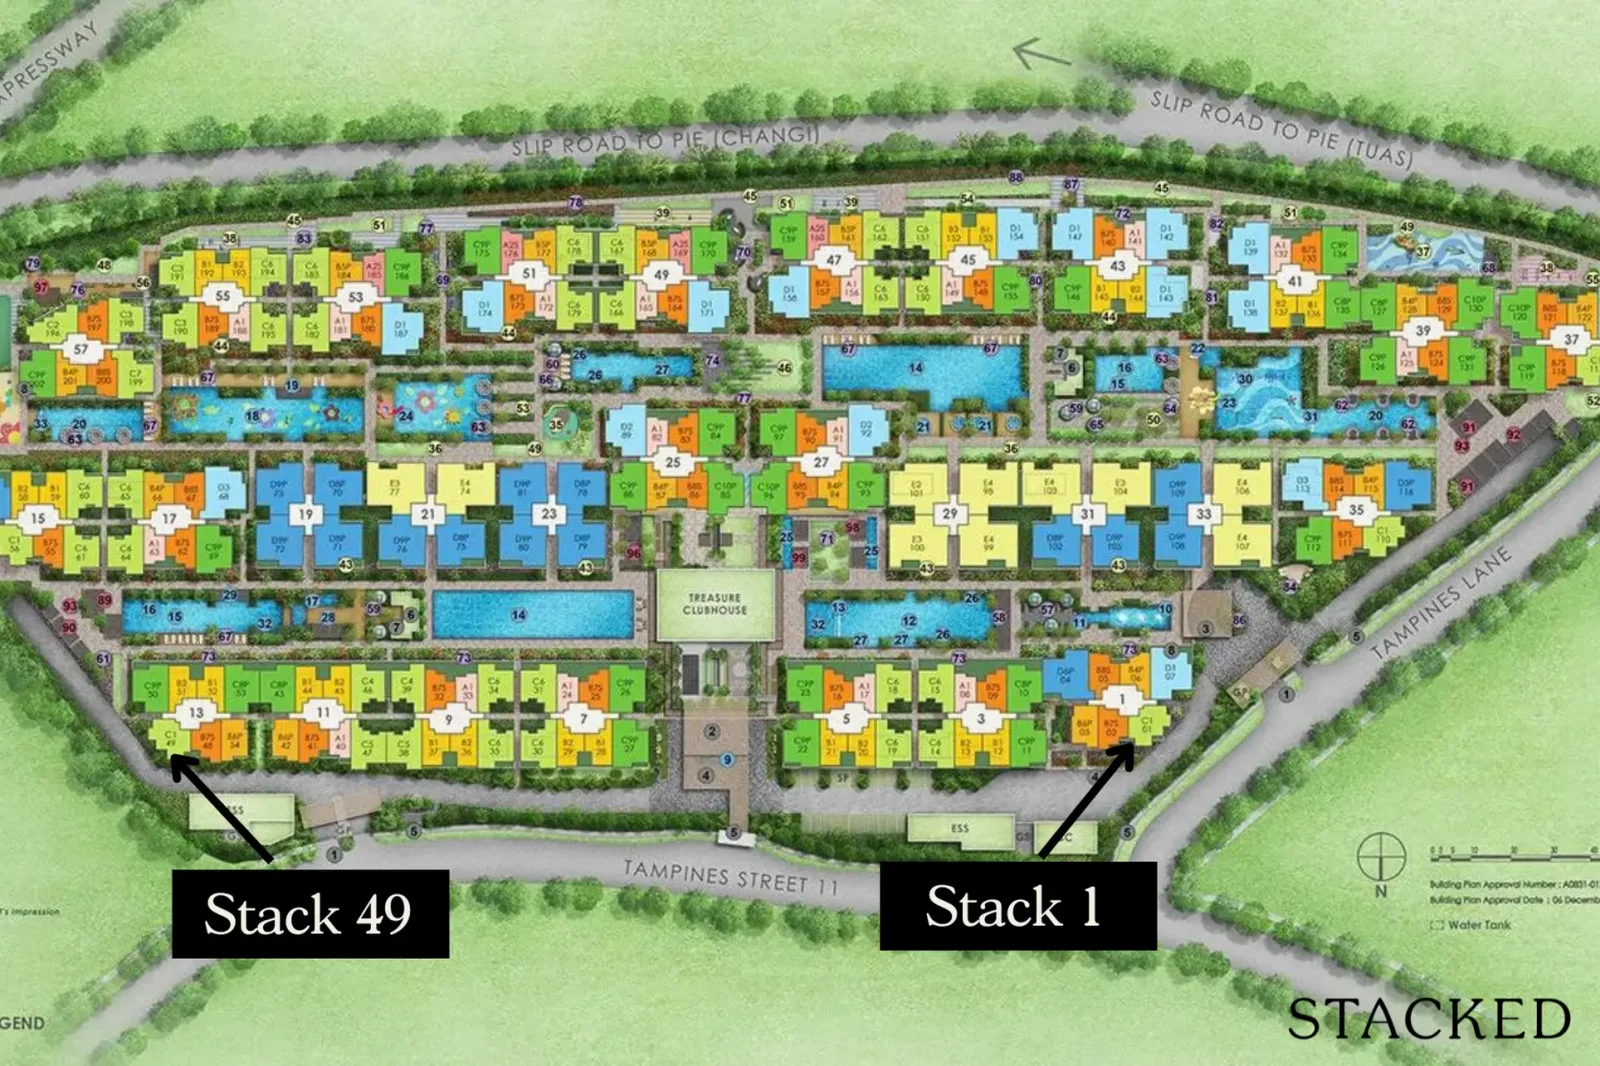
Looking at a breakdown of the stacks sold, the most popular were 21, 29, 90, 151 and 167. All are outward-facing (main road) except for stack 90 which faces the pool. But the highest gains were found in stacks 49 and 1; curiously enough, both stacks are found on the opposite ends of the development facing outwards. There are not a lot of transactions to go by yet, but perhaps it points to the popularity of units in such developments that face away from neighbours and the hustle and bustle internally.
As I mentioned in the Jadescape piece, it’s certainly interesting to see the performances of these mega developments as they start hitting the resale market. While they’ve been doing great so far, more supply is already hitting the market, which would be something to look out for in 2024. Do sign up for our newsletter here as we post more updates on such developments.
At Stacked, we like to look beyond the headlines and surface-level numbers, and focus on how things play out in the real world.
If you’d like to discuss how this applies to your own circumstances, you can reach out for a one-to-one consultation here.
And if you simply have a question or want to share a thought, feel free to write to us at stories@stackedhomes.com — we read every message.

0 Comments