


“When is the best time to buy a property?” echoes as one of the most perennial questions in the world of real estate, often shadowed by the equally common “when is the best time to sell your property?” This week, we’re delving into this question, armed not with vague aphorisms like “the best time to buy a home is always five years ago,” but a look back at what historical data may tell us.
Let’s first acknowledge these well-worn sayings. They encapsulate a general truth in the real estate world but fall short of providing actionable insights. The quest for the ‘best time to buy’ often meets the frustrating response of “there’s no crystal ball.” However, our approach this week has been different.
We dived into property market trends over the past decades, and focused on pinpointing the periods which historically have yielded the highest gains for buyers. Our findings? They might surprise you.
So many readers write in because they're unsure what to do next, and don't know who to trust.
If this sounds familiar, we offer structured 1-to-1 consultations where we walk through your finances, goals, and market options objectively.
No obligation. Just clarity.
Learn more here.
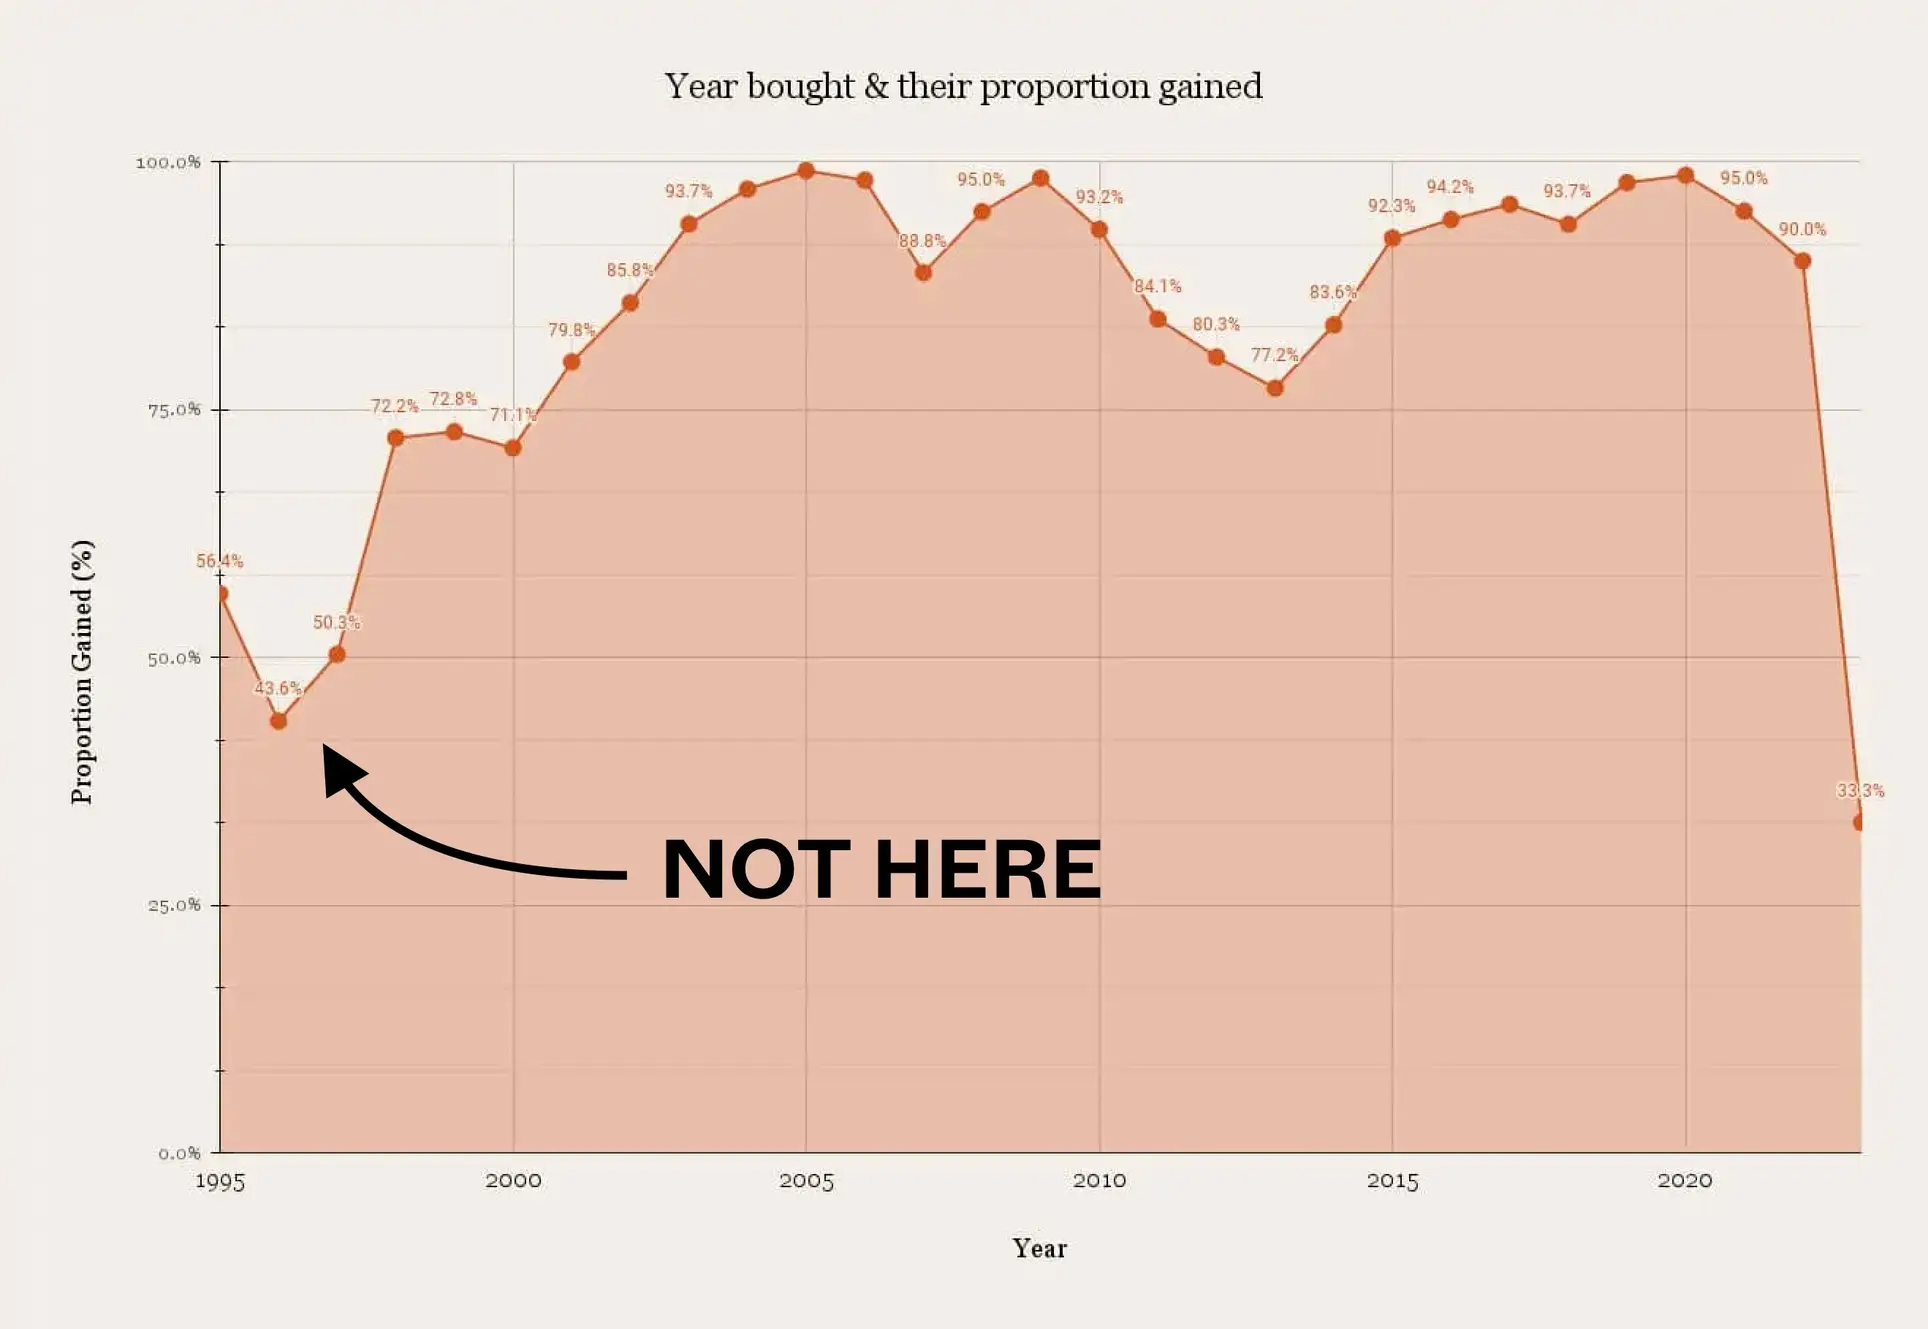
Gains based on year of purchase:

| Year | Breakeven | Gain | Loss | Grand Total | Proportion Gained (%) |
| 1995 | 22 | 3,763 | 2,884 | 6669 | 56.4% |
| 1996 | 55 | 4,270 | 5,475 | 9800 | 43.6% |
| 1997 | 25 | 3,089 | 3,026 | 6,140 | 50.3% |
| 1998 | 20 | 4,547 | 1,735 | 6,302 | 72.2% |
| 1999 | 32 | 7,639 | 2,826 | 10,497 | 72.8% |
| 2000 | 9 | 3,625 | 1,462 | 5,096 | 71.1% |
| 2001 | 9 | 4,482 | 1,124 | 5,615 | 79.8% |
| 2002 | 23 | 7,687 | 1,252 | 8,962 | 85.8% |
| 2003 | 10 | 4,598 | 297 | 4,905 | 93.7% |
| 2004 | 2 | 5,175 | 144 | 5,321 | 97.3% |
| 2005 | 1 | 8,068 | 71 | 8,140 | 99.1% |
| 2006 | 3 | 11,600 | 214 | 11,817 | 98.2% |
| 2007 | 41 | 18,782 | 2,324 | 21,147 | 88.8% |
| 2008 | 10 | 6,338 | 325 | 6,673 | 95.0% |
| 2009 | 5 | 14,606 | 238 | 14,849 | 98.4% |
| 2010 | 40 | 14,440 | 1,016 | 15,496 | 93.2% |
| 2011 | 62 | 9,974 | 1,817 | 11,853 | 84.1% |
| 2012 | 80 | 9,493 | 2,247 | 11,820 | 80.3% |
| 2013 | 34 | 5,350 | 1,548 | 6,932 | 77.2% |
| 2014 | 23 | 2,536 | 476 | 3,035 | 83.6% |
| 2015 | 16 | 3,146 | 246 | 3,408 | 92.3% |
| 2016 | 20 | 3,110 | 172 | 3,302 | 94.2% |
| 2017 | 8 | 3,689 | 157 | 3,854 | 95.7% |
| 2018 | 7 | 2,218 | 142 | 2,367 | 93.7% |
| 2019 | 1,589 | 34 | 1,623 | 97.9% | |
| 2020 | 1 | 656 | 8 | 665 | 98.6% |
| 2021 | 134 | 7 | 141 | 95.0% | |
| 2022 | 9 | 1 | 10 | 90.0% | |
| 2023 | 3 | 2 | 1 | 6 | 33.3% |
Some observations from the above:
1. The shortest holding period (from 2020) has seen the lowest
This is likely from sellers trying to recognise quick gains, and making sub-sale transactions. If you got the unit with an early bird discount at launch, you might consider flipping it even before the TOP, if the price is now higher. For example:
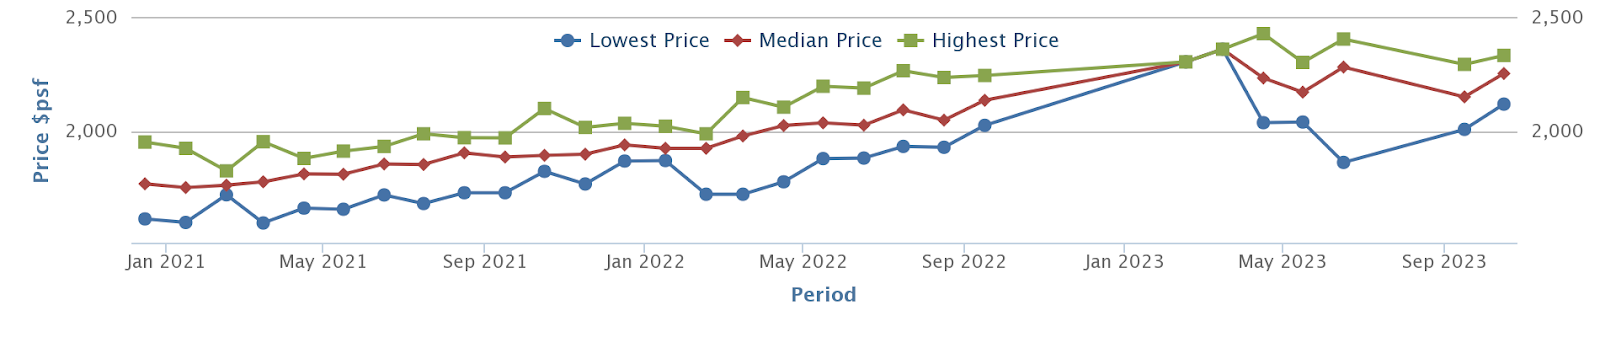
If you bought Ki Residences at launch in December 2020, you might paid about $1,766 psf. By September 2022, the median price had risen to $2,133 psf, and by October 2023 it was around $2,251 psf.
If you were in the earliest batch of buyers, you may have during those times in ‘22 or ‘23, to recognise gains even before the condo was completed. The gains may not be as substantial as someone who waited 10 to 15 years, but you make up for this with a faster return.
This seems to verify the saying that shorter holding periods tend to bring smaller gains; but at the same time, we can see it’s not entirely bad.. Recognising your gains sooner can mean an immediate upgrade.
2. The market adapted to the TDSR quite quickly
The Total Debt Servicing Ratio (TDSR) was introduced in 2013, capping monthly loan repayments – plus other outstanding debts – to 60 per cent of monthly income (as of 2023, this has been decreased to 55 per cent).
We can see this created a visible dent when it was first introduced, with gains falling to 77.2 per cent, down from around 80 and 84 per cent in the years prior. The loan curb forced sellers to trim prices, so that buyers could obtain sufficient financing.
However, we can also see how quickly the effect faded, as the very next year sellers started to see stronger gains.

3. The biggest cooling measure was actually in 1996
Do you think the worst cooling measures were in 2011 with ABSD? Not in the least. It pales in comparison to 1996, when a slew of cooling measures took place all at once.
If you look above, 1996 saw 5,475 losing transactions, compared to 4,270 gains. It was one of the only years in the Singapore property market for those who bought a property, in which more future sellers saw losses than gains. The next year, the Asian Financial Crisis hit and further stifled recovery, with gains and losses being near equal 3,089 gains to 3,026 losses).
Given this has so far been one of the worst periods to buy a property, let’s look closer to see what the numbers show:
| Holding Period (Years) | |||
| Year Bought | Breakeven | Gain | Loss |
| 1995 | 6.4 | 10.5 | 7.6 |
| 1996 | 6.2 | 13.7 | 7.2 |
| 1997 | 9.0 | 15.2 | 7.4 |
For those who bought between 1995 to 1997, it took a shorter period to break even than it did to register a gain or loss. Unsurprisingly, you had to hold for an average of more than 10 years to realise any gains.
However given how the holding period is such an important factor in whether some people would profit/lose from their property, let’s look further into it:
| Year Bought | Held > 3 Years | Held < 3 Years | Grand Total | % Held < 3 Years & Lost Money |
| 1995 | 5,145 | 1,477 | 6,622 | |
| Breakeven | 16 | 3 | 19 | |
| Gain | 2,484 | 1,264 | 3,748 | |
| Loss | 2,645 | 210 | 2,855 | 14.2% |
| 1996 | 7,984 | 1,635 | 9,619 | |
| Breakeven | 28 | 15 | 43 | |
| Gain | 3,501 | 753 | 4,254 | |
| Loss | 4,455 | 867 | 5,322 | 53.0% |
| 1997 | 5,451 | 628 | 6,079 | |
| Breakeven | 17 | 6 | 23 | |
| Gain | 2,922 | 158 | 3,080 | |
| Loss | 2,512 | 464 | 2,976 | 73.9% |
From the numbers, if you bought in 1995 and sold 3 years or less later, 14.2% lost money. But if you had bought in 1996 and sold 3 years or less later, a stunning 53% would have lost money. The worst year was in 1997, where if you sold 3 years or less later the majority would have lost money (74%). This coincides with the property cycle, where 1998 was rock bottom but the market never really recovered till 2006/07.
| Quantum Gains/Loss | ||
| Year Bought | Gain | Loss |
| 1995 | $312,385 | -$197,079 |
| 1996 | $333,801 | -$265,001 |
| 1997 | $303,910 | -$237,176 |
That said, average gains ultimately were still higher than losses (also because the more than 10 years average holding period) is a long time.
Since that time, sellers have never seen a repeat of such a trying time. But it is a reminder that such things can and have happened before. So even if you have a long holding period, there’s still a risk of being unlucky and being made to sell right after severe cooling measures or a wider market downturn. Hopefully, this doesn’t happen just as you’re downgrading for retirement!
4. Most sellers are winners, whenever they transact
Singapore property investors are quite lucky, in how safe our market is. Overall, you’re more likely to see gains than losses in any given year (barring exceptions like ‘96 and ‘97).
As such, we should focus more on the risks arising from our own finances, rather than worrying about the market.
In the coming years, however, we’re likely to see longer holding periods
Realtors have been complaining about their lack of inventory, and Singaporeans becoming resistant to selling. Almost every realtor we spoke to pointed the finger toward the same issue: the cost of replacement properties.
The consensus is that home prices rose far too quickly during the post-pandemic period, on the back of a severe housing shortage. One realtor reminded us of a “poor reading” of the market by experts in 2019, which warned of oversupply risks despite the exact opposite happening.
One realtor noted that new launch three-bedder condos are now reaching over $2 million, and even resale counterparts are crossing the $1.8 million mark. She says that: “If you sell your $600,000 flat now, what can you buy that is within your budget, and also comfortable enough for your family? Buyers have concluded that it’s not enough, but sellers are still unrealistic because of the last few years.”
Regardless, the lack of purchasing power or buyer interest is unlikely to lower prices. Moves like tightening the TDSR have ensured most homeowners are very well-capitalised, and don’t feel any urgency.
On top of that, the government has imposed a waiting period of 15 months to buy a resale flat, for those who just sold a private property. This is also along with new rules of the Prime Location Housing (PLH) model, where there will now be a 10-year MOP instead of the current 5 years. Coupled with high seller expectations, this is likely to cause fewer resale transactions and longer holding periods.
At Stacked, we like to look beyond the headlines and surface-level numbers, and focus on how things play out in the real world.
If you’d like to discuss how this applies to your own circumstances, you can reach out for a one-to-one consultation here.
And if you simply have a question or want to share a thought, feel free to write to us at stories@stackedhomes.com — we read every message.

0 Comments