Why Rivergate Outperformed Its District 9 Rivals—Despite Being Nearly 20 Years Old

Get The Property Insights Serious Buyers Read First: Join 50,000+ readers who rely on our weekly breakdowns of Singapore’s property market.

A seasoned content strategist with over 17 years in the real estate and financial journalism sectors, Ryan has built a reputation for transforming complex industry jargon into accessible knowledge. With a track record of writing and editing for leading financial platforms and publications, Ryan's expertise has been recognised across various media outlets. His role as a former content editor for 99.co and a co-host for CNA 938's Open House programme underscores his commitment to providing valuable insights into the property market.
In this Stacked Pro breakdown:
Comparison
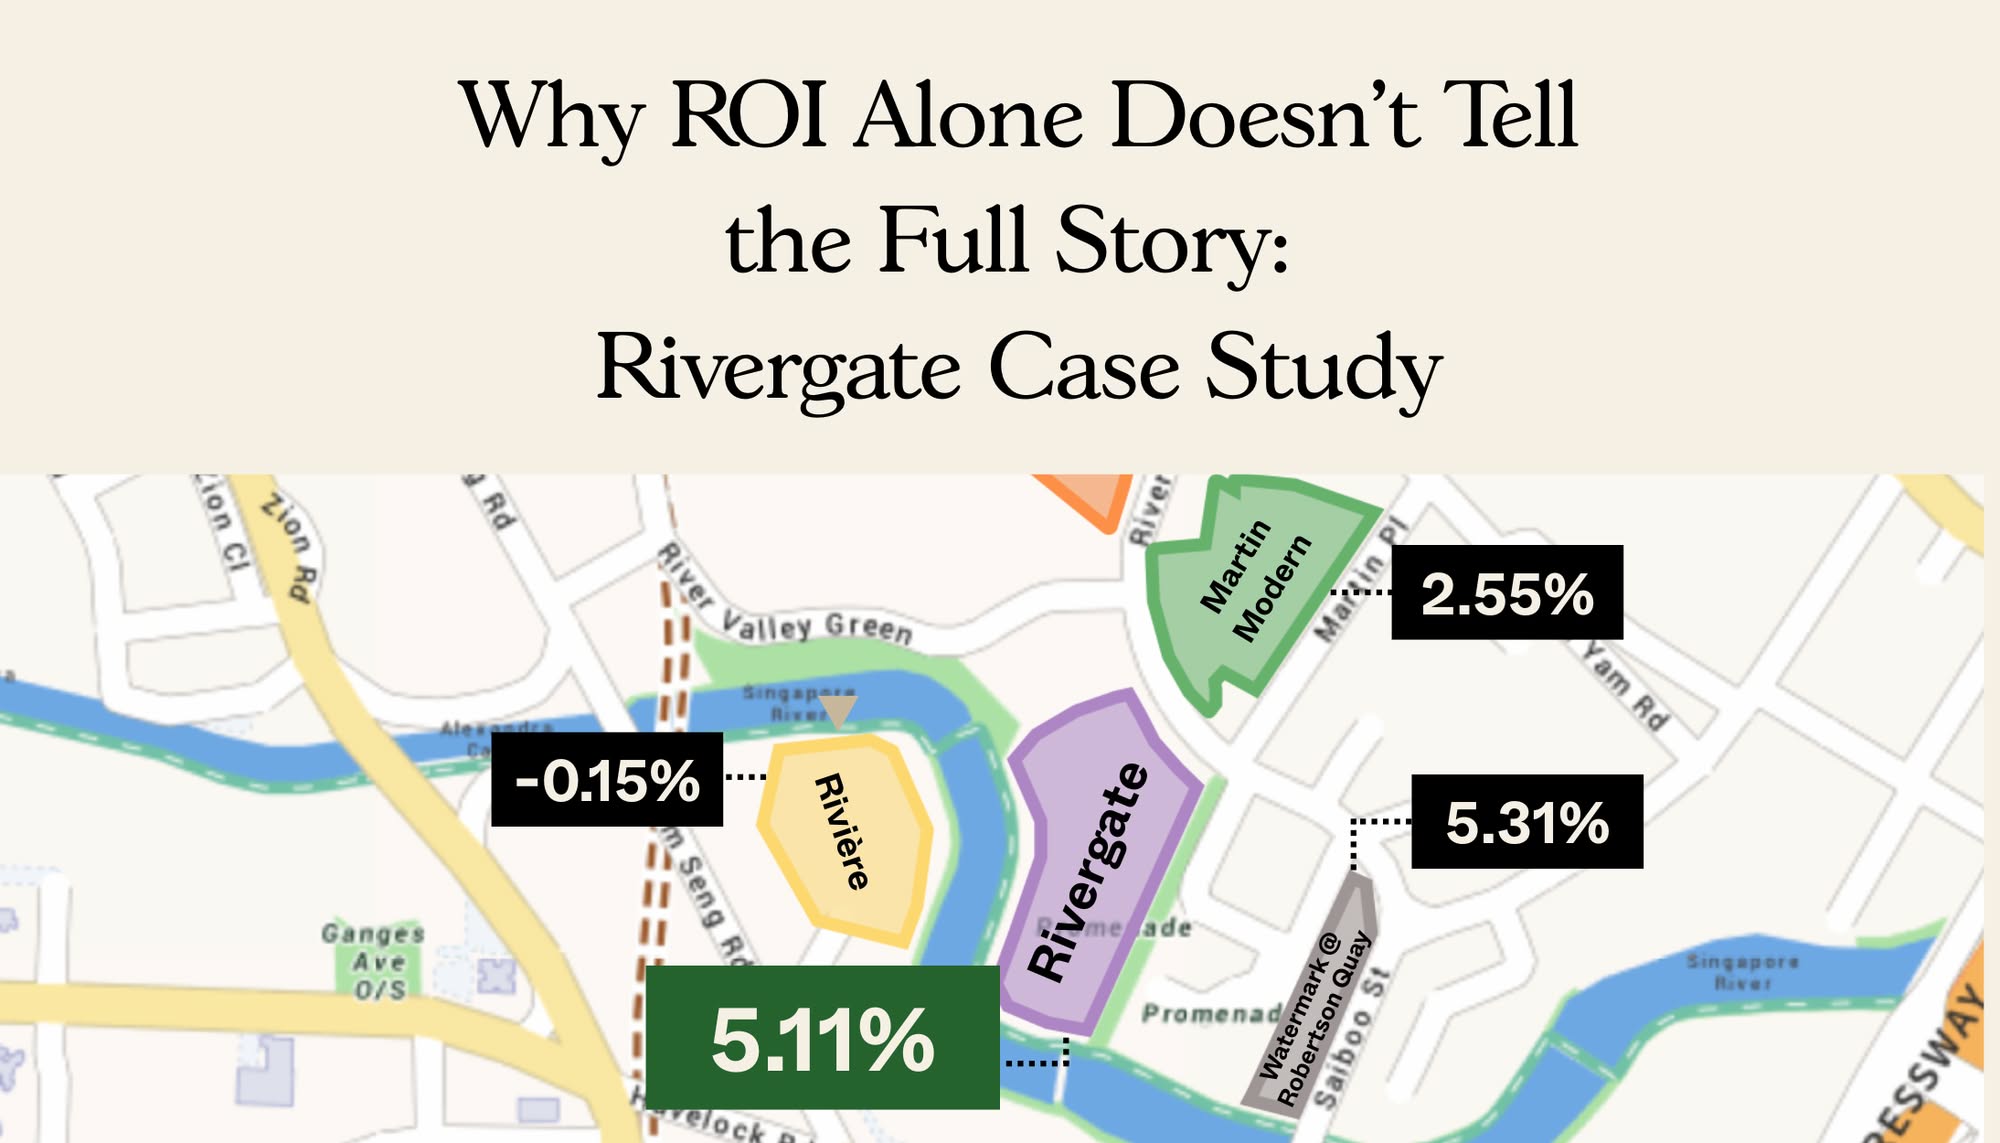
We analysed Rivergate, a freehold development in Robertson Quay launched in 2005, and tracked its price movement from 2005 to 2024. We compared it against nearby condos in District 9, other freehold projects launched in the same period, and recent resale performance across 2-, 3-, and 4-bedroom segments.
Key Insight
Despite its age, Rivergate outpaced most peers in resale price growth from 2015 to 2024, especially in the 3- and 4-bedder segments. Even with newer projects entering the market, it continues to be a top pick for its large layouts and strong returns.
Why This Matters
As new launches get smaller and more expensive, older freehold condos like Rivergate prove that size, layout, and location can still win.
🔓 Read the full data breakdown — only on Stacked Pro.
Already a subscriber? Log in here.
In a numbers-obsessed market, ROI tends to dominate the conversation. And yet, condos like Rivergate challenge that viewpoint. Even though its long-term gains don’t always top the charts, this freehold condo has something many others lack: consistency and a unique appeal to family buyers, particularly in a strong central location. Since its launch in 2005, Rivergate has quietly delivered solid performance in the 3- and 4-bedroom segments, and one of the highest volumes of profitable transactions. In this Stacked Pro breakdown, we explore why ROI alone doesn’t tell the full story, and how Rivergate proves that value goes beyond this simple metric.
A quick profile of Rivergate
Rivergate is a freehold condominium located at Robertson Quay in District 9, which was completed in 2009. This is a notably tall project, consisting of 43-storey towers with a total of 545 units. It’s also within walking distance of Great World and Havelock MRT stations (Thomson-East Coast Line), and is situated right at the Robertson Quay lifestyle area.
As we’ll see below, this project is also outstanding for large units, with even two-bedders reaching over 1,000 sq. ft., and four-bedders coming close to 1,900 sq. ft.
Let’s start by looking at the overall performance of Rivergate, from launch to 2024
Year | Average $PSF |
2005 | $1,102 |
2006 | $1,338 |
2007 | $1,660 |
2008 | $1,512 |
2009 | $1,465 |
2010 | $1,902 |
2011 | $2,042 |
2012 | $2,063 |
2013 | $2,085 |
2014 | $2,059 |
2015 | $1,909 |
2016 | $1,942 |
2017 | $2,033 |
2018 | $2,233 |
2019 | $2,206 |
2020 | $2,284 |
2021 | $2,477 |
2022 | $2,744 |
2023 | $2,807 |
2024 | $2,843 |
Annualised | 5.11% |
Rivergate was launched in 2005 at an average of $1,102 psf, and by 2024, that figure has grown to $2,843 psf; an annualised growth rate of 5.11 per cent over two decades.
We see some short-term fluctuations during the 2008 financial crisis and the 2013 to 2015 cooling measures period; but overall, Rivergate has shown remarkable resilience. Notably, prices rebounded strongly post-2015 and continued to grow, even through periods when other luxury condos in District 9 saw stagnation or decline (more on this below).
Next, we’ll compare its performance to other freehold/999-year leasehold condos across Singapore, and subsequently to District 9 in particular.

Year | Rivergate | D09 condos | All 999-year/FH condos |
2005 | $1,102 | $965 | $699 |
2006 | $1,338 | $1,231 | $829 |
2007 | $1,660 | $1,870 | $1,130 |
2008 | $1,512 | $1,630 | $1,055 |
2009 | $1,465 | $1,539 | $1,066 |
2010 | $1,902 | $2,015 | $1,303 |
2011 | $2,042 | $2,089 | $1,388 |
2012 | $2,063 | $2,070 | $1,393 |
2013 | $2,085 | $2,206 | $1,553 |
2014 | $2,059 | $2,069 | $1,505 |
2015 | $1,909 | $1,941 | $1,438 |
2016 | $1,942 | $1,904 | $1,470 |
2017 | $2,033 | $1,967 | $1,501 |
2018 | $2,233 | $2,434 | $1,617 |
2019 | $2,206 | $2,360 | $1,797 |
2020 | $2,284 | $2,258 | $1,688 |
2021 | $2,477 | $2,407 | $1,812 |
2022 | $2,744 | $2,476 | $1,995 |
2023 | $2,807 | $2,599 | $2,111 |
2024 | $2,843 | $2,441 | $2,003 |
Annualised | 5.11% | 5.01% | 5.7% |
If we look at simple annualised growth in this way (e.g., not differentiating between transaction types), Rivergate’s annualised growth of 5.11 per cent is very slightly below the average of 5.23 per cent for District 9; although a difference of 0.12 per cent is arguably negligible.
In terms of the island-wide average for 999-year and freehold condos, Rivergate does fall behind by a little over half a percentage point; it’s at 5.11 per cent versus the wider average of 5.7 per cent.
Here we have our first point of caution, in oversimplifying ROI. Notice that while Rivergate is behind the District 9 average by a thin sliver, it managed to avoid steep declines during tough market years: these are 2008, 2014, and 2015 in particular, when other high-end condos saw much sharper corrections.
In fact, between 2023 and 2024, when average prices across District 9 and the wider market dipped slightly, Rivergate continued to inch upward, from $2,807 to $2,843 psf.
In other words, Rivergate may not have the flashiest ROI numbers, but it has delivered strong, stable growth with very few down years; this makes it a safe bet in the (often volatile) high-end condo market.
To exclude possible distortions from developer pricing, let’s look at its performance in terms of resale transactions alone

Year | Rivergate | D09 condos | All 999-year/FH condos |
2009 | $1,732 | $1,347 | $894 |
2010 | $1,902 | $1,658 | $1,045 |
2011 | $2,042 | $1,821 | $1,190 |
2012 | $2,063 | $1,949 | $1,292 |
2013 | $2,085 | $2,047 | $1,419 |
2014 | $2,059 | $1,957 | $1,360 |
2015 | $1,909 | $1,917 | $1,358 |
2016 | $1,942 | $1,838 | $1,393 |
2017 | $2,033 | $1,951 | $1,461 |
2018 | $2,233 | $2,336 | $1,523 |
2019 | $2,206 | $2,313 | $1,571 |
2020 | $2,284 | $2,128 | $1,486 |
2021 | $2,477 | $2,228 | $1,584 |
2022 | $2,744 | $2,242 | $1,706 |
2023 | $2,807 | $2,251 | $1,786 |
2024 | $2,843 | $2,310 | $1,835 |
Annualised | 3.36% | 3.66% | 4.91% |
So far, it seems congruent with the wider snapshot. Between 2009 and 2024, Rivergate recorded an annualised growth of 3.36 per cent for resale prices. Again, this trails behind the District 9 average of 3.66 per cent, and the islandwide freehold/999-year benchmark of 4.91 per cent. But this does not tell you the full story.
If we look from 2020 onward (i.e., in the aftermath of COVID and beyond), Rivergate outpaced the broader market, growing from $2,284 psf to $2,843 psf. This is a 24.5 per cent increase in just four years, outstripping resale growth in both District 9 and the wider freehold segment in the same period.
This suggests market changes in the years since COVID have disproportionately benefited Rivergate. COVID changed what homebuyers were seeking, and Rivergate became a beneficiary of renewed interest in spacious city-fringe units.
So while the resale CAGR looks conservative over 15 years, Rivergate’s recent trajectory shows a shift about to happen; and it shows how we need to re-evaluate ROI within specific timeframes.
Next, let’s make a comparison between Rivergate and its neighbouring condos
Project | Tenure | Launch year | Completion year | No. of units |
Yong An Park | Freehold | 1986 | 288 | |
Mirage Tower | Freehold | 1996 | 248 | |
Roberson 100 | Freehold | 2002 | 2004 | 186 |
Watermark Robertson Quay | Freehold | 2005 | 2008 | 206 |
The Cosmopolitan | Freehold | 2005 | 2008 | 228 |
Rivergate | Freehold | 2005 | 2009 | 545 |
Tribeca by the Waterfront | Freehold | 2006 | 2010 | 175 |
The Trillium | Freehold | 2007 | 2010 | 231 |
Martin Place Residences | Freehold | 2008 | 2011 | 302 |
Centennia Suites | Freehold | 2010 | 2013 | 97 |
Martin Modern | 99-year | 2017 | 2021 | 450 |
Riviere | 99-year | 2019 | 2023 | 455 |
The Avenir | Freehold | 2020 | 2024 | 376 |
Irwell Hill Residences | 99-year | 2021 | 2024 | 540 |
Now we’ll look at their ROI for comparison, and we’ll start by looking at ROI since launch (i.e., all transactions, including new and resale).
Year | Roberson 100 | Watermark Robertson Quay | The Cosmopolitan | Rivergate | Tribeca by the Waterfront | The Trillium | Martin Place Residences | Centennia Suites | Martin Modern | Riviere | The Avenir | Irwell Hill Residences |
2002 | $885 | |||||||||||
2003 | $910 | |||||||||||
2004 | $897 | |||||||||||
2005 | $855 | $852 | $1,076 | $1,102 | ||||||||
2006 | $897 | $1,005 | $1,237 | $1,338 | $1,422 | |||||||
2007 | $1,256 | $1,408 | $1,712 | $1,660 | $1,569 | $1,736 | ||||||
2008 | $1,298 | $1,310 | $1,563 | $1,512 | $999 | $1,817 | $1,786 | |||||
2009 | $1,197 | $1,151 | $1,501 | $1,465 | $1,442 | $1,648 | $1,482 | |||||
2010 | $1,500 | $1,502 | $1,945 | $1,902 | $1,788 | $1,964 | $1,792 | $1,974 | ||||
2011 | $1,669 | $1,676 | $2,008 | $2,042 | $1,896 | $2,048 | $1,974 | $2,142 | ||||
2012 | $1,657 | $1,718 | $2,066 | $2,063 | $1,941 | $2,196 | $2,130 | |||||
2013 | $1,813 | $1,691 | $2,117 | $2,085 | $1,885 | $2,157 | $2,170 | $2,322 | ||||
2014 | $1,825 | $1,832 | $2,025 | $2,059 | $1,713 | $2,000 | $2,049 | $2,285 | ||||
2015 | $1,735 | $1,690 | $1,982 | $1,909 | $1,839 | $2,043 | $2,088 | $2,097 | ||||
2016 | $1,770 | $1,623 | $1,852 | $1,942 | $1,775 | $1,848 | $1,973 | $2,038 | ||||
2017 | $1,702 | $1,759 | $1,977 | $2,033 | $1,787 | $1,843 | $2,053 | $2,156 | $2,254 | |||
2018 | $1,716 | $1,902 | $2,313 | $2,233 | $1,931 | $2,095 | $2,218 | $2,695 | $2,734 | |||
2019 | $1,872 | $1,931 | $2,308 | $2,206 | $2,018 | $2,047 | $2,244 | $2,489 | $2,683 | $2,894 | ||
2020 | $2,000 | $1,831 | $2,316 | $2,284 | $2,032 | $2,213 | $2,175 | $2,629 | $2,624 | $2,610 | $3,149 | |
2021 | $1,931 | $1,956 | $2,364 | $2,477 | $2,159 | $2,325 | $2,364 | $2,444 | $2,736 | $2,665 | $3,146 | $2,663 |
2022 | $2,009 | $2,093 | $2,473 | $2,744 | $2,218 | $2,639 | $2,463 | $2,922 | $2,649 | $2,868 | $3,209 | $2,858 |
2023 | $2,264 | $2,264 | $2,591 | $2,807 | $2,489 | $2,661 | $2,551 | $2,729 | $3,066 | $3,147 | $2,916 | |
2024 | $2,177 | $2,279 | $2,778 | $2,843 | $2,493 | $2,570 | $2,599 | $2,846 | $2,688 | $2,898 | $3,372 | $2,805 |
Annualised | 4.18% | 5.32% | 5.12% | 5.11% | 3.17% | 2.34% | 2.37% | 2.65% | 2.55% | 0.03% | 1.72% | 1.74% |
Due to a lack of transaction data prior to 1995, we can’t look at the performance of the older projects from their launch date, so we have excluded Mirage Tower and Yong An Park.
We would consider Rivergate’s performance to be quite impressive, compared to its neighbours. Despite being nearly 20 years old, Rivergate is still one of the top performers in its immediate vicinity, with an ROI of 5.11 per cent.
Rivergate very narrowly trails Watermark Robertson Quay (5.32 per cent), while Martin Modern and Riviere – launched from 2017 and 2019 respectively – underperformed Rivergate at 2.55 per cent and 0.03 per cent, respectively.
Irwell Hill Residences, one of the newest launches in the area (TOP 2024), has only managed an annualised ROI of 1.74 per cent so far; but that figure reflects a short holding period, so we would dismiss this for now.
Only The Cosmopolitan, a freehold development from the mid-2000s, has quietly kept pace with Rivergate (it’s actually 0.1 per cent ahead, but this is a negligible gap.) But here’s something to observe:
From 2005 to 2013, Cosmopolitan grew by about 71 per cent ($1,237 to $2,117) in eight years. But from 2013 to 2024, the growth was only 31.2 per cent over 11 years. This suggests a plateau effect after its initial popularity; possibly due to competition, age, or layout constraints.
More from Stacked
Will The 846-Unit Emerald Of Katong Be Priced Cheaper? Here’s All You Need To Know About This Upcoming New Condo
For everyone who thought District 15 was facing an oversupply of new launches (Grand Dunman, Tembusu Grand, and The Continuum),…
(From word on the ground, realtors have opined that this happens due to developer sales phases. It’s probable that the first batch of buyers for Cosmopolitan did very well, or got stronger discounts at purchase, but subsequent buyers failed to see equal benefits, hence the project’s appreciation flattening afterwards).
In contrast, Rivergate’s prices kept climbing post-2015, and even accelerated post-COVID. Its late-stage growth is stronger, so this still suggests better long-term prospects.
For other freehold comparisons, projects like The Trillium, Martin Place Residences, and Centennia Suites have annualised returns below three per cent, and also trailed behind Rivergate.
As before, let’s now filter it down to just resale prices, to eliminate developer pricing as a factor:
Year | Yong An Park | Mirage Tower | Roberson 100 | Watermark Robertson Quay | The Cosmopolitan | Rivergate | Tribeca by the Waterfront | The Trillium | Martin Place Residences | Centennia Suites |
2015 | $1,893 | $1,619 | $1,735 | $1,690 | $1,982 | $1,909 | $1,839 | $2,043 | $2,088 | $2,038 |
2016 | $1,658 | $1,484 | $1,770 | $1,623 | $1,852 | $1,942 | $1,775 | $1,848 | $1,973 | |
2017 | $1,607 | $1,687 | $1,702 | $1,759 | $1,977 | $2,033 | $1,787 | $1,843 | $2,053 | $2,156 |
2018 | $1,679 | $1,743 | $1,716 | $1,902 | $2,313 | $2,233 | $1,931 | $2,095 | $2,218 | $2,695 |
2019 | $1,839 | $1,753 | $1,872 | $1,931 | $2,308 | $2,206 | $2,018 | $2,047 | $2,244 | $2,489 |
2020 | $1,895 | $1,760 | $2,000 | $1,831 | $2,316 | $2,284 | $2,032 | $2,213 | $2,175 | $2,629 |
2021 | $1,956 | $2,097 | $1,931 | $1,956 | $2,364 | $2,477 | $2,159 | $2,325 | $2,364 | $2,444 |
2022 | $2,198 | $2,135 | $2,009 | $2,093 | $2,473 | $2,744 | $2,218 | $2,639 | $2,463 | $2,922 |
2023 | $2,238 | $2,187 | $2,264 | $2,264 | $2,591 | $2,807 | $2,489 | $2,661 | $2,551 | |
2024 | $2,393 | $2,268 | $2,177 | $2,279 | $2,778 | $2,843 | $2,493 | $2,570 | $2,599 | $2,846 |
Annualised | 2.64% | 3.82% | 2.55% | 3.38% | 3.82% | 4.52% | 3.44% | 2.58% | 2.46% | 3.78% |
Martin Modern, Riviere, The Avenir and Irwell Hill Residences are fairly new and do not have as much resale data; we will exclude them from this comparison, as their handful of transactions don’t make for meaningful data. Also, Centennia Suites only has resale transactions from 2015 onwards, so to be fair, we will look at the same time period for all the projects. Once we filter down to resale performance only, Rivergate becomes the undisputed leader in ROI. It leads with a 4.52 per cent annualised return over the past decade, higher than all nearby freehold competitors.
This is after stripping away the effects of developer discounts and launch-era hype; and we can see Rivergate’s supposedly “mediocre” ROI is actually concealing a high-performing project.
Next, let’s look at how units of specific sizes at Rivergate have fared
We will be looking and comparing among two, three, and four-bedders, as these are the unit sizes available for Rivergate.
2-bedroom units
Year | Mirage Tower | Roberson 100 | Watermark Robertson Quay | The Cosmopolitan | Rivergate | Tribeca by the Waterfront | The Trillium | Martin Place Residences |
2015 | $1,722 | $1,790 | $1,884 | $2,076 | $1,761 | $1,944 | ||
2016 | $1,668 | $1,887 | $2,122 | $1,758 | $1,815 | $1,958 | ||
2017 | $1,624 | $1,721 | $1,864 | $2,004 | $2,299 | $1,703 | $1,865 | $2,043 |
2018 | $1,781 | $1,991 | $2,238 | $2,413 | $2,053 | $2,260 | ||
2019 | $1,942 | $1,831 | $1,972 | $2,191 | $2,340 | $2,285 | ||
2020 | $1,974 | $2,270 | $2,418 | $2,120 | ||||
2021 | $1,887 | $2,041 | $2,384 | $2,530 | $2,120 | $2,269 | $2,356 | |
2022 | $1,998 | $2,092 | $2,465 | $2,710 | $2,181 | $2,390 | ||
2023 | $2,259 | $2,489 | $2,495 | |||||
2024 | $2,266 | $2,291 | – | $2,858 | $2,535 | $2,546 | $2,553 | |
Annualised | – | 3.10% | 2.78% | – | 3.62% | 4.13% | 3.04% | – |
3-bedroom units
Year | Yong An Park | Mirage Tower | Roberson 100 | Watermark Robertson Quay | The Cosmopolitan | Rivergate | Tribeca by the Waterfront | The Trillium |
2015 | $1,574 | $1,700 | $1,590 | $2,080 | $1,875 | $1,760 | $2,092 | |
2016 | $1,484 | $1,563 | $1,787 | $1,904 | $1,864 | |||
2017 | $1,620 | $1,638 | $1,619 | $1,993 | $1,972 | $1,716 | $1,817 | |
2018 | $1,639 | $1,743 | $1,586 | $1,752 | $2,476 | $2,129 | $1,890 | $2,124 |
2019 | $2,023 | $1,715 | $1,900 | $1,881 | $2,337 | $2,200 | $1,979 | $2,003 |
2020 | $2,138 | $1,624 | $1,935 | $1,688 | $2,408 | $2,247 | $2,032 | |
2021 | $1,785 | $1,955 | $1,964 | $1,865 | $2,351 | $2,389 | $2,224 | $2,212 |
2022 | $2,272 | $2,132 | $1,992 | $2,175 | $2,484 | $2,739 | $2,416 | $2,649 |
2023 | $2,350 | $2,192 | $2,271 | $2,264 | $2,795 | $2,691 | $2,400 | $2,661 |
2024 | $2,379 | $2,249 | $2,132 | $2,199 | $2,817 | $2,768 | $2,505 | $2,641 |
Annualised | – | 4.04% | 2.55% | 3.67% | 3.43% | 4.42% | 4.00% | 2.62% |
4-bedroom units
Year | Yong An Park | Watermark Robertson Quay | The Cosmopolitan | Rivergate | Tribeca by the Waterfront | The Trillium | Martin Place Residences | Centennia Suites |
2015 | $1,893 | $1,933 | $1,923 | $1,280 | $2,176 | $2,059 | $2,115 | |
2016 | $1,672 | $1,850 | $1,861 | $1,538 | $1,849 | $1,768 | $2,120 | |
2017 | $1,629 | $1,920 | $1,952 | $1,601 | $1,803 | $1,996 | ||
2018 | $1,700 | $2,337 | $2,183 | $1,916 | $2,255 | $2,653 | ||
2019 | $1,747 | $1,699 | $2,173 | $2,255 | $2,521 | |||
2020 | $1,509 | $2,179 | $2,213 | |||||
2021 | $1,976 | $2,399 | $2,567 | $1,664 | $2,255 | $2,418 | ||
2022 | $2,255 | $2,011 | $2,764 | $2,024 | $2,518 | $2,547 | $2,936 | |
2023 | $2,388 | $2,884 | $2,519 | |||||
2024 | $2,398 | $2,739 | $2,869 | $2,458 | $2,737 | |||
Annualised | 2.66% | – | 3.95% | 4.54% | – | 1.36% | 3.21% | – |
Now let’s look at the unit sizes and overall quantum, so we can draw some conclusions.
We’ll start with the two-bedders:
Average 2-bedroom prices
Year | Mirage Tower | Roberson 100 | Watermark Robertson Quay | The Cosmopolitan | Rivergate | Tribeca by the Waterfront | The Trillium | Martin Place Residences | Centennia Suites |
2015 | $1,520,000 | $1,669,600 | $2,380,000 | $2,190,000 | $1,820,000 | $2,719,333 | $2,525,000 | ||
2016 | $1,663,750 | $2,150,000 | $2,187,000 | $1,816,667 | $2,540,000 | $2,122,667 | |||
2017 | $1,555,000 | $1,571,385 | $1,721,250 | $2,152,475 | $2,397,000 | $1,760,000 | $2,610,714 | $2,179,000 | $2,867,750 |
2018 | $1,562,500 | $2,099,758 | $2,285,833 | $2,499,000 | $2,872,500 | $2,360,000 | |||
2019 | $1,860,000 | $1,606,500 | $2,046,125 | $2,554,000 | $2,460,000 | $2,386,000 | |||
2020 | $2,030,000 | $2,500,000 | $2,492,000 | $2,213,333 | |||||
2021 | $1,727,600 | $1,982,000 | $2,590,000 | $2,617,500 | $2,190,000 | $3,174,700 | $2,556,667 | $3,025,000 | |
2022 | $1,909,333 | $2,040,250 | $2,720,000 | $2,799,700 | $2,842,963 | $2,495,000 | $3,600,000 | ||
2023 | $1,969,629 | $2,813,333 | $2,900,000 | ||||||
2024 | $2,000,000 | $2,383,714 | $2,840,000 | $2,953,000 | $2,620,000 | $3,562,667 | $2,665,000 |
Average 2-bedroom sizes (for units sold between 2015 and 2024)

Project | Mirage Tower | Roberson 100 | Watermark Robertson Quay | The Cosmopolitan | Rivergate | Tribeca by the Waterfront | The Trillium | Martin Place Residences | Centennia Suites |
Average size | 958 | 898 | 996 | 1141 | 1039 | 1097 | 1399 | 1069 | 1238 |
Tribeca leads in PSF appreciation (4.13 per cent), the average size of its two-bedders at 1,097 sq. ft. and transacting at a typical quantum of around $2.62 million. Rivergate’s two-bedders averaged 1,039 sq. ft. That’s slightly smaller, but still offers more space than most other projects in the area still; and it’s not too far behind.
Now let’s look at the three-bedders
Average 3-bedroom prices
Year | Yong An Park | Mirage Tower | Roberson 100 | Watermark Robertson Quay | The Cosmopolitan | Rivergate | Tribeca by the Waterfront | The Trillium | Martin Place Residences | Centennia Suites |
2015 | $2,460,000 | $1,775,000 | $2,359,000 | $2,910,775 | $2,856,143 | $2,425,000 | $3,760,000 | $3,055,000 | ||
2016 | $2,390,000 | $2,486,667 | $2,500,000 | $2,926,500 | $3,350,000 | $3,025,555 | $3,580,880 | |||
2017 | $2,424,033 | $1,999,000 | $2,331,667 | $2,712,250 | $2,992,758 | $2,355,000 | $3,266,667 | $3,105,000 | ||
2018 | $6,000,000 | $2,516,667 | $2,100,000 | $2,503,333 | $3,374,000 | $3,241,378 | $3,336,667 | $3,816,925 | $3,148,333 | $4,800,000 |
2019 | $4,550,000 | $2,514,560 | $2,042,667 | $2,467,500 | $3,182,500 | $3,417,600 | $2,974,375 | $3,600,000 | $2,850,000 | $4,329,629 |
2020 | $4,275,000 | $2,370,000 | $2,000,000 | $2,838,900 | $3,188,000 | $3,497,225 | $2,799,000 | $3,010,000 | $4,725,000 | |
2021 | $5,500,000 | $2,582,933 | $2,222,600 | $2,915,889 | $3,201,250 | $3,678,000 | $3,040,000 | $3,975,000 | $4,025,000 | |
2022 | $4,233,333 | $2,716,667 | $2,265,000 | $2,880,000 | $3,475,000 | $4,220,833 | $3,315,000 | $4,762,667 | $3,815,000 | |
2023 | $4,250,000 | $3,280,000 | $2,494,444 | $2,900,000 | $3,700,000 | $4,225,000 | $3,612,667 | $4,783,333 | $3,638,333 | |
2024 | $4,200,000 | $3,365,000 | $2,710,000 | $3,480,000 | $3,730,000 | $4,275,000 | $3,925,000 | $4,746,296 | $4,780,000 | $5,085,000 |
Average 3-bedroom sizes (for units sold between 2015 and 2024)

Project | Yong An Park | Mirage Tower | Roberson 100 | Watermark Robertson Quay | The Cosmopolitan | Rivergate | Tribeca by the Waterfront | The Trillium | Martin Place Residences | Centennia Suites |
Average size | 2376 | 1463 | 1152 | 1475 | 1358 | 1541 | 1468 | 1798 | 1522 | 1777 |
Rivergate leads the pack for three-bedders (4.42 per cent), while staying in the mid-range for pricing. Based on recent transactions, Rivergate’s three-bedders tend to be around 1,541 sq. ft. on average, with typical prices in the $4.2 million range.
We can see, however, that the larger and more expensive unit sizes at condos like Trillium (1,798 sq. ft. at $4.746 million) delivered only 2.62 per cent; so it seems Rivergate again fell into the “sweet spot” – spacious enough to be desirable, but not unnecessarily huge and pushing the quantum too high.
Next, let’s look at the four-bedders
Average 4-bedroom prices
Year | Yong An Park | Watermark Robertson Quay | The Cosmopolitan | Rivergate | Tribeca by the Waterfront | The Trillium | Martin Place Residences | Centennia Suites |
2015 | $6,500,000 | $3,246,667 | $3,706,000 | $5,000,000 | $4,825,000 | $3,900,000 | $4,800,000 | |
2016 | $5,200,000 | $3,106,667 | $3,813,750 | $5,100,000 | $4,100,000 | $3,350,000 | $4,700,000 | |
2017 | $5,292,500 | $3,223,550 | $4,141,250 | $3,050,000 | $3,997,000 | $4,489,000 | ||
2018 | $8,025,000 | $3,924,000 | $4,077,000 | $3,650,000 | $5,000,000 | $10,680,000 | ||
2019 | $5,640,000 | $3,200,000 | $4,563,889 | $5,000,000 | $5,669,444 | |||
2020 | $10,100,000 | $4,087,500 | $4,906,250 | |||||
2021 | $6,495,000 | $4,028,000 | $5,228,000 | $6,500,000 | $5,000,000 | $4,580,000 | ||
2022 | $7,281,750 | $3,550,000 | $5,115,750 | $3,856,667 | $5,583,333 | $5,100,000 | $6,510,000 | |
2023 | $8,200,000 | $5,710,000 | $4,800,000 | |||||
2024 | $7,993,333 | $4,600,000 | $5,425,200 | $5,450,000 | $5,480,000 |
Average 4-bedroom sizes (for units sold between 2015 and 2024)

Project | Yong An Park | Watermark Robertson Quay | The Cosmopolitan | Rivergate | Tribeca by the Waterfront | The Trillium | Martin Place Residences | Centennia Suites |
Average size | 3799 | 1825 | 1679 | 1975 | 2679 | 2217 | 1938 | 2539 |
Rivergate’s four-bedroom segment doesn’t lead in terms of ROI, falling into the category of stable but slightly underperforming (in comparison to the others listed here). But it does offer a more reasonable price tag for a larger demographic of buyers; for example, Rivergate’s four-bedders are around 35 to 40 per cent less than developments like Yong An Park (which has an $8 million price that’s frankly unrealistic for most buyers).
Again, we can see good price stability and ongoing demand, just because it’s in a sweet spot for size, location, and overall quantum.
What if we compare based on just profitability?
Yong An Park
Profitable transactions | ||||
Average gains | Average purchase price | Average ROI | Average holding period (years) | No. of tnx |
$2,468,214 | $3,978,552 | 62.04% | 12.5 | 29 |
Mirage Tower
Profitable transactions | ||||
Average gains | Average purchase price | Average ROI | Average holding period (years) | No. of tnx |
$655,813 | $1,534,574 | 42.74% | 12.1 | 38 |
Roberson 100
Profitable transactions | Unprofitable transactions | ||||||||
Average gains | Average purchase price | Average ROI | Average holding period (years) | No. of tnx | Average losses | Average purchase price | Average ROI | Average holding period (years) | No. of tnx |
$668,756 | $1,228,144 | 54.45% | 12.5 | 62 | -$10,000 | $1,525,401 | -0.66% | 5.5 | 2 |
Watermark Robertson Quay
Profitable transactions | Unprofitable transactions | ||||||||
Average gains | Average purchase price | Average ROI | Average holding period (years) | No. of tnx | Average losses | Average purchase price | Average ROI | Average holding period (years) | No. of tnx |
$561,621 | $1,766,644 | 31.79% | 9.0 | 87 | -$207,627 | $2,692,512 | -7.71% | 5.8 | 3 |
The Cosmopolitan
Profitable transactions | Unprofitable transactions | ||||||||
Average gains | Average purchase price | Average ROI | Average holding period (years) | No. of tnx | Average losses | Average purchase price | Average ROI | Average holding period (years) | No. of tnx |
$810,882 | $2,217,078 | 36.57% | 10.1 | 61 | -$119,059 | $2,745,207 | -4.34% | 5.8 | 8 |
Rivergate
Profitable transactions | Unprofitable transactions | ||||||||
Average gains | Average purchase price | Average ROI | Average holding period (years) | No. of tnx | Average losses | Average purchase price | Average ROI | Average holding period (years) | No. of tnx |
$1,041,807 | $2,558,969 | 40.71% | 10.5 | 152 | -$392,468 | $4,233,097 | -9.27% | 5.9 | 15 |
Tribeca by the Waterfront
Profitable transactions | Unprofitable transactions | ||||||||
Average gains | Average purchase price | Average ROI | Average holding period (years) | No. of tnx | Average losses | Average purchase price | Average ROI | Average holding period (years) | No. of tnx |
$571,737 | $2,102,240 | 27.20% | 10.3 | 61 | -$215,711 | $3,143,093 | -6.86% | 6.0 | 8 |
The Trillium
Profitable transactions | Unprofitable transactions | ||||||||
Average gains | Average purchase price | Average ROI | Average holding period (years) | No. of tnx | Average losses | Average purchase price | Average ROI | Average holding period (years) | No. of tnx |
$773,762 | $3,495,868 | 22.13% | 10.0 | 61 | -$489,672 | $4,454,450 | -10.99% | 6.8 | 11 |
Martin Place Residences
Profitable transactions | Unprofitable transactions | ||||||||
Average gains | Average purchase price | Average ROI | Average holding period (years) | No. of tnx | Average losses | Average purchase price | Average ROI | Average holding period (years) | No. of tnx |
$701,641 | $2,061,057 | 34.04% | 8.9 | 81 | -$151,483 | $2,595,149 | -5.84% | 4.9 | 9 |
Centennia Suites
Profitable transactions | Unprofitable transactions | ||||||||
Average gains | Average purchase price | Average ROI | Average holding period (years) | No. of tnx | Average losses | Average purchase price | Average ROI | Average holding period (years) | No. of tnx |
$854,794 | $3,771,056 | 22.67% | 8.4 | 21 | -$83,755 | $3,946,663 | -2.12% | 6.3 | 4 |
In terms of sheer profitability, Rivergate is somewhere in the middle of the pack (fourth out of ninth place) at 40.7 per cent returns. Rivergate comes in second if you go by absolute returns though, at an average of $1.04 million. We’d also note that Rivergate had the highest number of profitable transactions (152 in total).
Rivergate’s record of 152 profitable transactions (versus only 15 losing sales) is still the highest number of profitable sales in this area, from 2015 to 2024.
While Yong An Park and Mirage Tower have an apparently perfect track record of 100 per cent profitable sales, they had only 29 and 38 transactions respectively; the lower volumes mean more volatile results, so there’s a risk these are more influenced by outlier transactions.
Overall, Rivergate has a level of consistency that makes it excellent for risk-sensitive investors; something not clearly shown by pure ROI.
Next, let’s compare Rivergate to other launches that came up in the same year
If there are any conditions specific to its year of launch leading up to 2024, this will also help to reveal them:
Let’s also look at how some of the projects that were launched in the same year as Rivergate have performed
Project | Citylights | Domain 21 | Rivergate | The Calrose | 8 @ Mount Sophia |
Tenure | 99-year | 99-year | Freehold | Freehold | 103-year |
District | 8 | 3 | 9 | 26 | 9 |
No. of units | 600 | 141 | 545 | 421 | 313 |
Completion year | 2007 | 2007 | 2009 | 2007 | 2007 |

Year | Citylights | Domain 21 | Rivergate | The Calrose | 8 @ Mount Sophia | All non-landed properties |
2005 | $641 | $665 | $1,102 | $567 | $754 | $629 |
2006 | $665 | $731 | $1,338 | $552 | $841 | $744 |
2007 | $886 | $979 | $1,660 | $719 | $1,200 | $1,033 |
2008 | $1,136 | $1,127 | $1,512 | $741 | $1,364 | $897 |
2009 | $1,137 | $1,081 | $1,465 | $730 | $1,212 | $908 |
2010 | $1,341 | $1,266 | $1,902 | $836 | $1,414 | $1,130 |
2011 | $1,498 | $1,358 | $2,042 | $994 | $1,478 | $1,146 |
2012 | $1,601 | $1,399 | $2,063 | $1,122 | $1,479 | $1,159 |
2013 | $1,628 | $1,558 | $2,085 | $1,206 | $1,625 | $1,263 |
2014 | $1,535 | $1,418 | $2,059 | $1,156 | $1,669 | $1,288 |
2015 | $1,525 | $1,431 | $1,909 | $1,098 | $1,558 | $1,188 |
2016 | $1,490 | $1,559 | $1,942 | $1,066 | $1,305 | $1,230 |
2017 | $1,483 | $1,471 | $2,033 | $1,131 | $1,417 | $1,301 |
2018 | $1,557 | $1,480 | $2,233 | $1,271 | $1,492 | $1,441 |
2019 | $1,527 | $1,468 | $2,206 | $1,194 | $1,342 | $1,557 |
2020 | $1,532 | $1,513 | $2,284 | $1,250 | $1,435 | $1,520 |
2021 | $1,559 | $1,492 | $2,477 | $1,317 | $1,517 | $1,597 |
2022 | $1,717 | $1,651 | $2,744 | $1,527 | $1,501 | $1,702 |
2023 | $1,785 | $1,806 | $2,807 | $1,659 | $1,565 | $1,849 |
2024 | $1,879 | $1,948 | $2,843 | $1,756 | $1,608 | $1,839 |
Annualised | 5.82% | 5.82% | 5.11% | 6.13% | 4.07% | 5.81% |
From 2005 to 2024, Rivergate maintained an upward price trend, with its annualised growth of 5.11 per cent being slightly below the non-landed market average of 5.81 per cent.
It is, however, among the most consistent performers. We can see that Rivergate managed to see price growth between 2014 and 2017, when Citylights, Domain 21, The Calrose, and 8 @ Mount Sophia saw price dips:
Citylights | Domain 21 | Rivergate | The Calrose | 8 @ Mount Sophia | |
2014 | $1,535 | $1,418 | $2,059 | $1,156 | $1,669 |
2015 | $1,525 | $1,431 | $1,909 | $1,098 | $1,558 |
2016 | $1,490 | $1,559 | $1,942 | $1,066 | $1,305 |
2017 | $1,483 | $1,471 | $2,033 | $1,131 | $1,417 |
These years were down periods for the wider property market, as they followed a slew of cooling measures after the 2013 peak. So even though Rivergate may not head the pack, it shows the greatest resilience and consistency among condos launched in the same era.
Now let’s look at Rivergate’s floor plans, compared to the closest equivalents in nearby condos
We’ll start with the two-bedders:


Both Rivergate and Martin Place offer two-bedroom, two-bathroom units of various sizes, all above 1,000 sq. ft..
Martin Place is slightly less squarish, which is a minor drawback; but it does allow for a landscape-layout where the living and dining areas are side-by-side. This provides a greater sense of spaciousness, and may even forgive the rather wasteful and large balcony for some homebuyers.
At Rivergate, the living and dining areas are arranged in a stacked configuration, resulting in a more compact balcony that extends only across the living room.
Rivergate’s unit also includes a home shelter located in the kitchen – useful for storage – while Martin Place Residences does not have this feature. Both projects, sadly, come with wasteful bay windows and planter boxes. We give a slight edge to Rivergate because the planter boxes still allow for full-height sliding doors in the common bedroom, which is better for ventilation.
There isn’t a clear winner here in terms of layout alone, as a lot of this will come down to subjective preference.
Now let’s look at the three-bedders


The units have the same square footage, but Rivergate is configured to be a straight three-bedder, whilst Watermark aims at being a 3 + Study.
Both units, unfortunately, have balconies, but Watermark may have the edge here. Watermark has a single, elongated balcony that runs from the living area to the master bedroom; this is generally better for practicality and the view, compared to Rivergat,e which has two small separate balconies (one in the living area and one in the master bedroom).
Watermark also includes a study next to the master bedroom, which could be converted into a walk-in wardrobe or used as a flexible space. This has the downside of making the unit feel smaller than its Rivergate counterpart, but we think it’s an edge for Watermark; most homebuyers today appreciate having another room.
Watermark’s kitchen also has a utility room and a private lift (although we know some buyers consider private lifts an unnecessary contribution to maintenance fees).
Again, though, it’s hard to find a very clear winner here.
Finally, let’s look at the four-bedders


This one falls more clearly in favour of Rivergate. First, all of Rivergate’s bedrooms are able to accommodate queen-size beds, whereas one of the rooms at Martin Place Residences is smaller and may struggle with something bigger than a single.
Second, Rivergate has bay windows and planter boxes in just two of the bedrooms. Martin Place has bay windows in all of the bedrooms and even the two bathrooms, which is just less efficient. Martin Place does use Jack-and-Jill bathroom doors, though, which is generally considered more functional, but not everyone loves this feature.
The kitchen in Martin Place is also placed closer to the bedrooms, which some homebuyers dislike.
Other than this, the most differentiating factor will be the private lift for Martin Place, which again is not considered a boon by every homebuyer. So overall, we’d give the win to Rivergate for four-bedders.
Overall conclusion:
Rivergate’s ROI disguises its strength as an investment. Over nearly two decades, its prices have shown a continued upward trend; and what’s significant isn’t so much the ROI of 5.11 per cent, but the fact that it continued to climb even during property downturns.
This is true even looking at resale transactions from 2015 to 2024, where Rivergate stands out as the best-performing project in its immediate neighbourhood. This reflects on strong fundamental demand; this is particularly evident in the three and four-bedder segments, where Rivergate posted the highest growth rates. It only trailed Tribeca in the two-bedder categories, but this may not matter given that families buying resale units will probably focus on the larger units anyway.
This shows that Rivergate remains a reliable long-term investment, especially for buyers who hold their units over a full market cycle; and there’s definitely room for growth, given its unit sizes are the right balance between quantum and spaciousness for the 2025 buyer market.
So while many buyers are focused on headline ROI figures, we hope we’ve shed light on why Rivergate’s performance goes deeper than that. It’s not just about a 5.11% annualised return, it’s about long-term resilience, family-sized layouts that still make sense in today’s market, and a track record of growth even during downturns.
And right now, Rivergate stands out as one of the few large-unit condos in Robertson Quay with both consistent upside and strong buyer appeal.
Curious how these principles apply to your own investment or upgrading journey? Let’s chat, we’re happy to share what we’re seeing in this segment, and how it compares to other resale options in District 9.
Next up, we’ll be looking at Forest Woods and Kingsford Hillview, to further reveal how to read ROI in proper context; so join us on Stacked Pro for the case studies.
Ryan J
A seasoned content strategist with over 17 years in the real estate and financial journalism sectors, Ryan has built a reputation for transforming complex industry jargon into accessible knowledge. With a track record of writing and editing for leading financial platforms and publications, Ryan's expertise has been recognised across various media outlets. His role as a former content editor for 99.co and a co-host for CNA 938's Open House programme underscores his commitment to providing valuable insights into the property market.Read next from Property Investment Insights

Property Investment Insights Why Kingsford Hillview Peak Underperformed—Despite Its MRT Location And “Good” Entry Price

Property Investment Insights Singapore Property Data Is Transparent: But Here’s Why It Can Still Mislead You

Property Investment Insights Why Marina Bay Suites May Look Like a Poor Performer—But Its 4-Bedroom Units Tell a Different Story

Property Investment Insights Why This 40-Year-Old Leasehold Condo Beat Newer Developments: A Case Study Of Loyang Valley
Latest Posts

On The Market Springleaf Vs Faber Walk: Which Future GLS Residential Site Has More Potential?

Property Market Commentary I Reviewed HDB’s 2 And 3-Room Show Flats: Ideal For First-Time Buyers Or Too Small To Live In?

Editor's Pick Buying Property In Malaysia As A Singaporean: 6 Key Restrictions To Be Aware Of

Editor's Pick Why Punggol Northshore Could Be The Next Hotspot In The HDB Resale Market

Singapore Property News 9,800 New Homes Across 11 GLS Sites In 2H 2025: What To Know About Tanjong Rhu, Dover, And Bedok

Singapore Property News Why HDB Needs To Build More 4 Bedroom Flats

Homeowner Stories “If We Sell, We’ll Never Have A Home This Big Again”: What Singaporean Parents Do After The Kids Move Out

Property Advice How Much Is Your Home Really Worth? How Property Valuations Work in Singapore

On The Market 5 Cheapest Convenient 1-Bedders Near Integrated Developments From $800k

Property Advice Why I Had Second Thoughts After Buying My Dream Home In Singapore

Editor's Pick 50 New Launch Condos With Balance Units Remaining In 2025 (From $1,440 PSF)

Singapore Property News This West-Side GLS Plot Just Got A $608M Bid And 6 Bidders: Why Lakeside Drive Bucked The Trend

Editor's Pick Touring A Rare Stretch of Original 2-Storey Freehold Terrace Homes At Joo Chiat Place From $3.02m

Singapore Property News The 1KM Primary School Rule In Singapore: Fair Game Or Property Power Play?

Singapore Property News 1,765 Punggol Northshore HDB Flats Reaching MOP: Should You Sell Quickly or Wait?
