


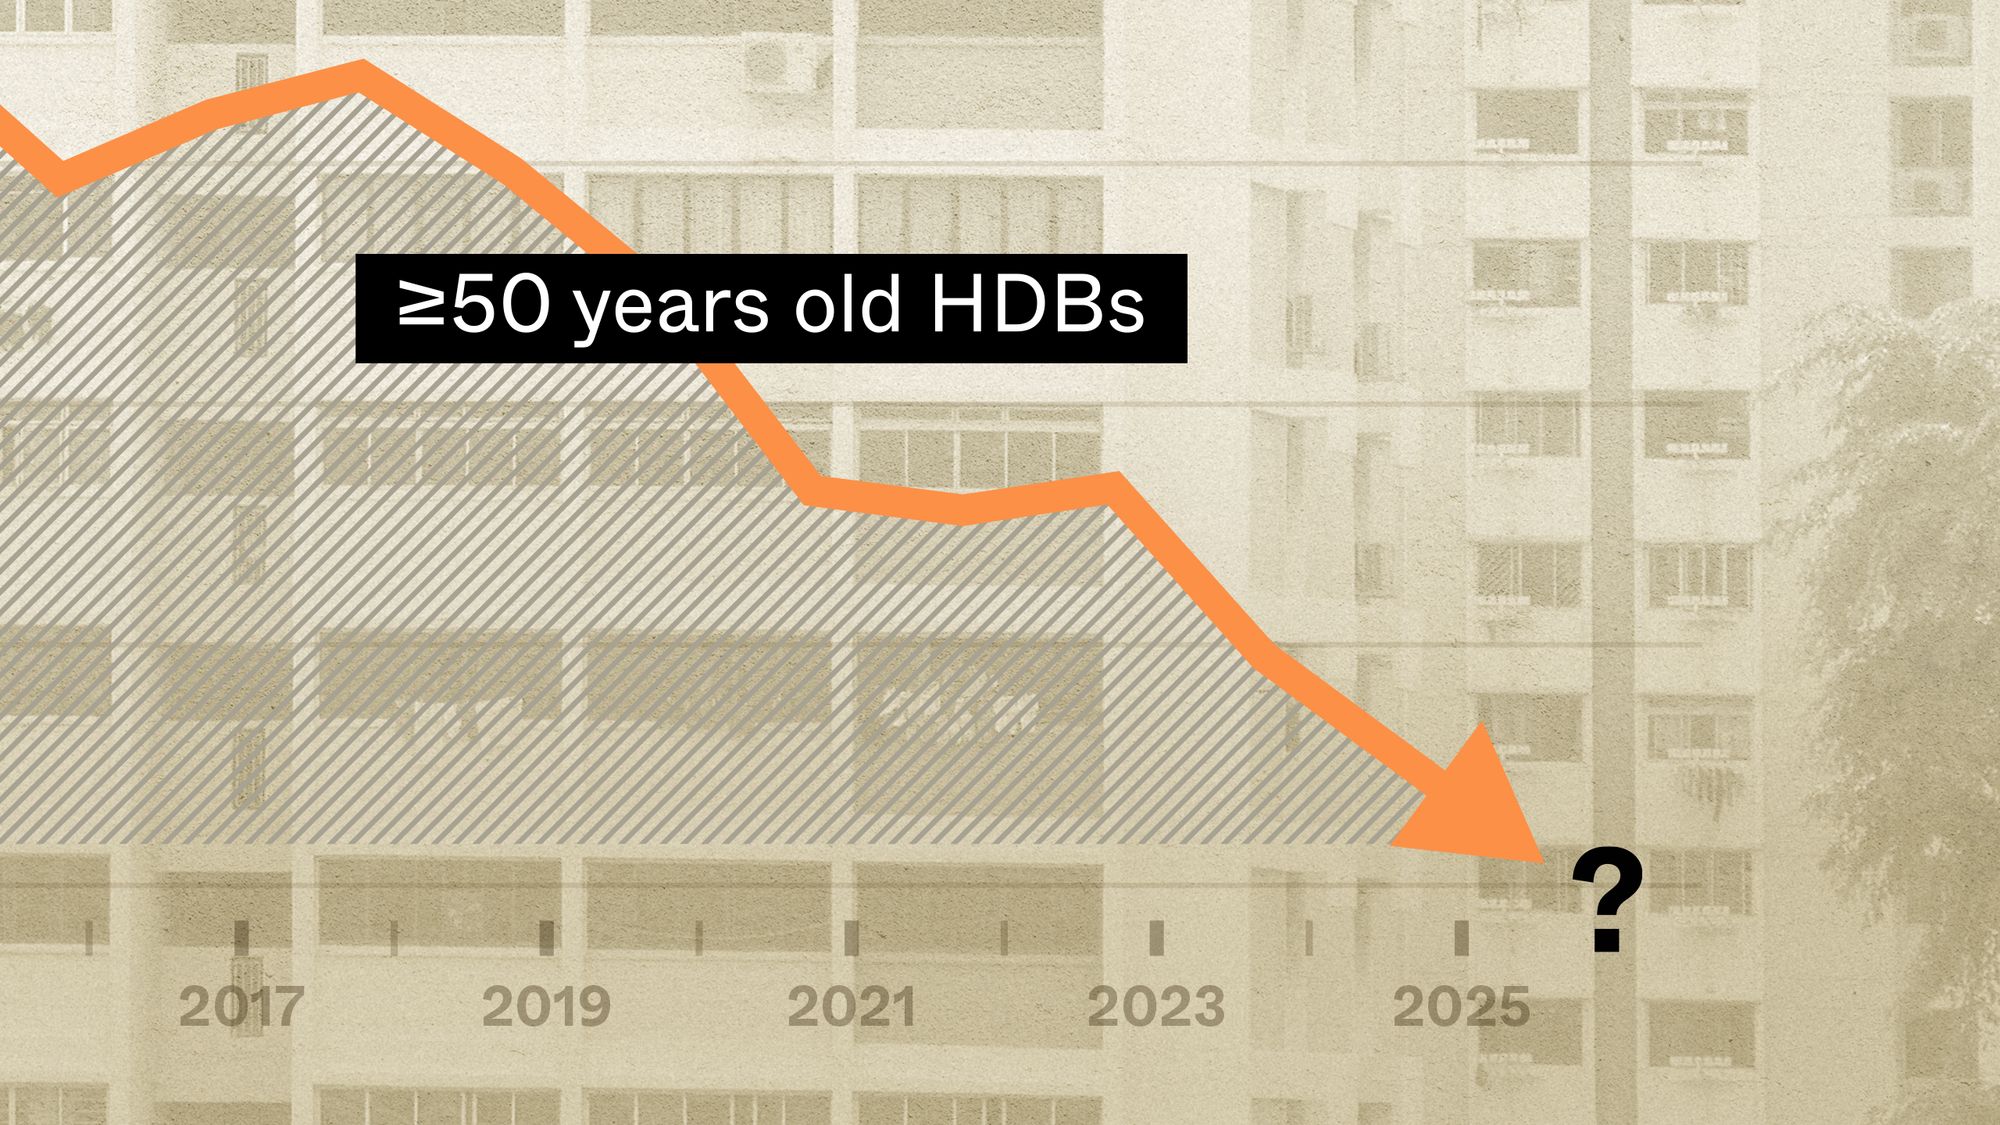
A long time ago, in 2018, there was a contentious moment when the government pointed out that even 50-year-old flats could still appreciate. But it’s now been about seven years, and the environment has changed: we’ve seen the last of the SERS exercise, VERS looms on the horizon, and of course, the old HDB flats aren’t getting any younger. In light of that, have any flats actually started to plateau or dip into negative values? And if not yet, then how soon? It’s high time for an update, which is why we’ve dug around to see how the prices of the oldest flats are moving – and if any of them really show signs of an eventual decline to zero:
So many readers write in because they're unsure what to do next, and don't know who to trust.
If this sounds familiar, we offer structured 1-to-1 consultations where we walk through your finances, goals, and market options objectively.
No obligation. Just clarity.
Learn more here.
How we’ll examine the data for our older flats
To keep things simple, we focused only on flats that have already surpassed the 50-year mark. That means the oldest stock currently available – which is generally flats built in the late 1960s and 1970s. This means that some HDB towns, such as those without any flats this old, won’t appear below.
For this analysis, we tracked resale prices of 3-room, 4-room, and 5-room units from 2014 to mid-2025.
First, let’s look at the general performance of flats that are younger and older than 50 years:
We’ll use 50 years as the point at which they become “old”, as this is about halfway through their 99-year lease. In addition, this is conventionally considered “old” in the market (e.g., flats in areas like Queenstown or Tiong Bahru reach this age, and most Singaporeans regard these as “older flats.”)
To ensure more accurate reporting of older flat prices, we focused on flats built in 1975 or earlier. These would have been about 40 years old in 2014 and around 50 years old today. This approach gives us a clearer view of how ageing flats appreciate over time, without the distortion of “younger” units in the mix. For comparison, we used flats built from 1976 onwards. While this does include some flats that entered the market after 2014, excluding them only lowered the overall appreciation slightly—by about 5% in total.
| Year | HDBs currently 50 years old and above | HDBs currently less than 50 years old |
| 2014 | $368,418 | $449,353 |
| 2015 | $358,247 | $440,358 |
| 2016 | $353,598 | $444,553 |
| 2017 | $343,620 | $450,635 |
| 2018 | $332,029 | $448,200 |
| 2019 | $316,011 | $439,307 |
| 2020 | $316,056 | $459,919 |
| 2021 | $360,258 | $520,225 |
| 2022 | $382,146 | $559,435 |
| 2023 | $389,353 | $581,537 |
| 2024 | $415,149 | $623,420 |
| 2025 (up till June) | $430,307 | $660,748 |
| % increase from 2014 to June 2025 | 16.80% | 47.04% |
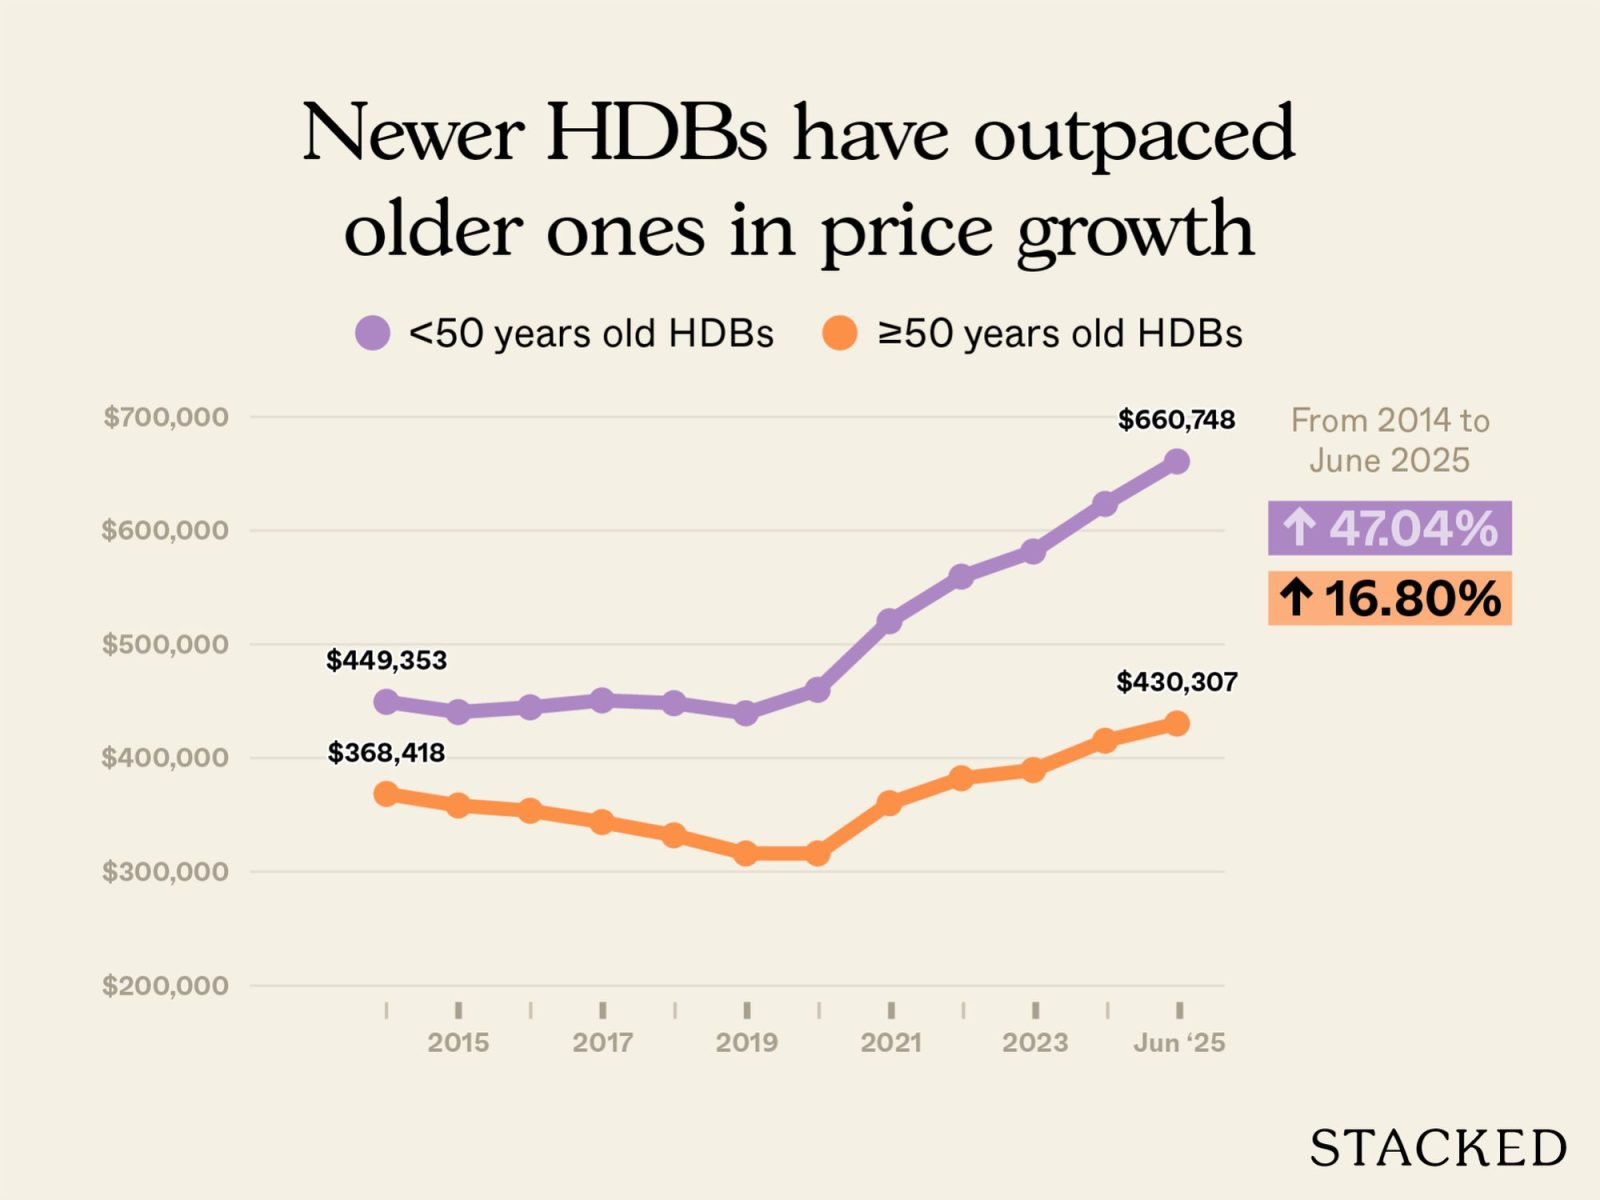
We see here that, while both groups appreciated, the gap is stark: flats above 50 years old rose by just 16.8 per cent, compared to 47 per cent for those below 50. This confirms that older flats are still rising in price, and may have a very high overall price or quantum compared to newer ones. But they are appreciating very slowly compared to their younger counterparts.
Now let’s break it down by flat sizes:
3-room flats
| Year | HDBs currently 50 years old and above | HDBs currently less than 50 years old |
| 2014 | $347,562 | $339,303 |
| 2015 | $334,980 | $322,317 |
| 2016 | $323,004 | $322,351 |
| 2017 | $312,844 | $319,074 |
| 2018 | $297,971 | $308,551 |
| 2019 | $285,159 | $302,646 |
| 2020 | $284,448 | $318,733 |
| 2021 | $320,099 | $360,793 |
| 2022 | $343,319 | $398,822 |
| 2023 | $358,832 | $422,000 |
| 2024 | $385,649 | $450,759 |
| 2025 (up till June) | $396,090 | $485,324 |
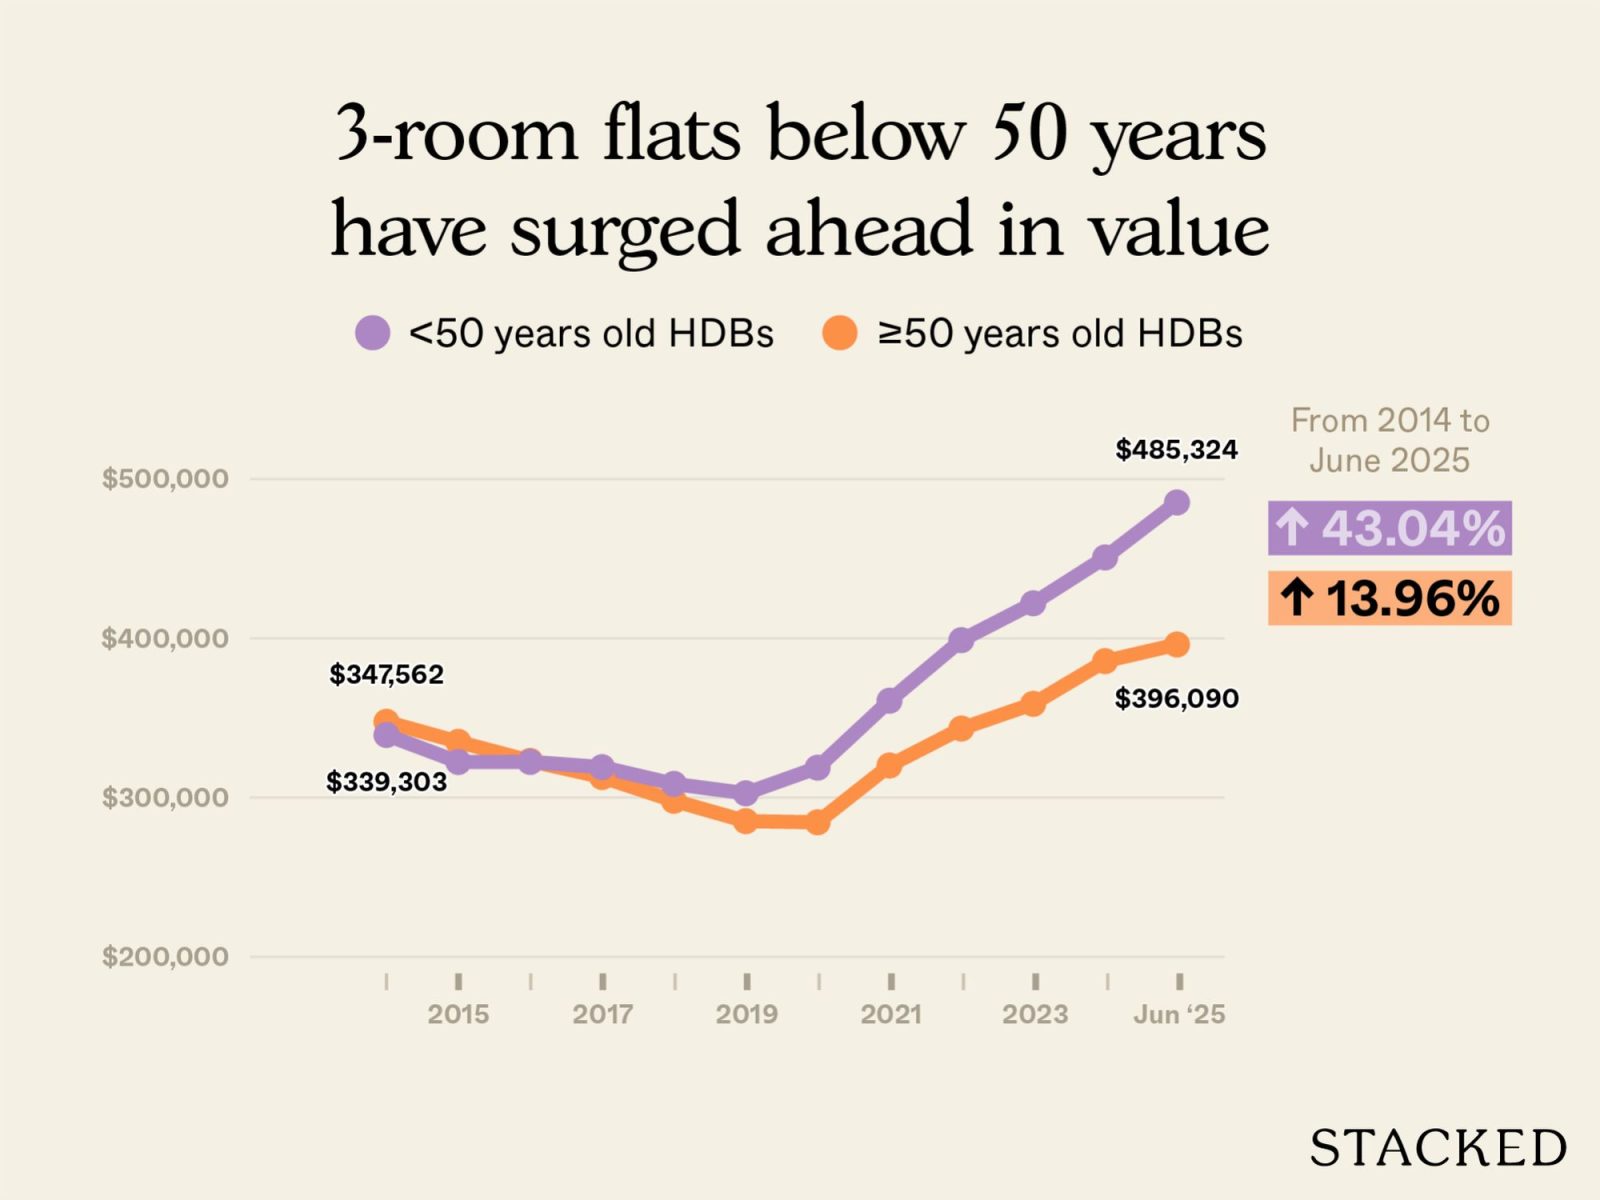
| % increase from 2014 to June 2025 | 13.96% | 43.04% |
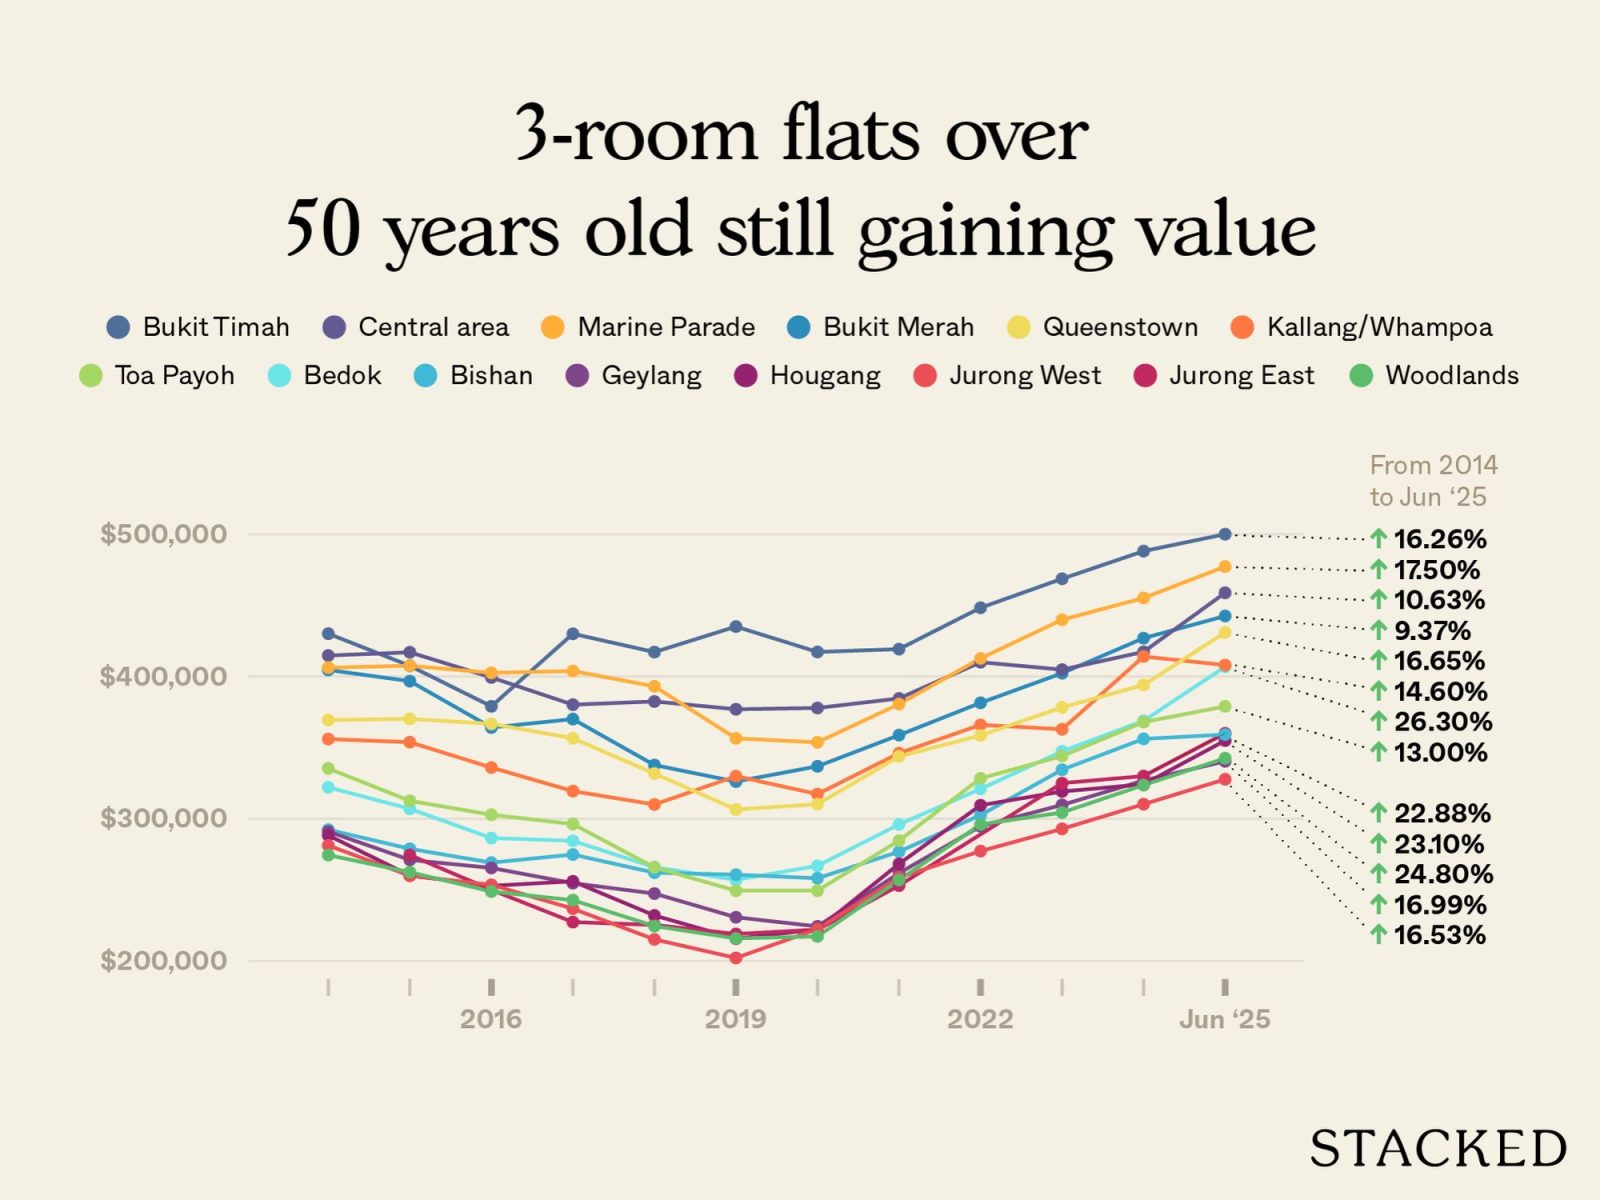
3-room flats currently above 50 years old in the various towns
| Year | BEDOK | BISHAN | BUKIT MERAH | BUKIT TIMAH | CENTRAL AREA | GEYLANG | HOUGANG | JURONG EAST | JURONG WEST | KALLANG/WHAMPOA | MARINE PARADE | QUEENSTOWN | TOA PAYOH | WOODLANDS |
| 2014 | $322,095 | $292,273 | $404,574 | $430,071 | $414,719 | $290,951 | $288,321 | $281,225 | $355,993 | $406,175 | $369,369 | $335,355 | $274,467 | |
| 2015 | $307,000 | $278,875 | $396,731 | $407,500 | $417,000 | $271,072 | $260,067 | $274,500 | $259,931 | $353,798 | $407,541 | $370,177 | $312,570 | $262,409 |
| 2016 | $286,435 | $269,126 | $364,129 | $379,000 | $399,299 | $265,405 | $252,838 | $250,000 | $253,550 | $335,963 | $402,551 | $366,712 | $302,803 | $248,838 |
| 2017 | $284,460 | $274,833 | $370,018 | $430,000 | $380,170 | $254,697 | $256,000 | $227,333 | $236,769 | $319,411 | $403,840 | $356,547 | $296,234 | $242,750 |
| 2018 | $265,895 | $262,056 | $337,727 | $417,143 | $382,423 | $247,391 | $232,000 | $225,333 | $215,170 | $309,993 | $393,055 | $331,769 | $265,780 | $224,526 |
| 2019 | $257,020 | $260,667 | $326,112 | $435,071 | $376,957 | $230,730 | $215,667 | $219,000 | $202,134 | $329,942 | $356,487 | $306,495 | $249,405 | $215,876 |
| 2020 | $266,875 | $258,156 | $336,837 | $417,222 | $377,838 | $224,295 | $222,236 | $222,000 | $222,450 | $317,295 | $353,689 | $310,168 | $249,440 | $217,250 |
| 2021 | $296,000 | $276,861 | $358,764 | $419,222 | $384,551 | $261,733 | $268,286 | $253,000 | $258,746 | $346,063 | $380,577 | $343,776 | $284,618 | $256,889 |
| 2022 | $320,954 | $302,579 | $381,478 | $448,286 | $410,000 | $294,697 | $309,464 | $277,235 | $365,981 | $412,677 | $358,563 | $328,395 | $296,000 | |
| 2023 | $347,375 | $334,455 | $402,297 | $468,667 | $404,800 | $309,694 | $319,148 | $325,000 | $292,858 | $362,885 | $439,862 | $378,269 | $344,082 | $304,375 |
| 2024 | $368,828 | $356,141 | $426,912 | $488,111 | $417,294 | $326,821 | $324,167 | $330,000 | $310,201 | $414,054 | $455,177 | $394,025 | $367,953 | $323,625 |
| 2025 (up till June) | $406,800 | $359,155 | $442,499 | $500,000 | $458,818 | $340,387 | $354,924 | $360,000 | $327,717 | $407,982 | $477,247 | $430,872 | $378,953 | $342,523 |
| % increase from 2014 to June 2025 | 26.30% | 22.88% | 9.37% | 16.26% | 10.63% | 16.99% | 23.10% | 16.53% | 14.60% | 17.50% | 16.65% | 13.00% | 24.80% |
3-room flats currently below 50 years old in the various towns (we will only include those with flats that are 50 years and above for comparison)
| Row Labels | BEDOK | BISHAN | BUKIT MERAH | BUKIT TIMAH | CENTRAL AREA | GEYLANG | HOUGANG | JURONG EAST | JURONG WEST | KALLANG/WHAMPOA | MARINE PARADE | QUEENSTOWN | TOA PAYOH | WOODLANDS |
| 2014 | $334,649 | $384,676 | $395,746 | $422,333 | $448,534 | $353,081 | $329,456 | $321,240 | $316,946 | $373,500 | $420,727 | $428,536 | $345,889 | $300,745 |
| 2015 | $312,639 | $391,579 | $395,607 | $397,600 | $440,883 | $340,909 | $306,680 | $309,192 | $295,096 | $370,575 | $433,083 | $404,009 | $340,374 | $275,814 |
| 2016 | $309,721 | $380,568 | $400,296 | $403,333 | $445,086 | $333,408 | $297,134 | $303,880 | $288,842 | $396,308 | $414,778 | $423,319 | $336,959 | $274,741 |
| 2017 | $308,084 | $388,176 | $424,104 | $403,125 | $432,884 | $337,143 | $294,377 | $293,843 | $279,861 | $356,801 | $409,053 | $439,630 | $369,515 | $268,713 |
| 2018 | $297,547 | $384,714 | $404,835 | $443,750 | $419,517 | $328,751 | $284,205 | $287,219 | $265,375 | $362,682 | $404,528 | $448,947 | $361,779 | $270,687 |
| 2019 | $285,368 | $387,189 | $392,833 | $379,000 | $426,421 | $321,205 | $285,754 | $273,413 | $261,435 | $367,224 | $384,217 | $459,057 | $329,686 | $259,538 |
| 2020 | $290,240 | $376,115 | $411,920 | $376,333 | $414,367 | $328,638 | $305,147 | $287,889 | $285,740 | $357,681 | $386,589 | $479,344 | $330,698 | $268,700 |
| 2021 | $329,443 | $407,695 | $440,177 | $401,000 | $447,578 | $380,945 | $344,834 | $336,034 | $326,821 | $421,771 | $423,268 | $509,173 | $382,414 | $316,197 |
| 2022 | $360,232 | $447,621 | $473,548 | $412,333 | $459,450 | $399,191 | $381,863 | $358,981 | $360,073 | $488,084 | $422,096 | $547,792 | $487,668 | $363,669 |
| 2023 | $382,191 | $482,337 | $549,585 | $459,084 | $478,914 | $423,380 | $404,057 | $373,736 | $369,288 | $485,848 | $460,821 | $555,721 | $519,046 | $383,534 |
| 2024 | $406,391 | $516,042 | $548,480 | $480,000 | $512,719 | $510,405 | $434,396 | $399,423 | $390,591 | $532,741 | $453,684 | $546,820 | $562,457 | $414,308 |
| 2025 (up till June) | $454,966 | $547,311 | $584,720 | $553,925 | $544,580 | $523,708 | $455,038 | $414,522 | $406,584 | $579,269 | $490,909 | $650,626 | $646,350 | $443,726 |
| % increase from 2014 to June 2025 | 35.95% | 42.28% | 47.75% | 31.16% | 21.41% | 48.33% | 38.12% | 29.04% | 28.28% | 55.09% | 16.68% | 51.83% | 86.87% | 47.54% |
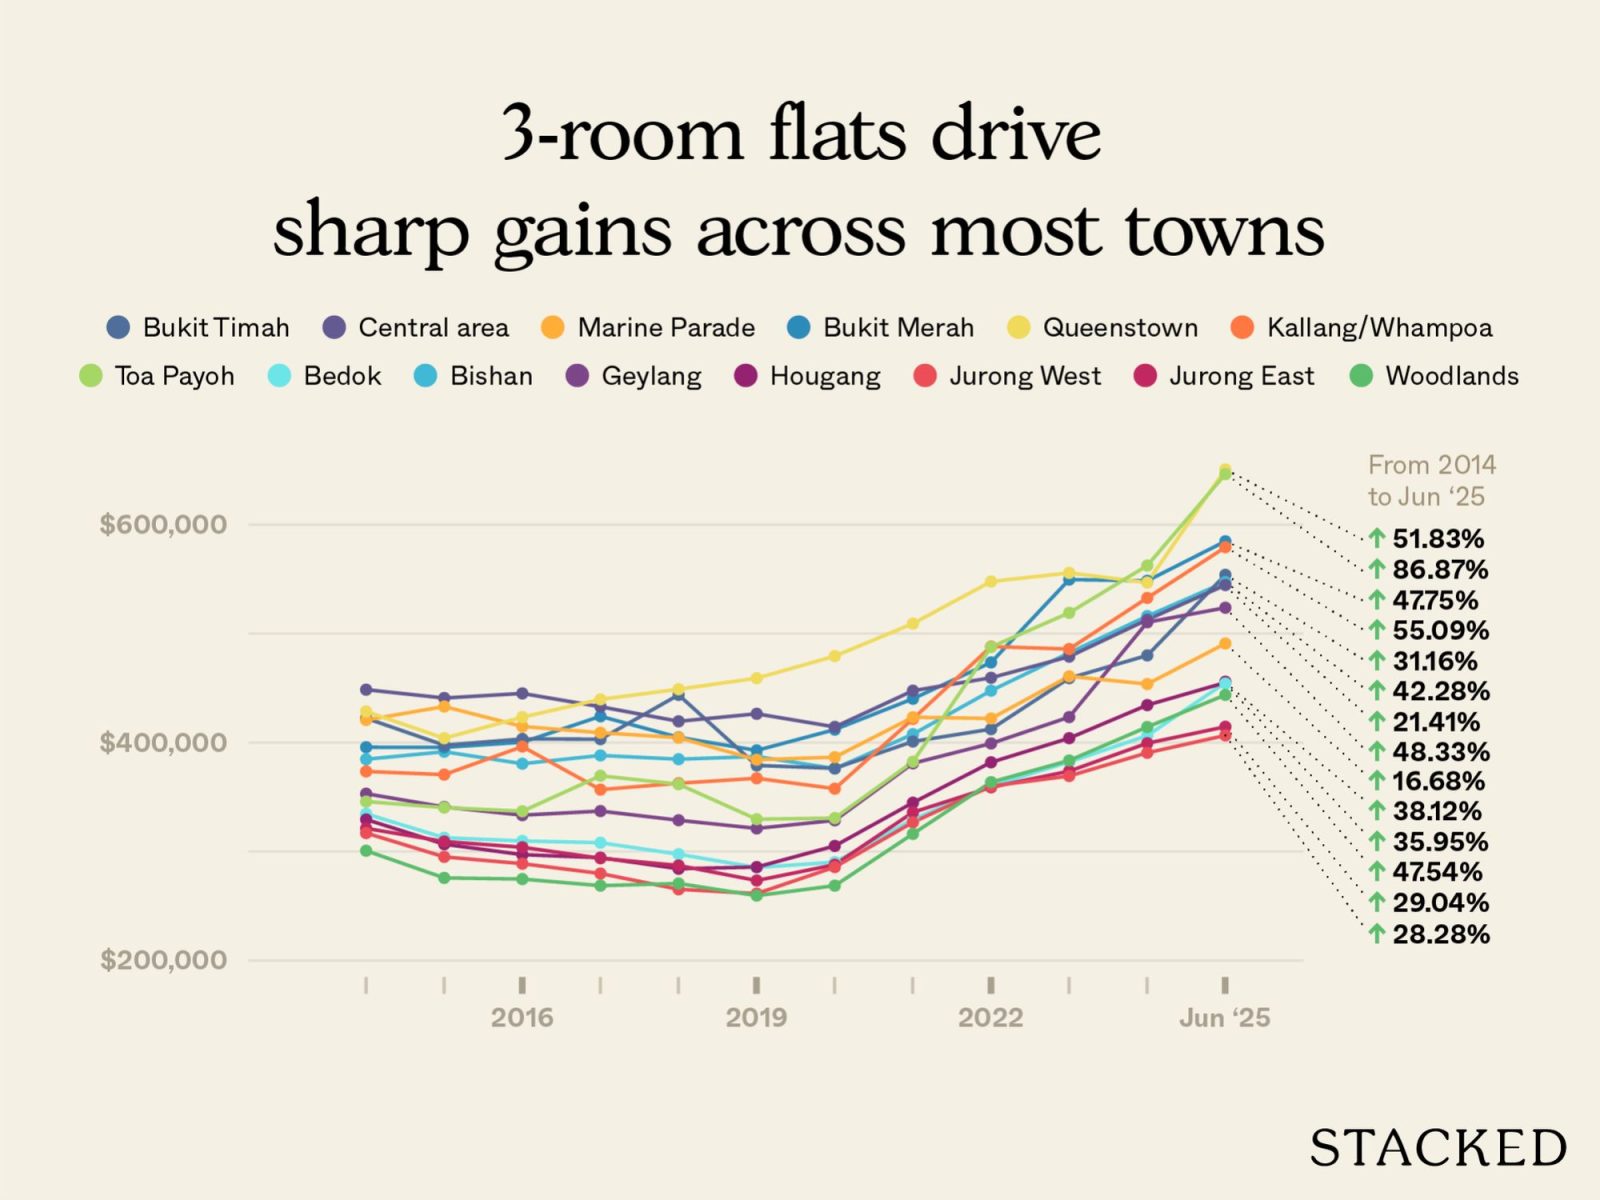
In every other estate besides Marine Parade, we saw younger three-roomers outperform their older counterparts. This is because there haven’t been any new flats at Marine Parade for a very long time (unless you want to count the upcoming Bayshore district.) This provided ongoing price support for the flats there, even as they aged.
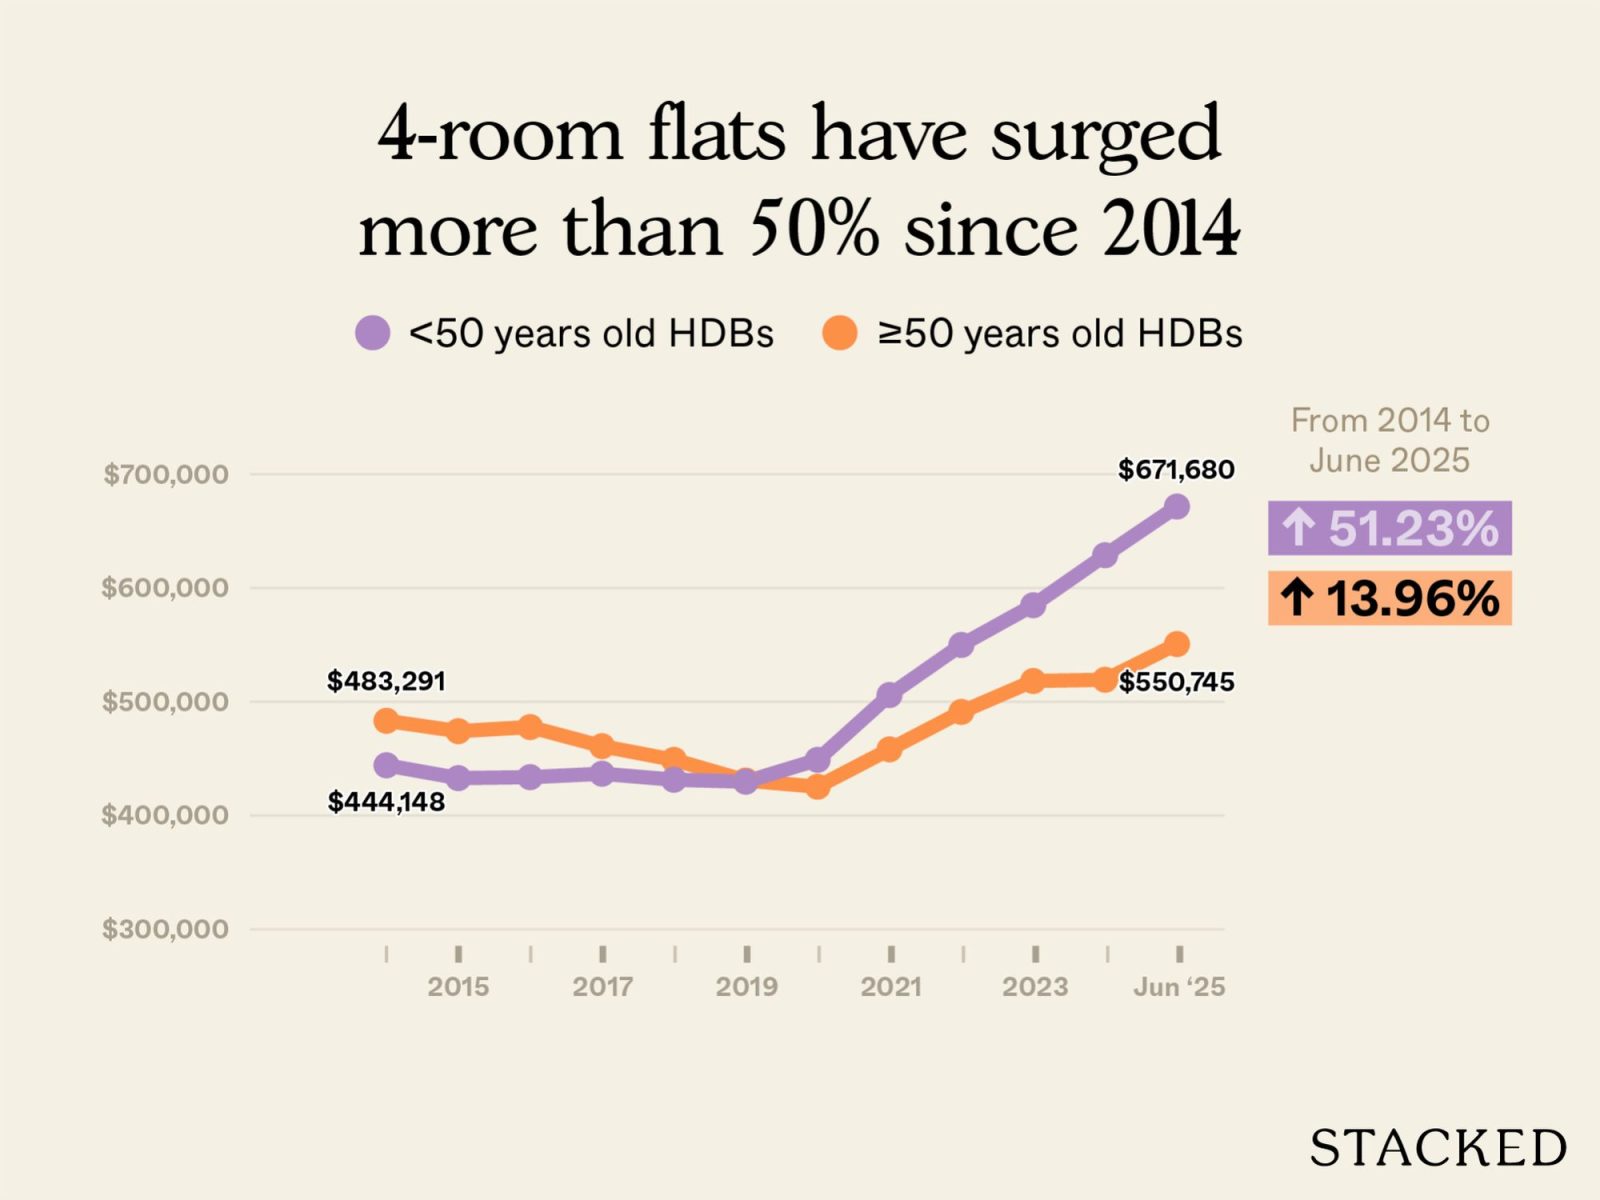
4-room flats
| Year | HDBs currently 50 years old and above | HDBs currently less than 50 years old |
| 2014 | $483,291 | $444,148 |
| 2015 | $474,162 | $432,858 |
| 2016 | $477,796 | $433,712 |
| 2017 | $460,986 | $436,714 |
| 2018 | $448,952 | $431,478 |
| 2019 | $430,756 | $429,733 |
| 2020 | $425,312 | $448,959 |
| 2021 | $458,162 | $505,915 |
| 2022 | $491,080 | $549,952 |
| 2023 | $518,276 | $584,859 |
| 2024 | $519,375 | $628,845 |
| 2025 (up till June) | $550,745 | $671,680 |
| % increase from 2014 to June 2025 | 13.96% | 51.23% |
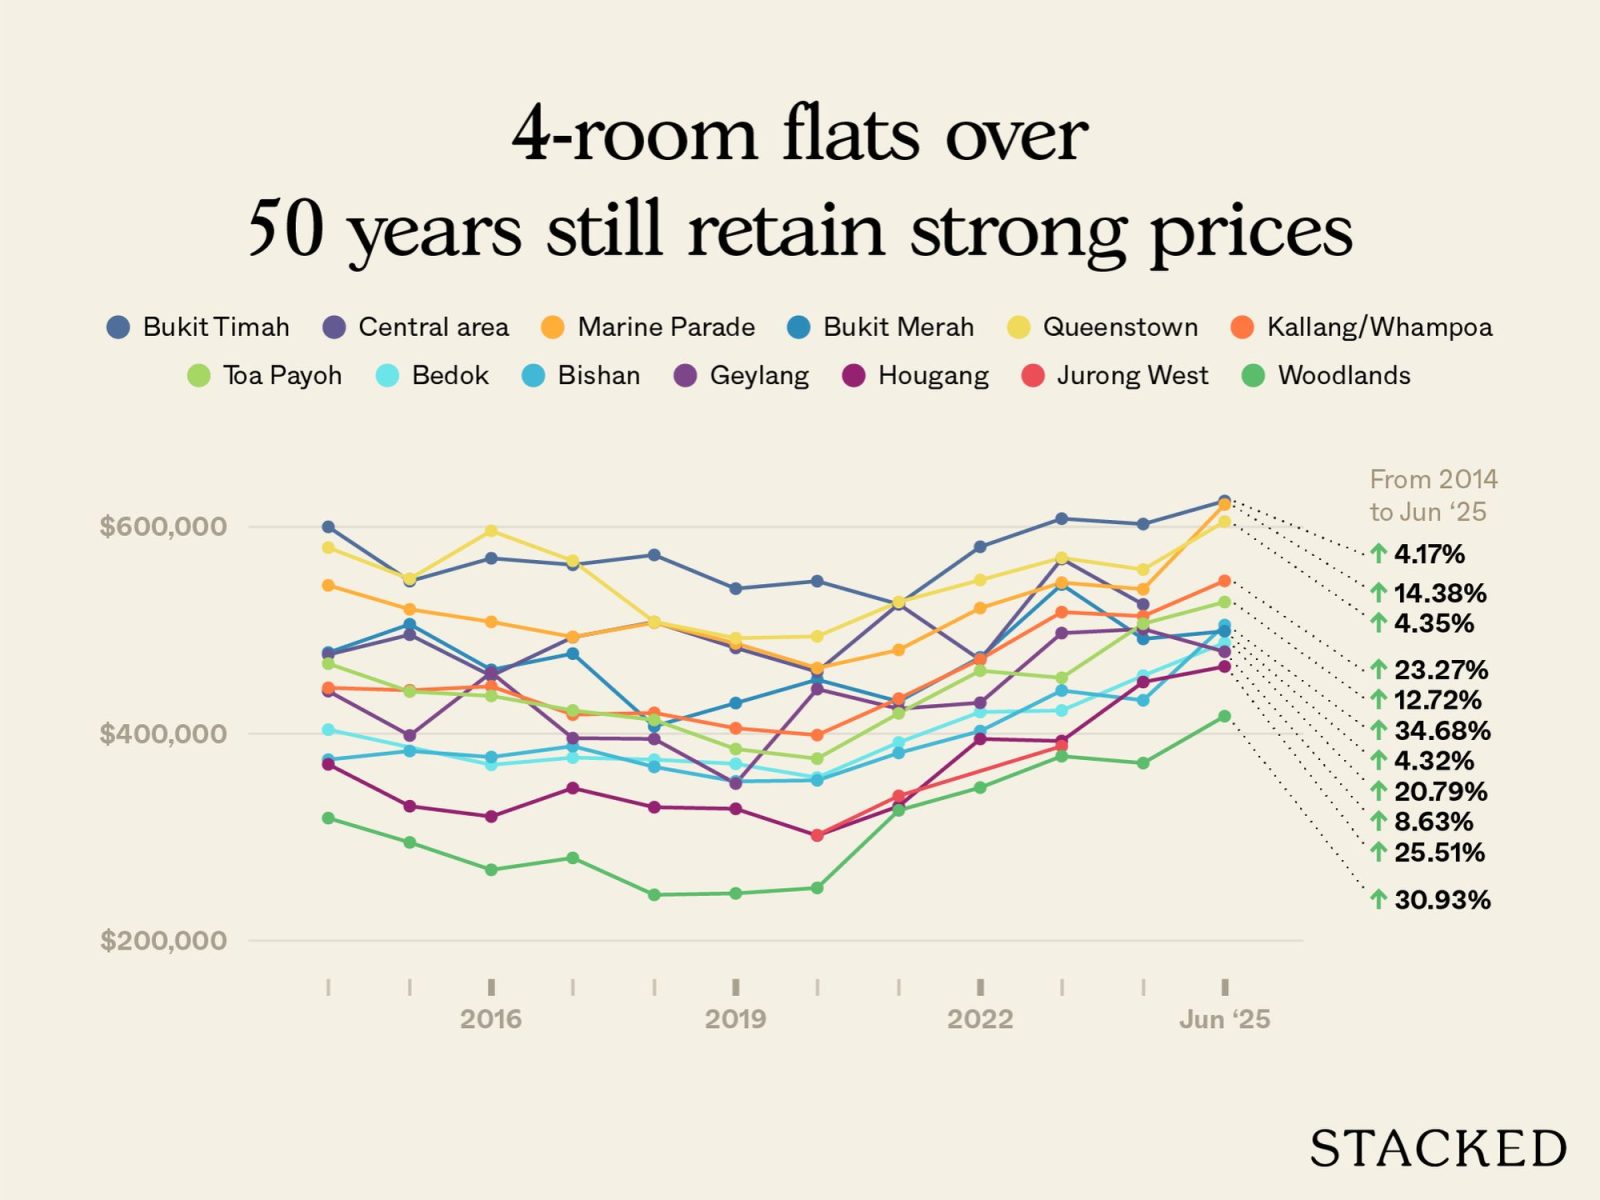
4-room flats currently above 50 years old in the various towns
| Year | BEDOK | BISHAN | BUKIT MERAH | BUKIT TIMAH | CENTRAL AREA | GEYLANG | HOUGANG | JURONG WEST | KALLANG/WHAMPOA | MARINE PARADE | QUEENSTOWN | TOA PAYOH | WOODLANDS |
| 2014 | $404,000 | $375,000 | $478,453 | $600,000 | $476,500 | $441,250 | $370,500 | $444,384 | $543,472 | $579,951 | $467,813 | $318,500 | |
| 2015 | $383,333 | $505,856 | $547,500 | $495,750 | $398,333 | $330,000 | $442,076 | $520,286 | $549,750 | $440,773 | $295,000 | ||
| 2016 | $370,000 | $377,500 | $461,816 | $569,625 | $456,000 | $459,250 | $320,000 | $445,825 | $508,176 | $596,150 | $436,609 | $268,500 | |
| 2017 | $376,963 | $388,000 | $477,495 | $563,333 | $493,333 | $395,750 | $347,500 | $418,520 | $493,577 | $567,217 | $422,536 | $280,000 | |
| 2018 | $375,000 | $368,000 | $407,245 | $572,825 | $508,000 | $395,000 | $329,000 | $420,181 | $507,368 | $508,246 | $413,376 | $244,333 | |
| 2019 | $370,972 | $354,000 | $429,673 | $540,300 | $483,000 | $351,900 | $327,500 | $405,364 | $487,375 | $492,414 | $385,278 | $245,750 | |
| 2020 | $357,667 | $355,000 | $452,324 | $547,515 | $460,000 | $443,229 | $301,667 | $302,000 | $398,750 | $463,510 | $494,144 | $375,956 | $251,000 |
| 2021 | $391,600 | $381,500 | $431,235 | $525,231 | $525,300 | $424,167 | $330,000 | $340,000 | $433,963 | $481,042 | $527,397 | $419,765 | $326,000 |
| 2022 | $421,014 | $402,625 | $473,909 | $580,726 | $471,500 | $430,000 | $395,000 | $471,963 | $521,509 | $548,587 | $460,955 | $348,000 | |
| 2023 | $422,500 | $441,778 | $544,263 | $607,922 | $569,000 | $497,333 | $393,000 | $388,000 | $517,614 | $546,105 | $570,087 | $454,082 | $378,333 |
| 2024 | $456,178 | $432,378 | $491,684 | $602,717 | $525,000 | $501,222 | $450,000 | $513,682 | $539,757 | $558,747 | $506,377 | $371,667 | |
| 2025 (up till June) | $488,000 | $505,033 | $499,125 | $625,000 | $479,333 | $465,000 | $547,813 | $621,598 | $605,161 | $527,333 | $417,000 | ||
| % increase from 2014 to June 2025 | 20.79% | 34.68% | 4.32% | 4.17% | 8.63% | 25.51% | 23.27% | 14.38% | 4.35% | 12.72% | 30.93% |
4-room flats currently below 50 years old in the various towns (we will only include those with flats that are 50 years and above for comparison)
| Year | BEDOK | BISHAN | BUKIT MERAH | BUKIT TIMAH | CENTRAL AREA | GEYLANG | HOUGANG | JURONG WEST | KALLANG/WHAMPOA | MARINE PARADE | QUEENSTOWN | TOA PAYOH | WOODLANDS |
| 2014 | $450,982 | $525,944 | $640,814 | $681,667 | $592,545 | $486,664 | $423,268 | $403,234 | $558,108 | $544,778 | $697,341 | $561,700 | $381,356 |
| 2015 | $431,074 | $536,169 | $638,004 | $681,629 | $804,812 | $504,933 | $400,014 | $384,074 | $578,371 | $558,667 | $684,857 | $536,987 | $360,743 |
| 2016 | $431,567 | $573,409 | $650,470 | $681,699 | $744,673 | $496,734 | $384,396 | $389,364 | $594,856 | $564,091 | $693,112 | $570,896 | $354,992 |
| 2017 | $443,728 | $575,423 | $668,095 | $663,043 | $764,145 | $515,245 | $390,382 | $373,512 | $581,181 | $568,133 | $697,379 | $593,732 | $346,128 |
| 2018 | $432,813 | $565,356 | $661,211 | $674,784 | $764,113 | $522,443 | $385,826 | $361,525 | $572,970 | $554,222 | $716,414 | $608,667 | $334,537 |
| 2019 | $426,753 | $551,593 | $659,977 | $679,648 | $738,745 | $515,100 | $391,344 | $363,052 | $580,327 | $506,654 | $725,455 | $592,005 | $336,232 |
| 2020 | $444,917 | $542,551 | $671,919 | $661,407 | $712,533 | $551,022 | $418,436 | $377,726 | $581,273 | $492,600 | $769,483 | $585,056 | $353,228 |
| 2021 | $488,991 | $581,055 | $718,012 | $675,858 | $879,210 | $592,833 | $464,403 | $436,847 | $666,049 | $527,846 | $786,217 | $641,349 | $413,842 |
| 2022 | $509,679 | $645,608 | $732,255 | $743,290 | $861,411 | $602,209 | $521,329 | $480,906 | $768,484 | $546,164 | $829,347 | $734,078 | $472,334 |
| 2023 | $572,717 | $714,342 | $815,398 | $806,583 | $946,775 | $646,175 | $546,859 | $499,649 | $779,903 | $598,938 | $889,243 | $773,872 | $499,408 |
| 2024 | $597,291 | $751,156 | $868,503 | $859,353 | $980,005 | $783,157 | $593,338 | $520,752 | $874,235 | $651,923 | $925,921 | $857,442 | $536,097 |
| 2025 (up till June) | $657,304 | $796,225 | $904,082 | $907,223 | $1,041,739 | $780,946 | $633,648 | $553,806 | $894,337 | $673,286 | $987,996 | $937,318 | $563,677 |
| % increase from 2014 to June 2025 | 45.75% | 51.39% | 41.08% | 33.09% | 75.81% | 60.47% | 49.70% | 37.34% | 60.24% | 23.59% | 41.68% | 66.87% | 47.81% |
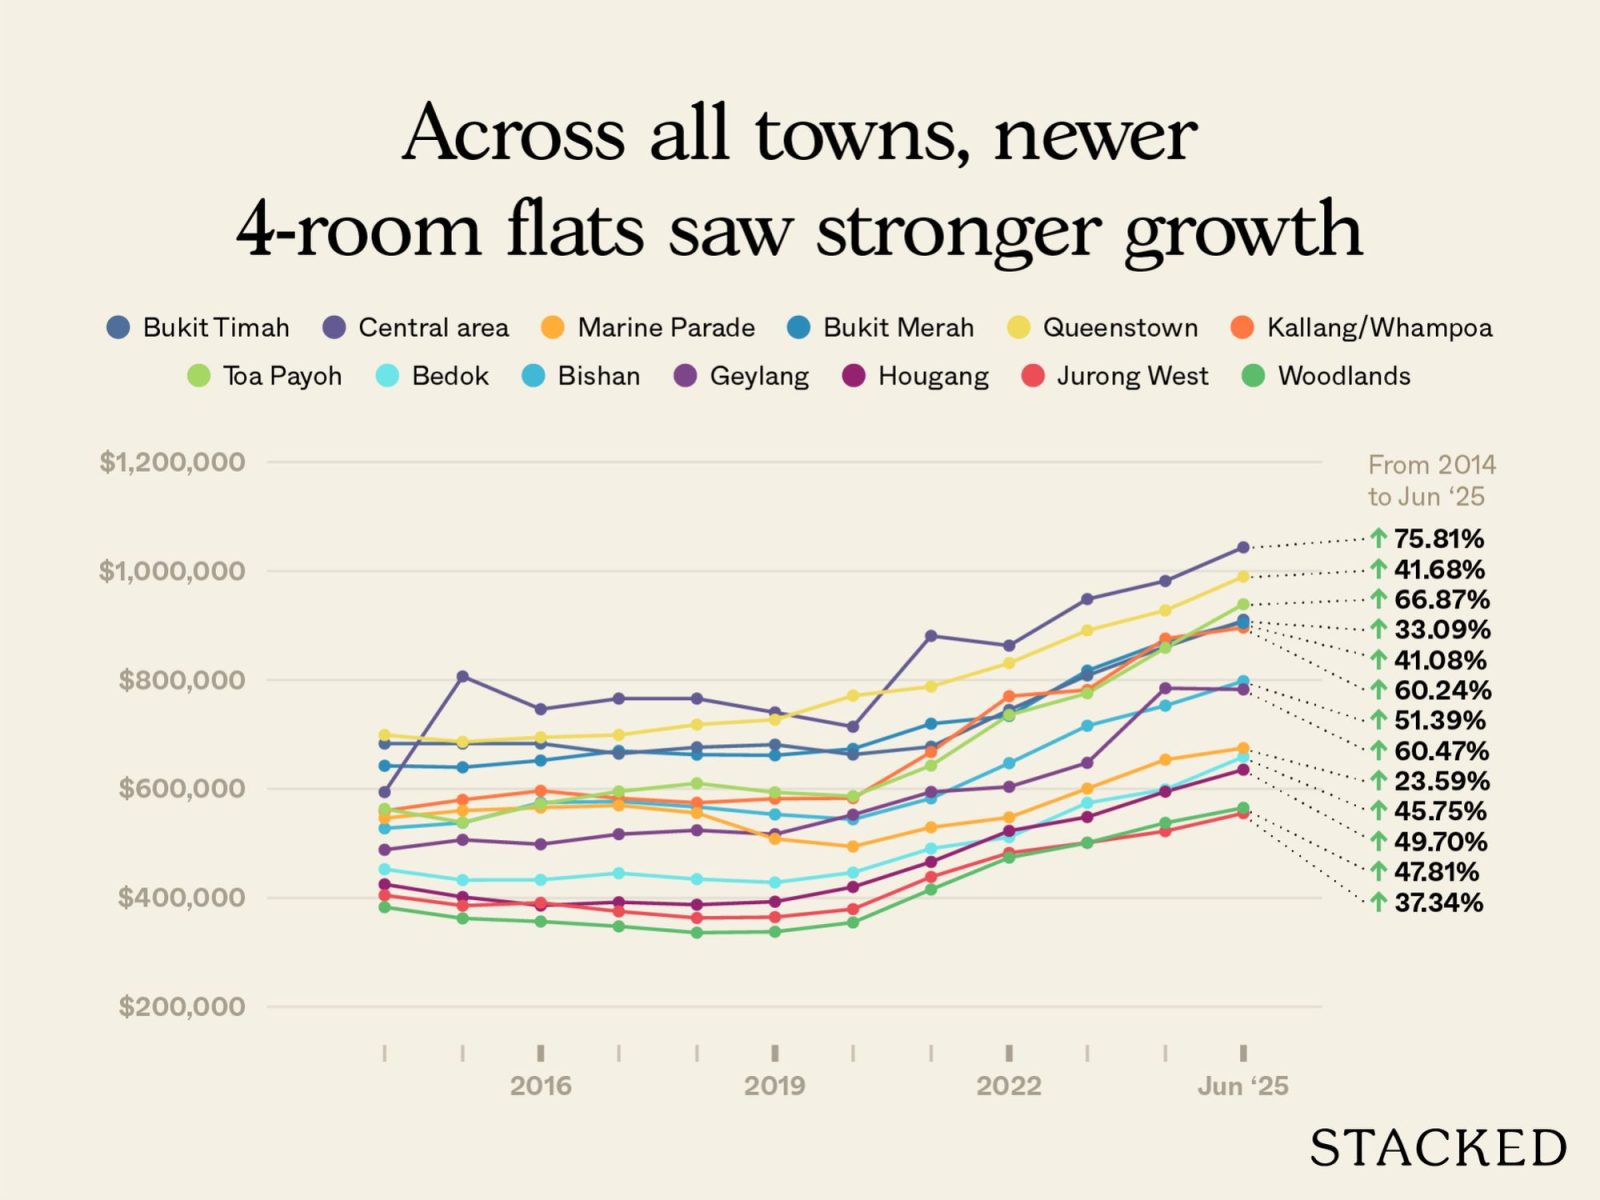
For a 4-room HDB, the split is very wide. Older flats appreciated just 13.96 per cent over the period, while younger ones gained 51.23 per cent. This was true across almost every town: estates like Bishan, Toa Payoh, and Kallang/Whampoa saw younger flats far outpace their older stock, while older four-roomers in Bukit Merah and Bukit Timah barely moved.
This shows that, whilst the 50+ year old flats still managed to appreciate, some of them are reaching a plateau.
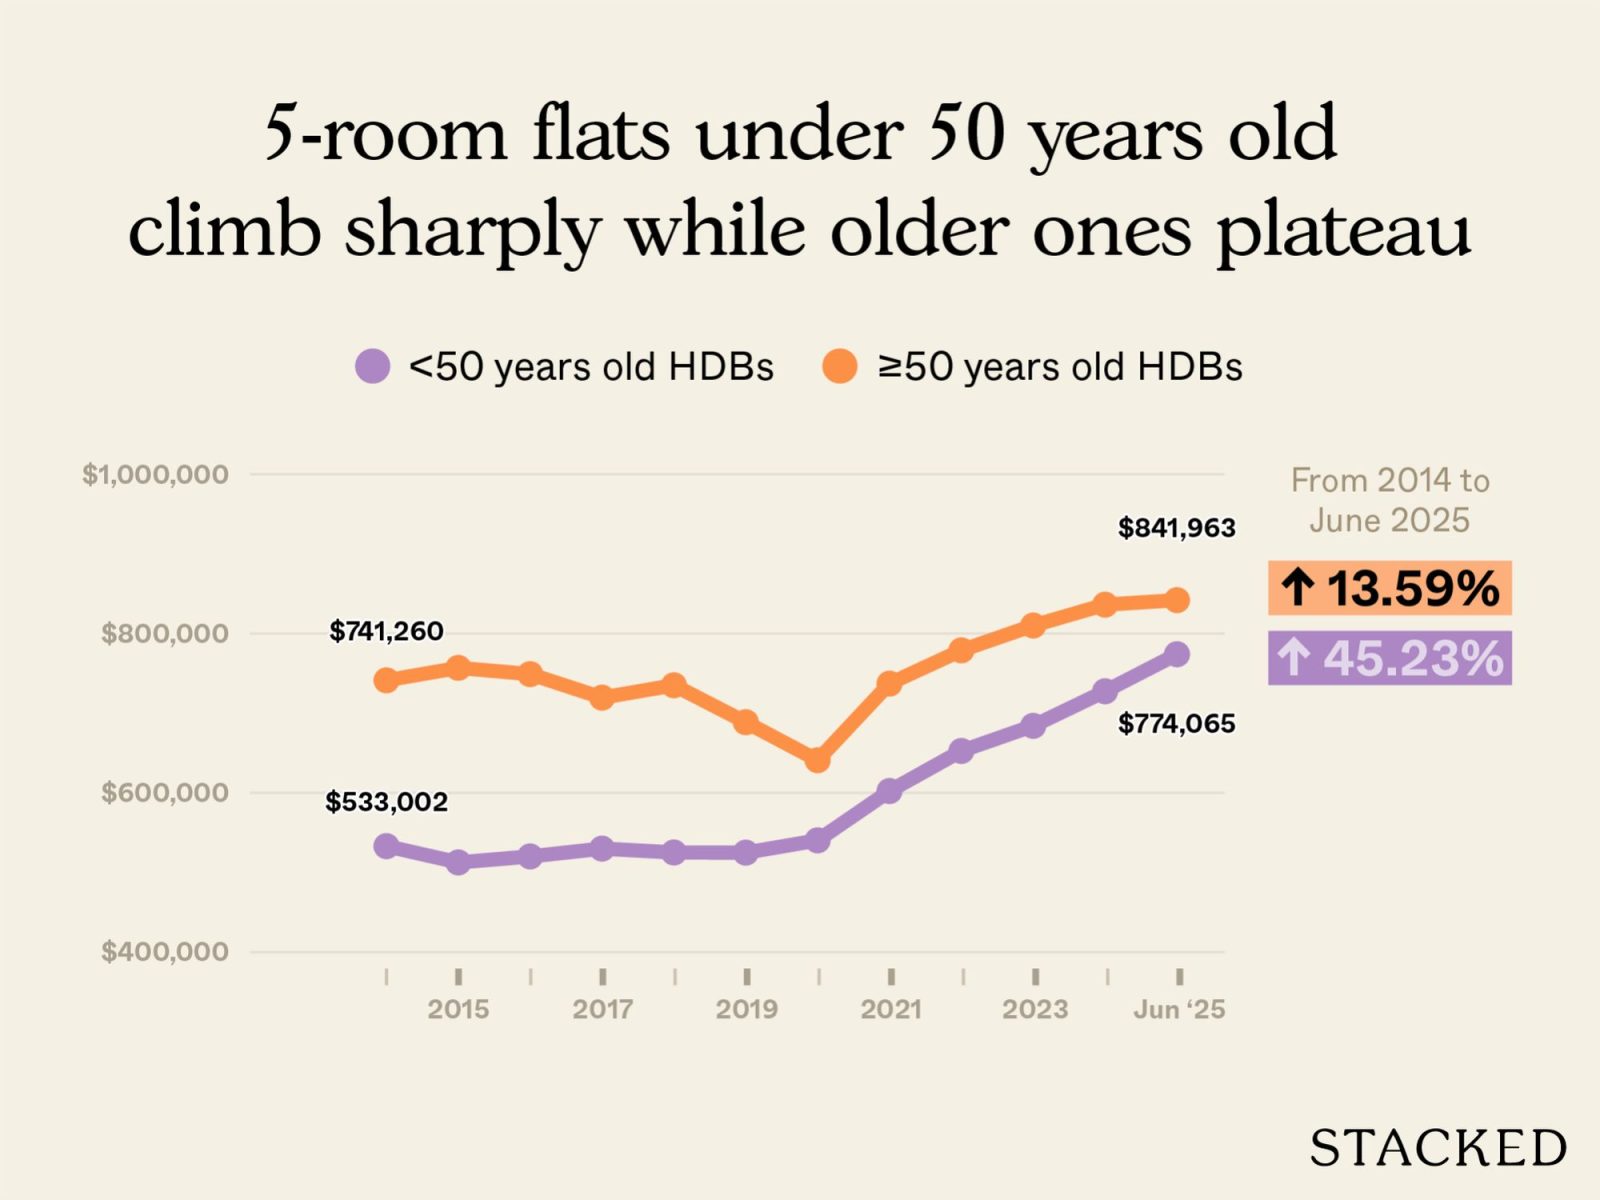
5-room flats
| Year | HDBs currently 50 years old and above | HDBs currently less than 50 years old |
| 2014 | $741,260 | $533,002 |
| 2015 | $756,923 | $512,545 |
| 2016 | $749,057 | $520,061 |
| 2017 | $719,501 | $529,889 |
| 2018 | $735,024 | $525,032 |
| 2019 | $688,682 | $524,819 |
| 2020 | $640,900 | $540,263 |
| 2021 | $737,141 | $602,226 |
| 2022 | $778,909 | $652,559 |
| 2023 | $810,078 | $684,109 |
| 2024 | $836,305 | $727,522 |
| 2025 (up till June) | $841,963 | $774,065 |
| % increase from 2014 to June 2025 | 13.59% | 45.23% |
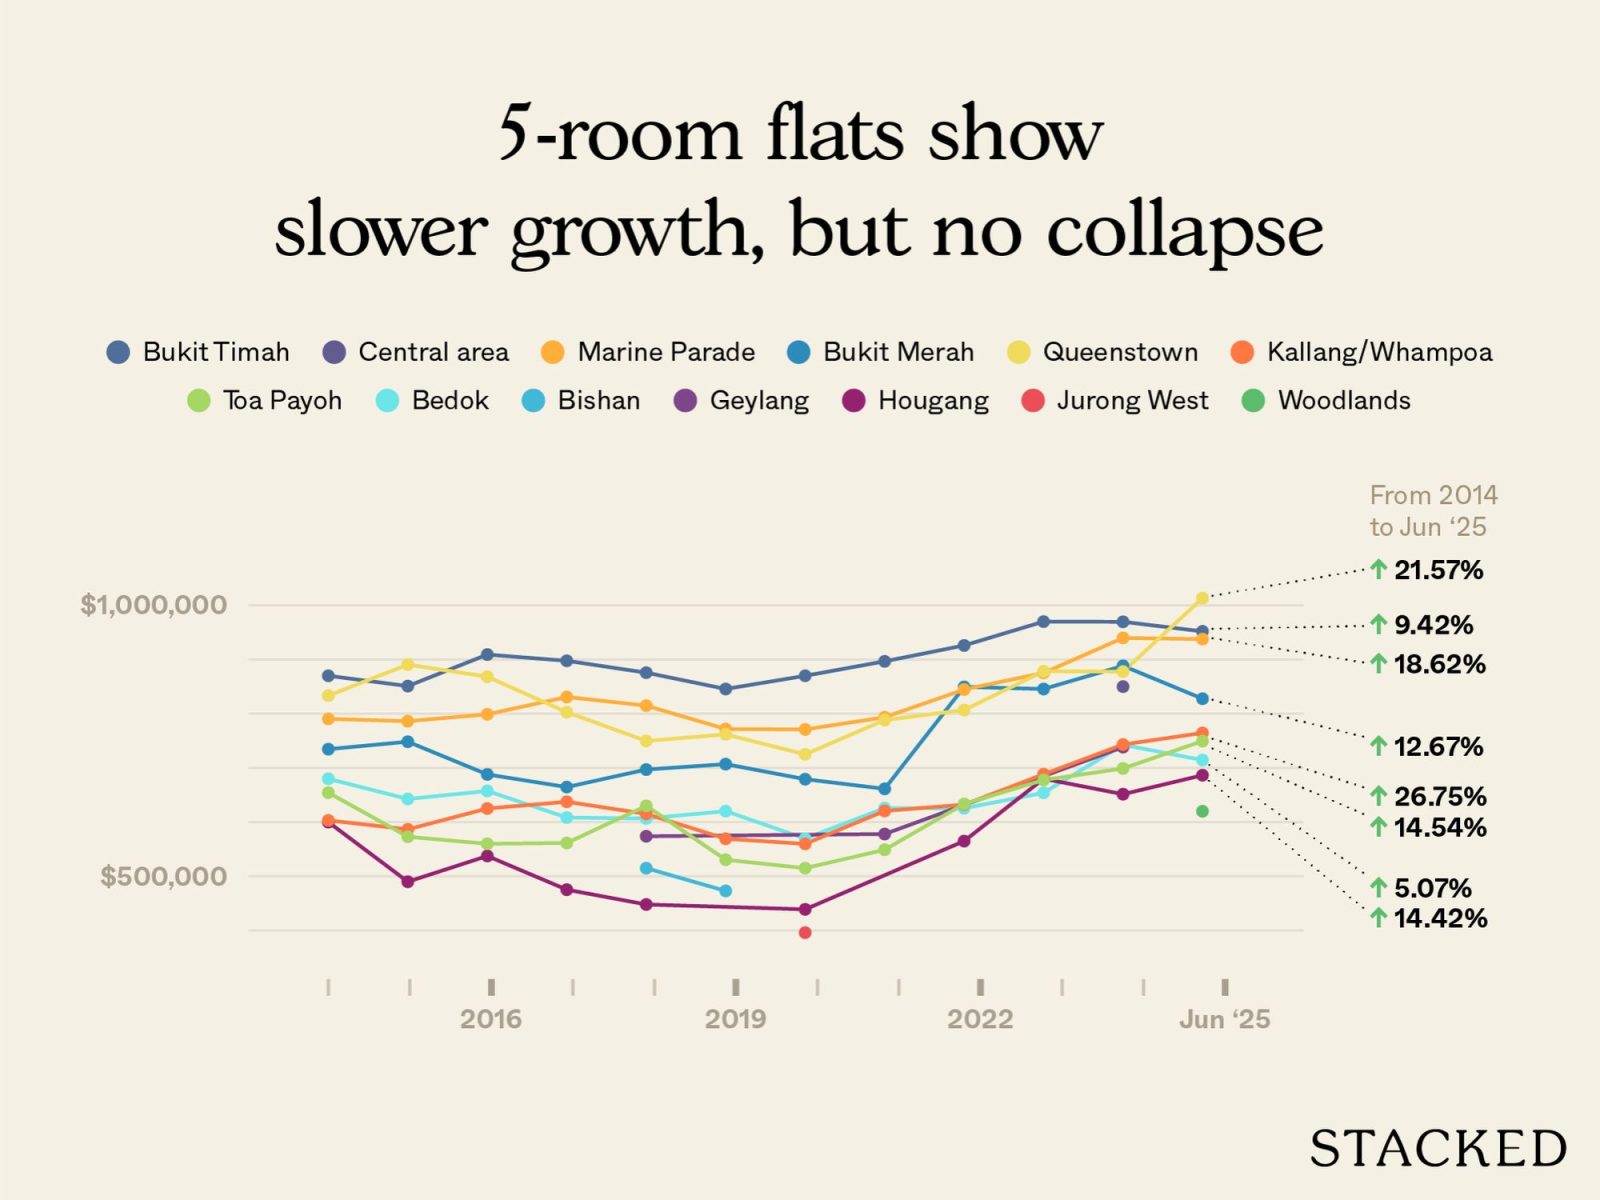
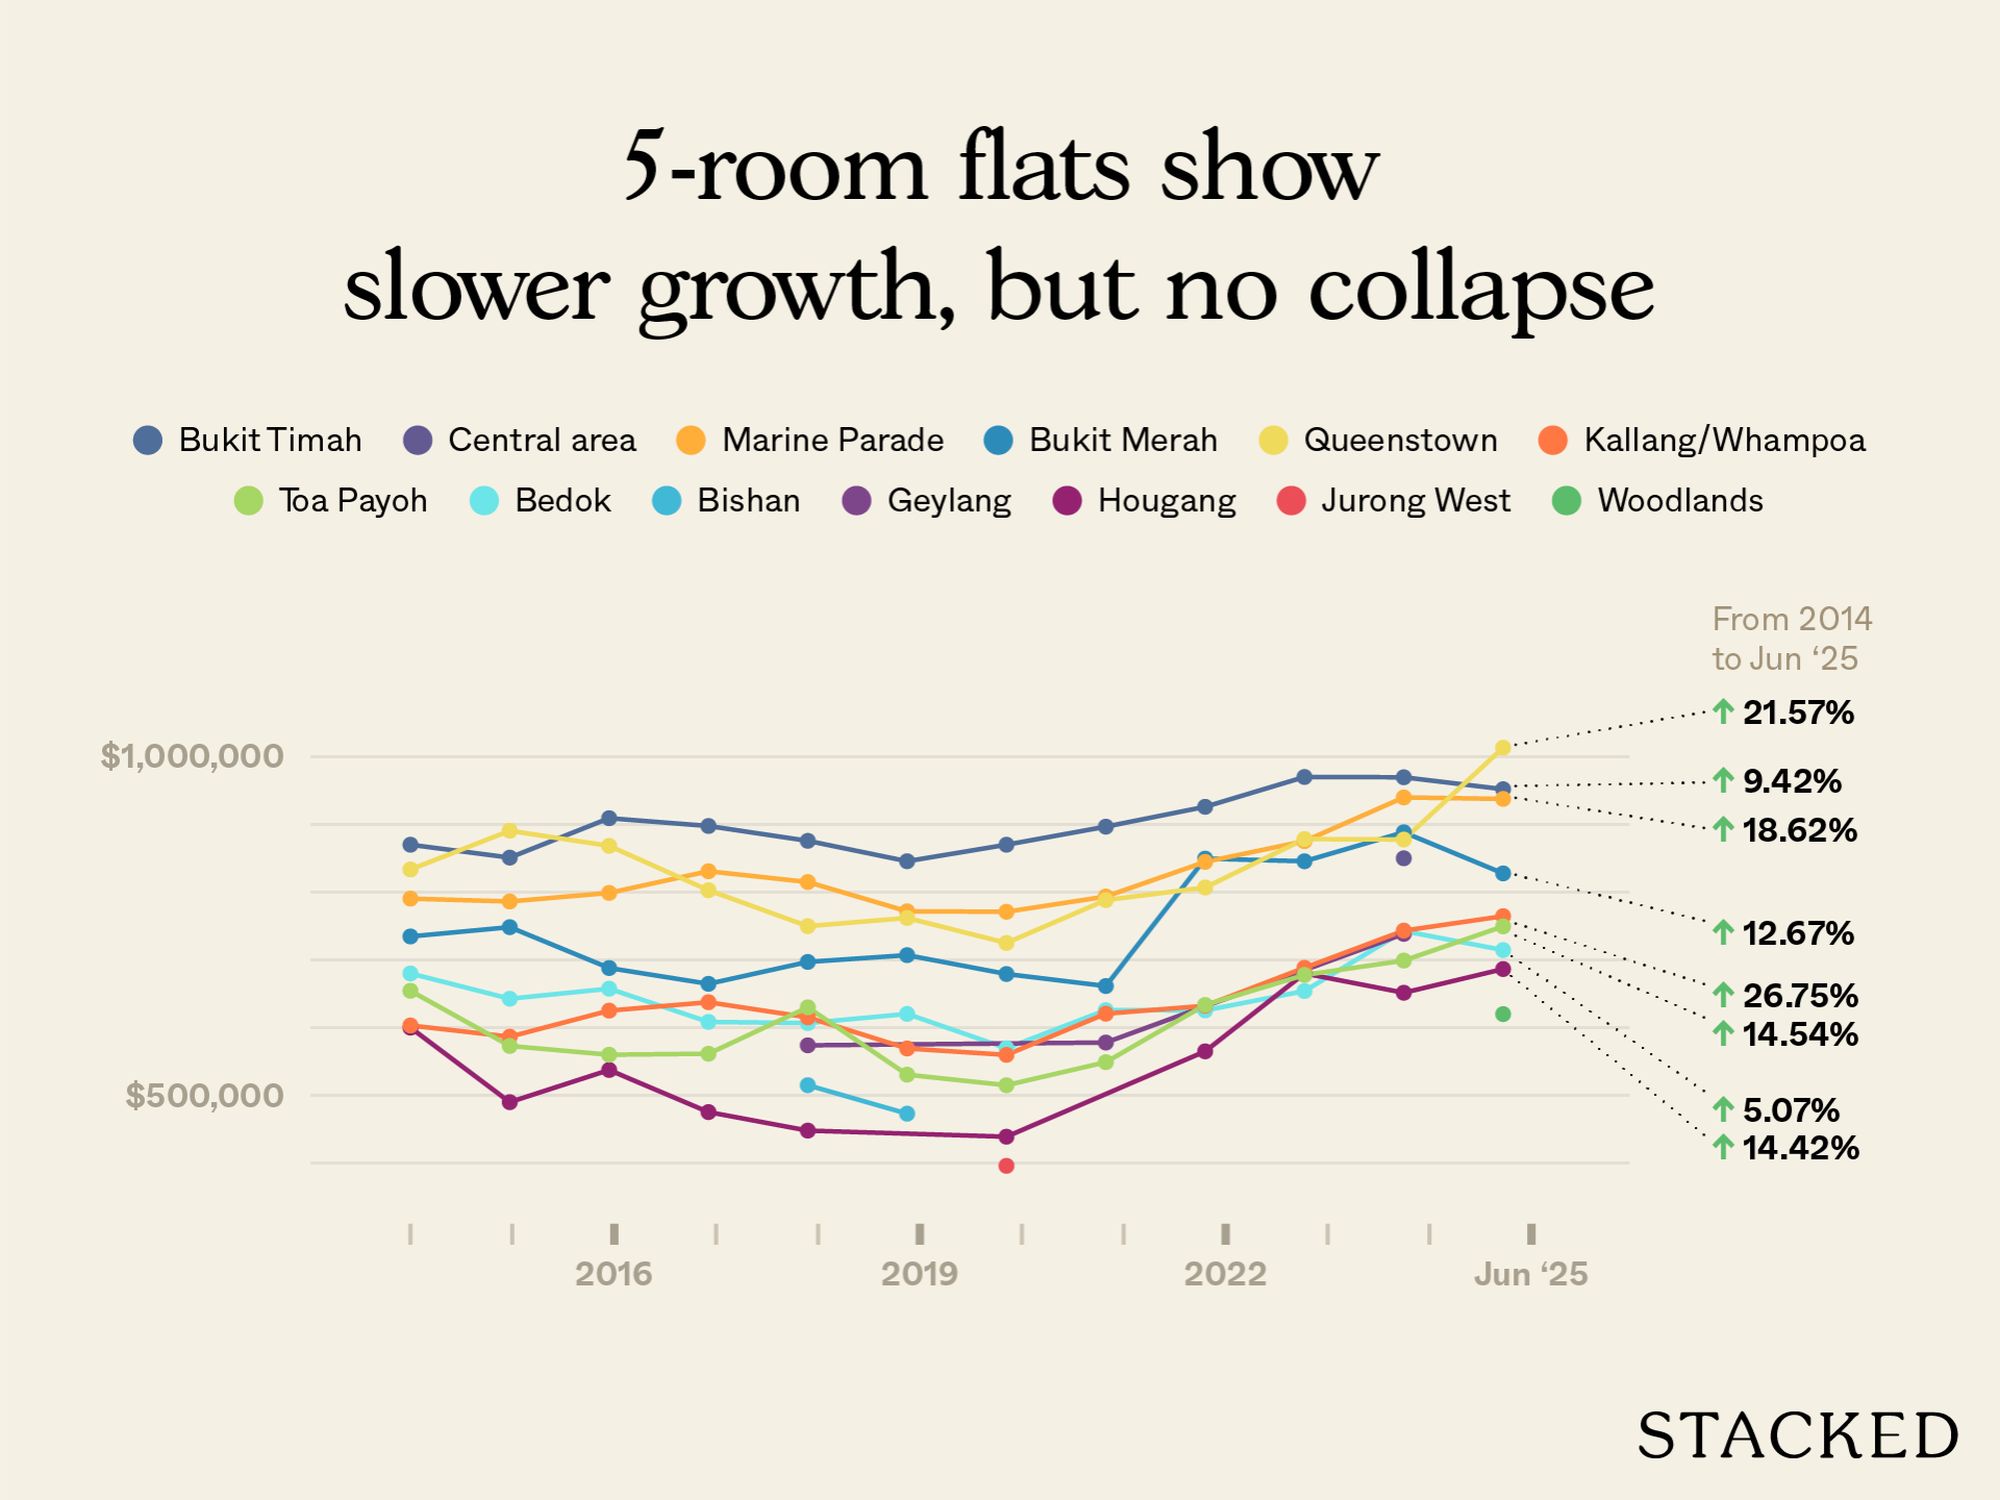
5-room flats currently above 50 years old in the various towns
| Year | BEDOK | BISHAN | BUKIT MERAH | BUKIT TIMAH | CENTRAL AREA | GEYLANG | HOUGANG | JURONG WEST | KALLANG/WHAMPOA | MARINE PARADE | QUEENSTOWN | TOA PAYOH | WOODLANDS |
| 2014 | $680,000 | $734,600 | $870,000 | $600,000 | $603,182 | $790,450 | $833,468 | $654,333 | |||||
| 2015 | $642,667 | $748,333 | $851,000 | $490,000 | $586,600 | $786,244 | $890,648 | $573,000 | |||||
| 2016 | $657,500 | $688,000 | $909,167 | $537,500 | $625,091 | $798,870 | $868,333 | $560,000 | |||||
| 2017 | $608,467 | $664,654 | $897,667 | $475,333 | $637,500 | $830,882 | $802,818 | $561,472 | |||||
| 2018 | $606,667 | $515,000 | $697,000 | $875,750 | $573,888 | $448,000 | $615,200 | $814,953 | $749,818 | $630,000 | |||
| 2019 | $620,250 | $473,000 | $707,000 | $845,667 | $569,250 | $771,750 | $761,900 | $530,571 | |||||
| 2020 | $569,500 | $679,167 | $870,000 | $439,000 | $396,000 | $559,778 | $771,020 | $725,000 | $515,000 | ||||
| 2021 | $625,800 | $661,400 | $896,667 | $578,000 | $620,583 | $793,507 | $788,286 | $549,000 | |||||
| 2022 | $625,481 | $849,486 | $926,000 | $565,000 | $632,222 | $844,664 | $806,861 | $633,489 | |||||
| 2023 | $654,000 | $845,600 | $970,000 | $680,000 | $688,300 | $875,318 | $878,350 | $677,750 | |||||
| 2024 | $742,600 | $888,413 | $969,600 | $850,000 | $738,388 | $651,500 | $743,170 | $939,837 | $877,667 | $699,000 | |||
| 2025 (up till June) | $714,463 | $827,667 | $951,963 | $686,500 | $764,555 | $937,636 | $1,013,250 | $749,500 | $620,000 | ||||
| % increase from 2014 to June 2025 | 5.07% | 12.67% | 9.42% | 14.42% | 26.75% | 18.62% | 21.57% | 14.54% |
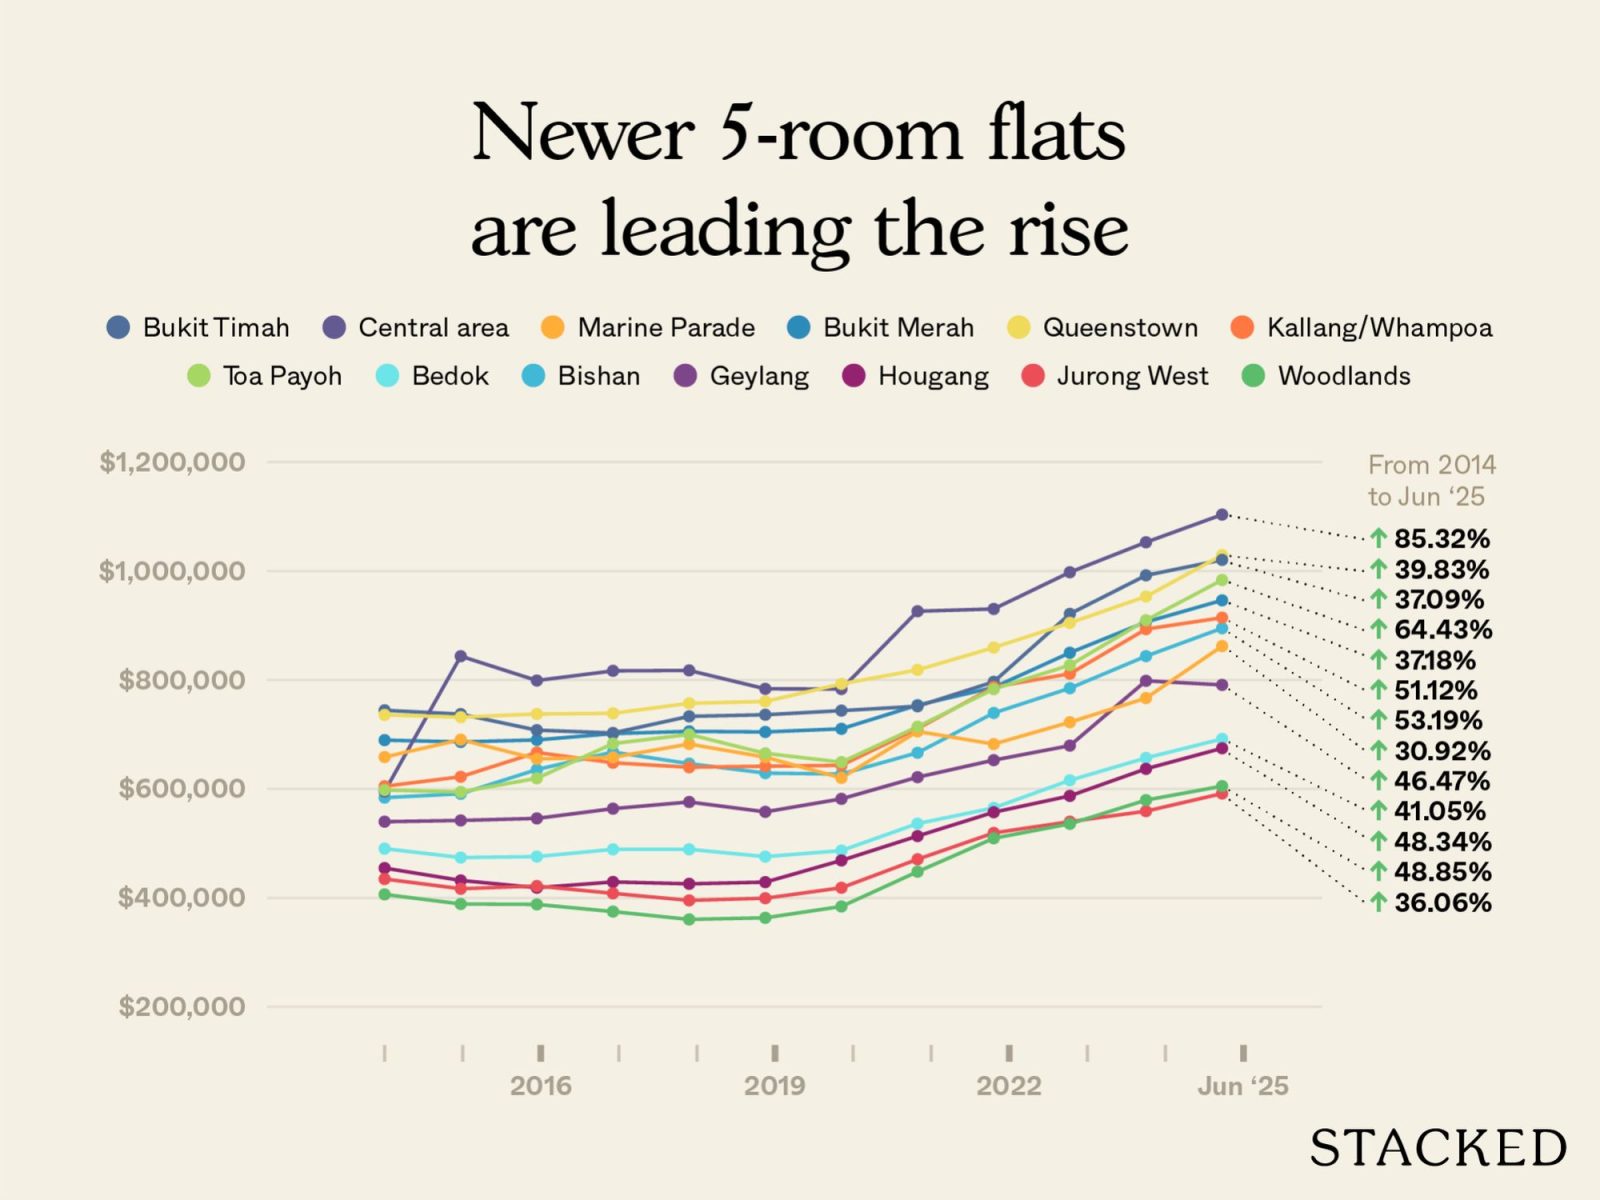
5-room flats currently below 50 years old in the various towns (we will only include those with flats that are 50 years and above for comparison)
| Year | BEDOK | BISHAN | BUKIT MERAH | BUKIT TIMAH | CENTRAL AREA | GEYLANG | HOUGANG | JURONG WEST | KALLANG/WHAMPOA | MARINE PARADE | QUEENSTOWN | TOA PAYOH | WOODLANDS |
| 2014 | $490,629 | $584,327 | $689,849 | $744,500 | $595,606 | $540,150 | $454,964 | $434,972 | $605,149 | $658,719 | $736,035 | $598,253 | $406,685 |
| 2015 | $474,324 | $591,316 | $686,518 | $737,565 | $843,888 | $542,426 | $432,293 | $417,110 | $622,595 | $690,663 | $731,965 | $594,701 | $389,030 |
| 2016 | $476,066 | $635,725 | $690,200 | $708,112 | $799,168 | $546,202 | $418,966 | $422,056 | $667,091 | $655,250 | $737,811 | $619,769 | $388,270 |
| 2017 | $489,297 | $667,890 | $701,822 | $702,953 | $816,956 | $564,060 | $429,495 | $408,628 | $648,234 | $658,182 | $738,946 | $683,478 | $375,106 |
| 2018 | $489,448 | $646,614 | $705,929 | $733,444 | $817,758 | $576,283 | $426,091 | $395,669 | $639,955 | $682,721 | $757,428 | $700,290 | $360,706 |
| 2019 | $475,958 | $629,300 | $704,825 | $736,380 | $783,893 | $558,193 | $429,163 | $399,642 | $641,870 | $658,432 | $760,688 | $665,495 | $363,660 |
| 2020 | $487,021 | $627,507 | $710,589 | $743,947 | $783,634 | $582,015 | $468,998 | $418,877 | $643,507 | $620,480 | $792,993 | $649,323 | $384,483 |
| 2021 | $536,622 | $666,637 | $754,020 | $751,915 | $926,322 | $621,813 | $513,702 | $471,130 | $710,894 | $705,815 | $818,707 | $714,326 | $448,362 |
| 2022 | $565,413 | $739,643 | $786,535 | $796,794 | $930,533 | $653,007 | $557,487 | $519,446 | $787,113 | $682,586 | $859,687 | $783,478 | $509,598 |
| 2023 | $616,049 | $785,054 | $850,206 | $921,495 | $997,932 | $679,736 | $587,484 | $540,182 | $811,586 | $722,714 | $904,906 | $827,445 | $536,103 |
| 2024 | $657,080 | $843,976 | $906,584 | $992,253 | $1,052,921 | $798,625 | $637,114 | $559,442 | $893,529 | $766,900 | $953,421 | $909,853 | $579,731 |
| 2025 (up till June) | $692,029 | $895,157 | $946,357 | $1,020,599 | $1,103,761 | $791,135 | $674,876 | $591,822 | $914,504 | $862,422 | $1,029,216 | $983,737 | $605,356 |
| % increase from 2014 to June 2025 | 41.05% | 53.19% | 37.18% | 37.09% | 85.32% | 46.47% | 48.34% | 36.06% | 51.12% | 30.92% | 39.83% | 64.43% | 48.85% |
5-room flats show the same pattern, with newer flats obviously seeing better gains. In towns where older 5-room flats crossed $900,000 to $1 million (such as Queenstown or Kallang/Whampoa), their percentage gains were expectedly muted; these flats are already so expensive, there’s limited room for any further growth.
By contrast, newer 5-room flats have shown phenomenal gains, with Central Area (+85 per cent), Toa Payoh (+64 per cent), and Bishan (+53 per cent) standing out. That said, it’s probably not a surprise to Singaporeans that these hotspots can see such strong gains.
It’s clear there’s no collapse in prices yet, even among 50+ year old flats
While the town-by-town data shows resilience, the broader islandwide picture makes the difference clearer. When we split the numbers into two buckets – flats that are already more than 50 years old, and those still below that mark – the divergence is obvious.
From 2014 to mid-2025, flats above 50 years old rose by around 16.8 per cent. By contrast, those younger than 50 climbed by about 47 per cent in the same period. In absolute terms, the older flats went from an average of about $368,000 in 2014 to $430,000 in 2025; the younger group leapt from roughly $449,000 to $661,000.
This doesn’t show an outright collapse in older flat prices, but it does confirm that appreciation is slowing. The older the block, the more muted the gains. This is consistent across 3,4, and 5-room flats.
In short, we haven’t yet reached a point in our history where we see an average decline due to lease decay.
This seems to run contrary to Bala’s Curve, which we often use for land pricing
If you’ve followed our past pieces on lease decay, you’ll know we often reference Bala’s Curve – the standard model valuers use to price leasehold properties.
In theory, once a property crosses around 60 years old, the depreciation is supposed to steepen sharply. By the time you’re looking at flats in the 50- to 60-year range, the curve suggests values should be tapering off fast:
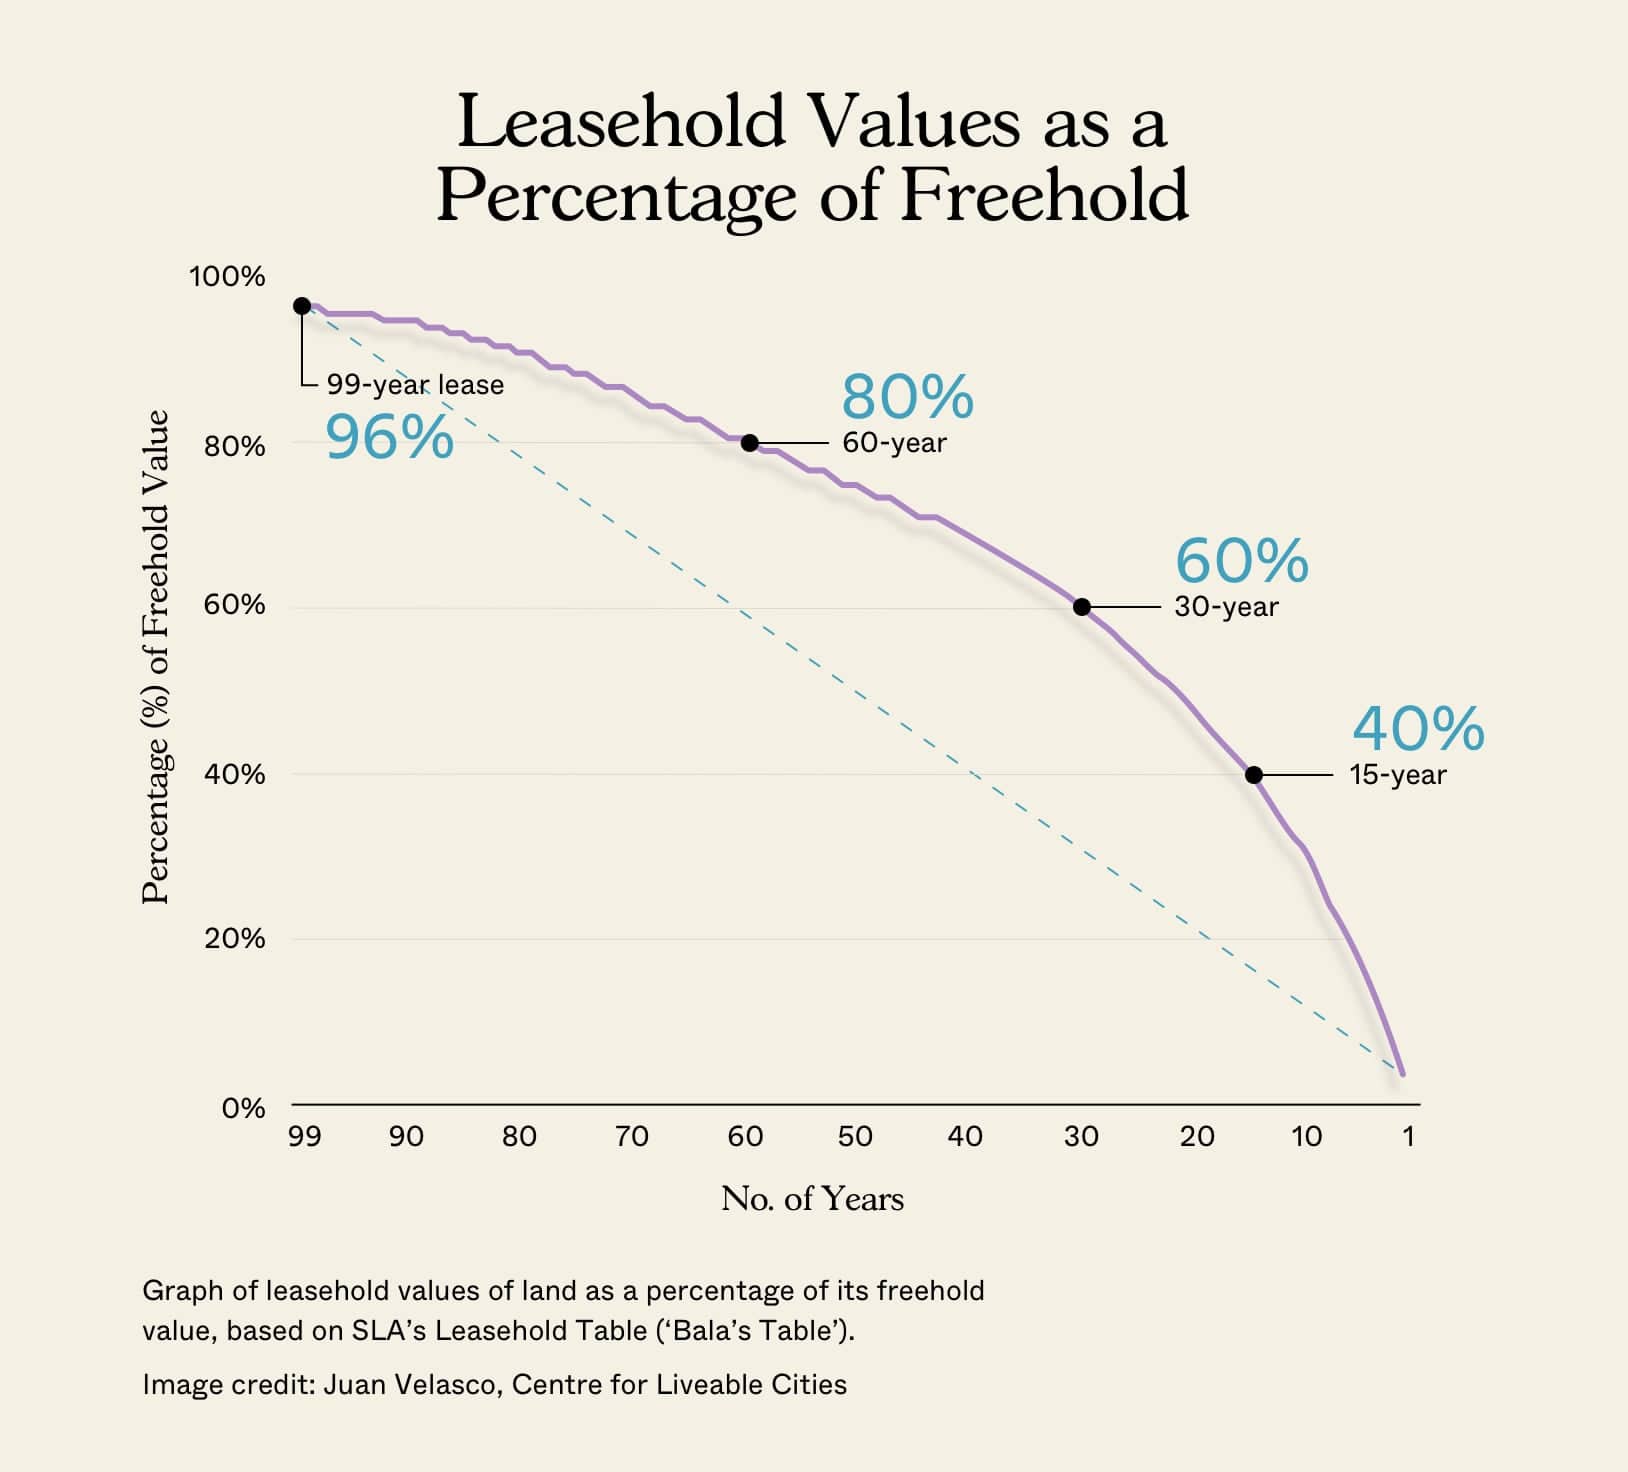
(Percentage of land value, so if land price moves up, the value increase can disguise the depreciation – can see land values from the private market)
Yet here we are, and the numbers don’t show any such collapse. Why?
There are four possible reasons. The first is that real market demand has been stronger than theory. People buying or selling resale flats don’t pull out Bala’s Curve in their notes and start using that for the offers – the practical realities are quantum and location.
Due to amenities and size, a 50-year-old Queenstown flat at $900,000 still looks cheap beside a smaller $1.8 million new launch condo, in a worse location. That means more than any theoretical leasehold pricing model.
The second reason is a more temporary one: we may still be seeing the heavy distorting effects of COVID and its aftermath, from 2020 to 2023. This spiked resale demand and hence prices, lifting up the values of even the oldest flats; this may have temporarily stalled the curve’s predicted decline.
The third factor is Singapore’s ageing population. We’re going to be a super-aged society by UN standards coming into 2026. Older Singaporeans don’t need very long leases on their flats, and if they’re downsizing from condos or even landed property, then they have the means to more than pay for even million-dollar older flats.
As there’s no interest in resale gains or rental yields or other dollar-based results, many of these older Singaporeans are fine to pay (or overpay as it were) for even the oldest flats – just provided it has an excellent location, or even maintains the same level of spaciousness they had before. This provides solid support for even 50+ year old flats in strong locations.
The fourth reason is simply that land values are not static. Bala’s Curve is based on land values, so as amenities get built, like new malls, train stations, etc., the land values will rise. These rising land values may disguise some of the actual depreciation. In other words, the rising value of the land offsets the natural decline of the properties on it. This would be true for both private leasehold properties as well as HDB flats.
We still see high base prices for desirable flats in the oldest towns
Don’t be misled: the uneven gains among 50+ year-old flats are not a sign that they’re somehow undesirable. It’s mainly a matter of high base prices.
Take Bedok’s 5-room flats, which were already around $680,000 in 2014. By mid-2025, they had risen to about $714,000 – just a five per cent gain on paper, but still a hefty six-figure quantum. Compare this with Kallang/Whampoa’s 5-roomers, which began lower at roughly $603,000, and ended at $764,000: a much flashier +27 per cent rise but quite close in absolute terms.
But here’s the key point: those high base prices are remarkable when you factor in the lease decay. It shows buyers are still willing to pay around $750,000+ for flats more than 50 years old, so long as the location is right.
And it’s not just resilience – some pricier estates are still outperforming despite high base prices. Queenstown’s 5-roomers, already near $790,000 in 2014, climbed to about $938,000 — an impressive +22 per cent gain despite their high starting point.
So don’t be misled by the slower percentage growth, like the four per cent bump in Bukit Merah, Bukit Timah, and Queenstown. These are still areas with very high-priced flats, despite the lease decay.
As an aside, size preferences can make a big difference within the same towns
The same “slower but not falling” pattern shows up when we compare older flats directly against younger ones by flat type.
- 3-room flats: Flats above 50 years appreciated just under 14 per cent since 2014, while younger ones gained 43 per cent. Almost every town followed this trend, with Marine Parade being the rare outlier where older three-room flats held up better.
- 4-room flats: Older flats climbed only about 14 per cent on average, compared to over 51 per cent for younger ones. Again, the growth gap was seen across all towns, with places like Bishan and Kallang/Whampoa showing dramatic differences.
- 5-room flats: Even here, where older flats in strong towns like Queenstown and Kallang/Whampoa crossed the $900,000 to $1 million mark, the overall increase was about 13.6 per cent. Younger five-room flats, however, were up by more than 45 per cent islandwide.
So, while the old flats are still rising in quantum terms (sometimes fetching $700,000 to $1 million despite being 50 years old), they are no longer moving at the same pace as the younger stock.
Conclusion
In summary, the new data makes the distinction clearer. Prices of older flats are still going up, but their growth is consistently slower than younger flats.
From 2014 to mid-2025, flats above 50 years rose by just under 17 per cent, compared to nearly 47 per cent for younger ones. This matches what theory would predict: lease decay may not cause a sudden collapse, but it does act as a brake.
Location and size still shield older flats from outright losses; many still fetch $700,000 to $1 million despite being 50 years old. But over time, the gap will widen: younger flats are outpacing older stock in virtually every town and flat type.
The day will eventually come when flats run down to zero
The leasehold clock is real, and the transition to VERS is a reminder of that. But the path there isn’t the sudden cliff-drop that headlines and Facebook comments like to suggest. Instead, it looks more like a gradual plateau and taper, happening at very different paces across towns and flat types.
On a broader note, demographics may soften the blow. Singapore is ageing quickly; and as our society becomes super-aged, fewer buyers will need (or even want) a full 99-year lease. The flats are getting older, but so are their occupants – and we seem to be running out of years faster than our leases.
At Stacked, we like to look beyond the headlines and surface-level numbers, and focus on how things play out in the real world.
If you’d like to discuss how this applies to your own circumstances, you can reach out for a one-to-one consultation here.
And if you simply have a question or want to share a thought, feel free to write to us at stories@stackedhomes.com — we read every message.

1 Comments
How do you read the HDB prewar flats in
Tiong Baru, which was under Conservation status built in 1967