Mind The Gap: Analysing The Price Gap Between New Launch And Resale For 22 Districts
March 26, 2020

I’m sure many of you would have seen the latest article from the Business Times stating that the price gap between resale and new launch condos has widened to 40% in 2019.
In other words, new condo prices have risen faster than resale condos in terms of per square foot prices.
Seeing as how there have been so many new launches in the past year or so – can we really say that this is a surprise?
Based on overall numbers for the whole of Singapore, this gap has been steadily increasing since 2017 to the current 40% peak in 2019.
This then raises the question – will the new property prices set lead to the resale condo market possibly appreciate to close the price gap in the future?
As always, let’s take a look at an example.
Tanglin Regency vs Echelon
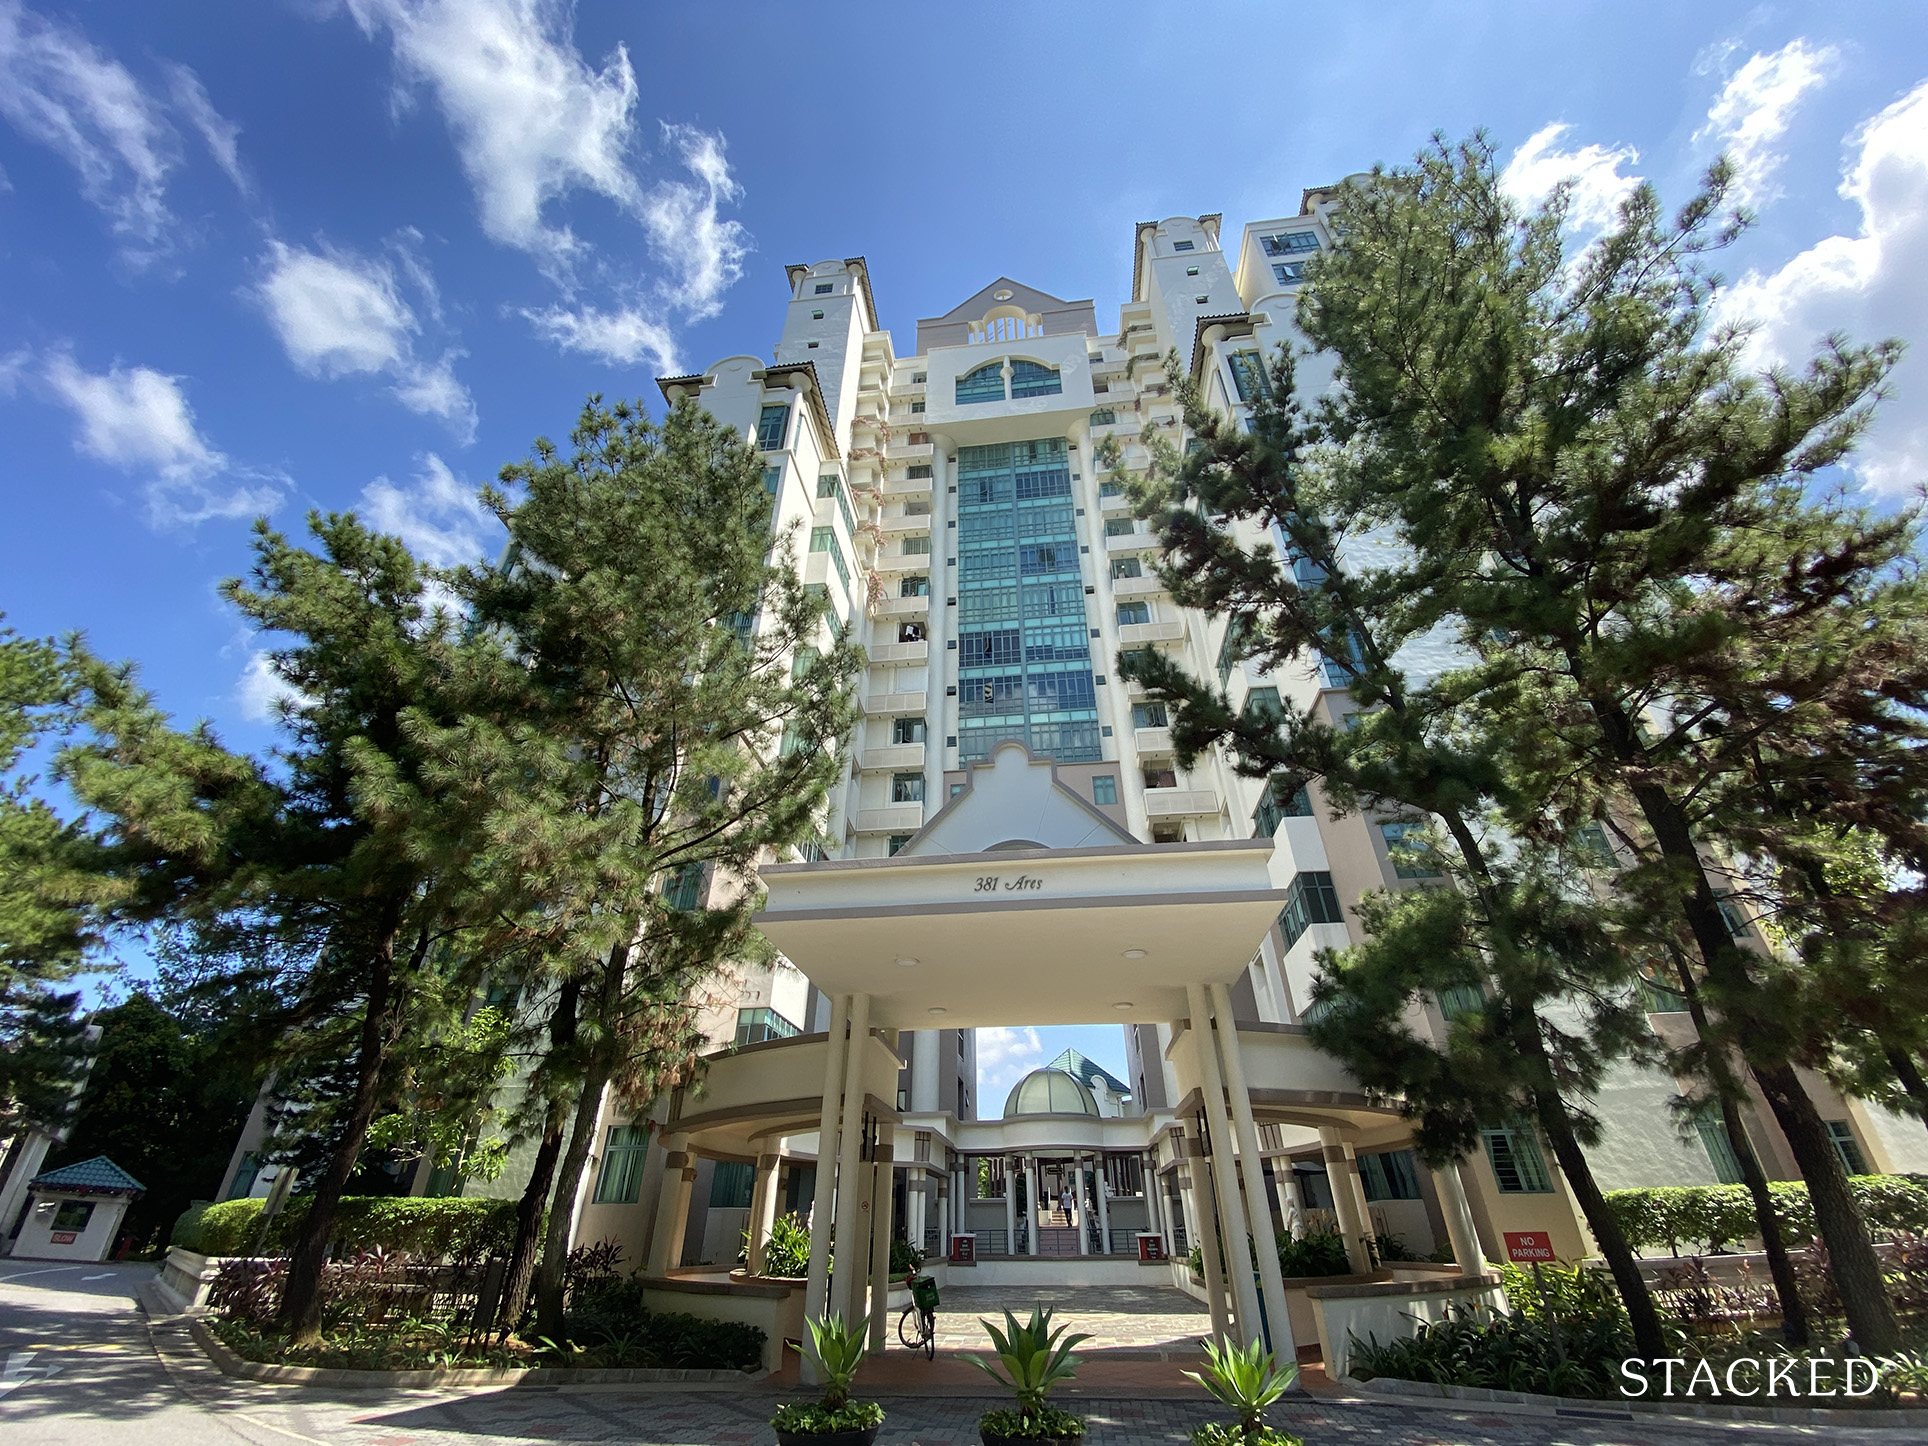
Tanglin Regency has been around since 1994, while Echelon was launched in 2013 and completed in 2016.
In this case, they are both situated really close to each other – being separated by just Alexandra Road.
Both are leasehold properties and at the time of the Echelon launch in January 2013, it was selling at an average of $1,795 psf.
In contrast, Tanglin Regency was hovering at around $1,000 psf – this represents a price gap of around $700 plus psf.
Since then, Tanglin Regency has actually appreciated to close that gap with its current average of $1,584 psf – while the Echelon is at $1,938 (new gap of $354).
Of course, there were other new launches in the area at that time too, like the Crest, Principal Garden, Artra, and the Alex Residences that has helped propped the price up.
But you get my point.
Seeing as this is just one example – I figured this would be a good opportunity to see if there are any other such price gaps that could represent a possible resale appreciation.
It’s hard to tell with an overview of the entire market – so I’ve decided to delve further and look at the numbers by districts instead.
Let’s get to it!
District 1
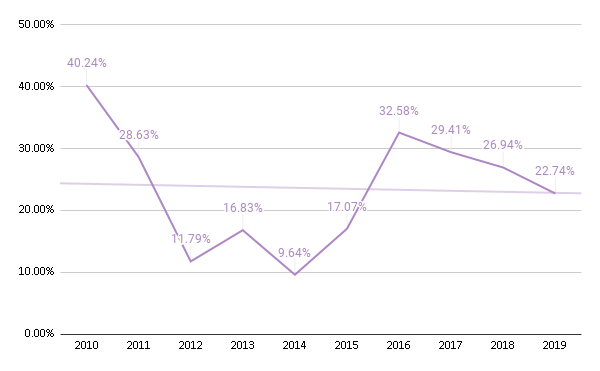
Based on the trend line, the price gap between resale and new launch condos has actually been decreasing – with its highest peak being 40.24% difference in 2010. One reason I can attribute to the decline is a lack of new launches in the area other than Marine One Residences.
Moving forward, you can expect this gap to increase given the abundant subplots of land around that have yet to be released.
District 2
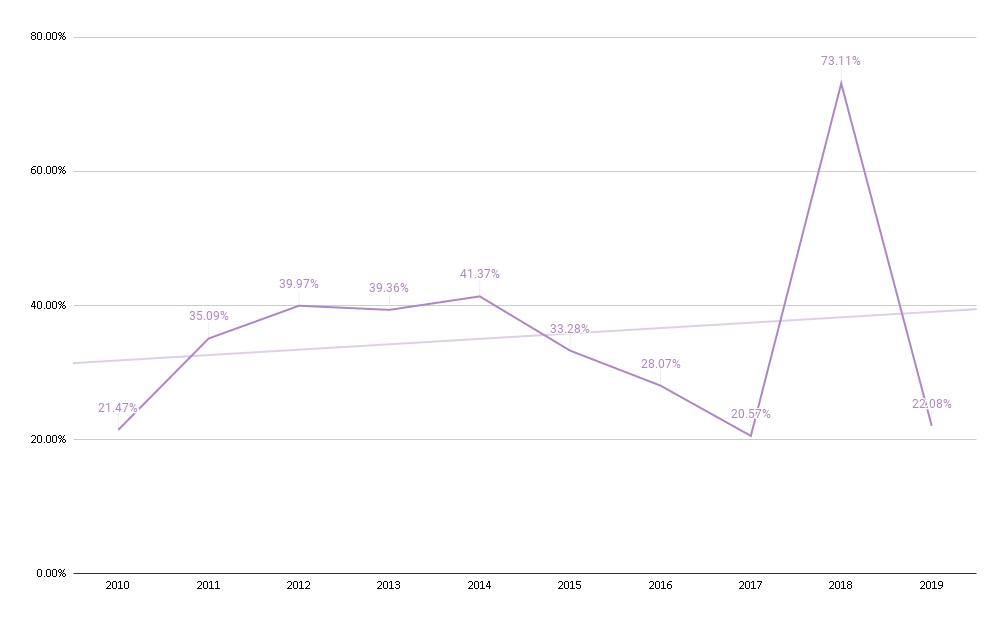
District 2 has been trending up (mostly because of the outlier in 2018) but given that there was a dearth of new launches in the area since end 2014, it’s no surprise to see the price gap start to close up.
For those wondering about that crazy spike in 2018, it can be solely attributed to the sales from Wallich Residence, where a unit had gone for as high as $4,560 psf. It has since dropped to a 22.08% average price gap in 2019 – a number that is in line with District 1.
District 3
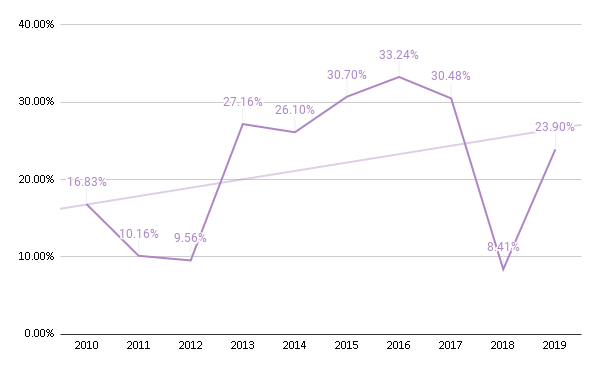
District 3 has been on the uptrend especially since 2013 – a period where many of the condos were launched (Echelon, Alex Residences, Commonwealth Towers etc). This caused the price gap to reach a high of 30.48% in 2016.
The drop in 2018 to a price gap of just 8.41% was actually due to the resale condos starting to appreciate in price – which was exactly what happened to the example in the introduction with Tanglin Regency.
District 5
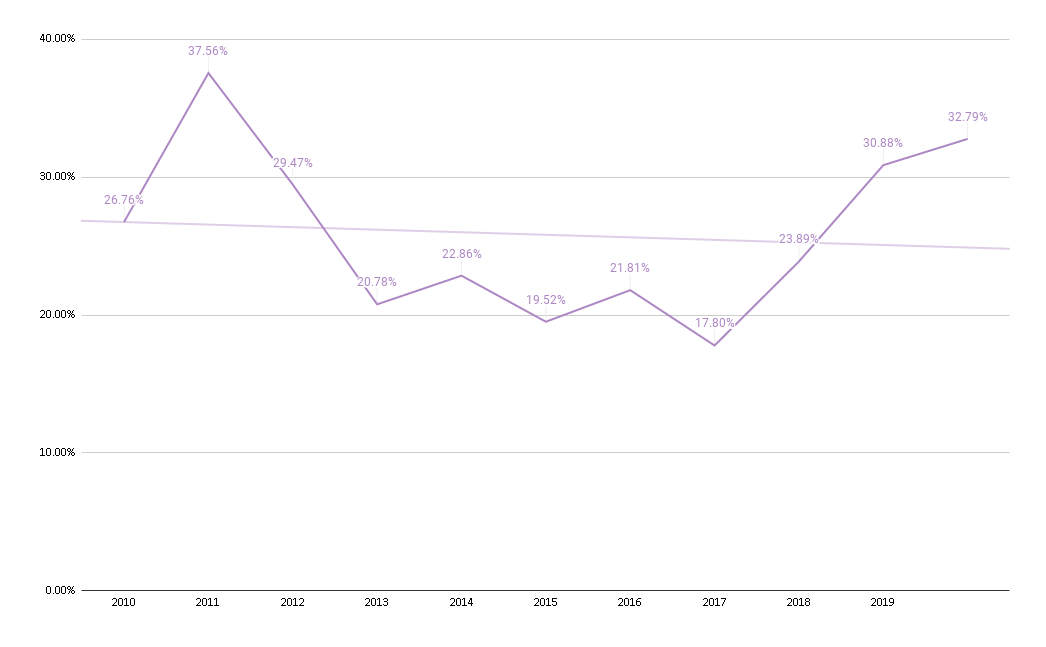
District 5 has actually quite stable price gaps, other than the peak in 2011 of 37.56%. Since then, it has gone through a lull period, with things only picking up from a new launch perspective from 2017 onwards. This is because of new launches such as Twin Vew, The Verandah Residences, and the Clement Canopy.
District 7
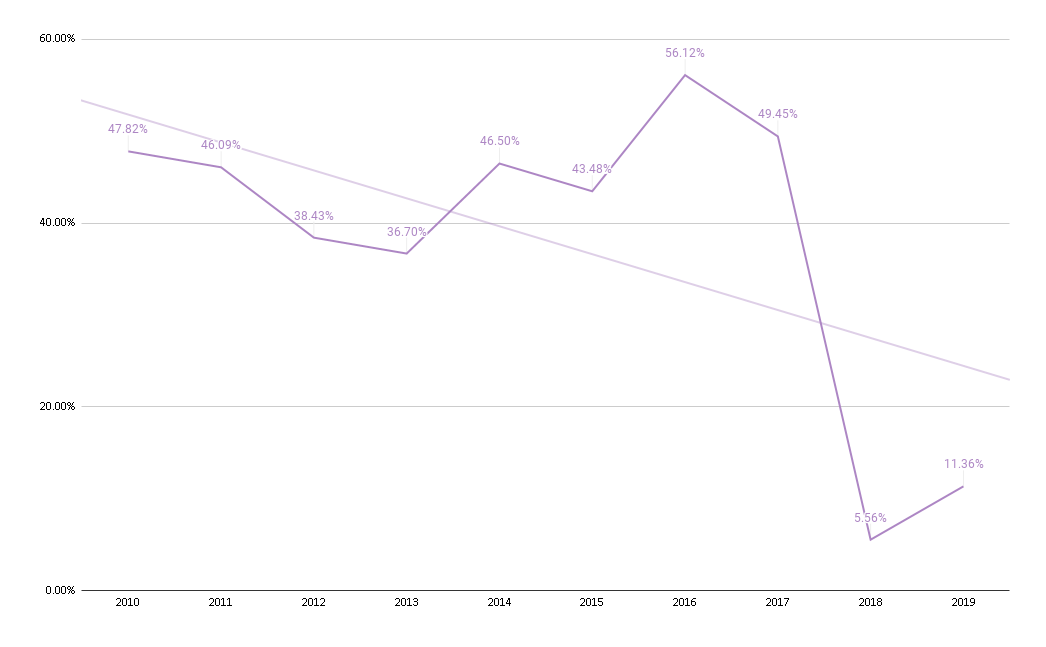
As can see from the graph, District 7 has had a huge price gap of 47.52% that has gone up to a peak of 56.12% in 2016.
There were never many resale transactions to begin with in the earlier years – with many of the resale developments like the Plaza and the Textile Centre holding leasehold tenures from as early as 1968.
So it was with new launches like the Concourse Skyline and Duo Residences that really pushed the prices up, resulting in the price gaps that you see in the graph.
That said, the price gap is clearly on a downtrend as the last two years have resulted in only a 5.56% and 11.36% price gap respectively. This is because as developments like Concourse Skyline and Duo Residences started to go on the resale market – this made the price gaps narrower despite the crazy appreciation of the district as a whole.
District 8
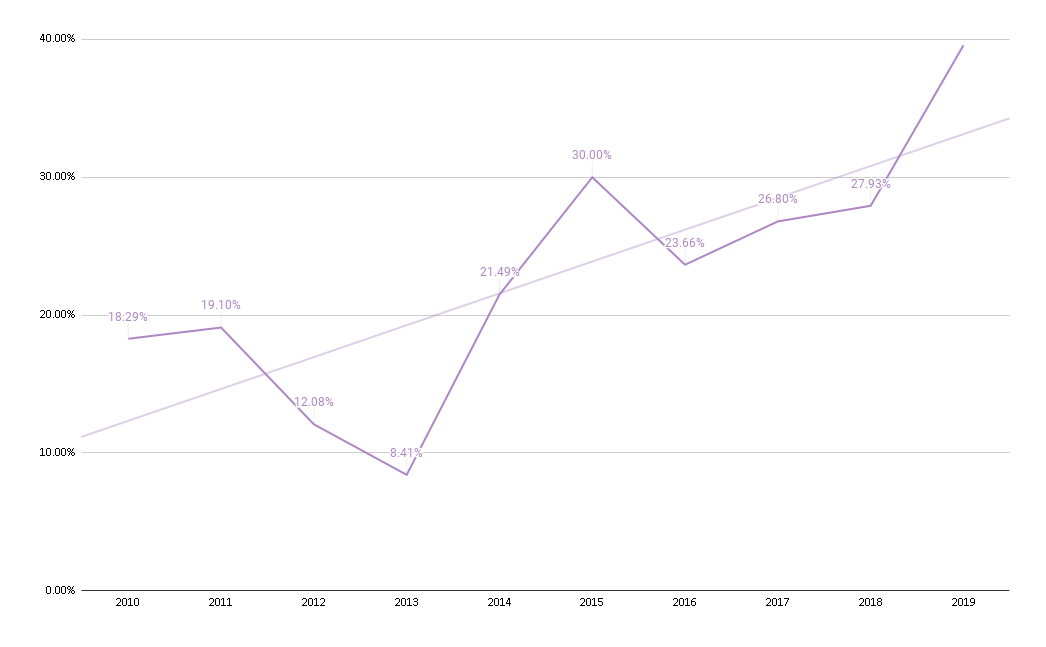
District 8 has one of the biggest uptrends that you’ll see on this list – with 2019 being the highest in the past ten years at 39.58%.
The price gap in the recent years can mainly be attributed to new launches like Sturdee Residences and Forte Suites.
District 9
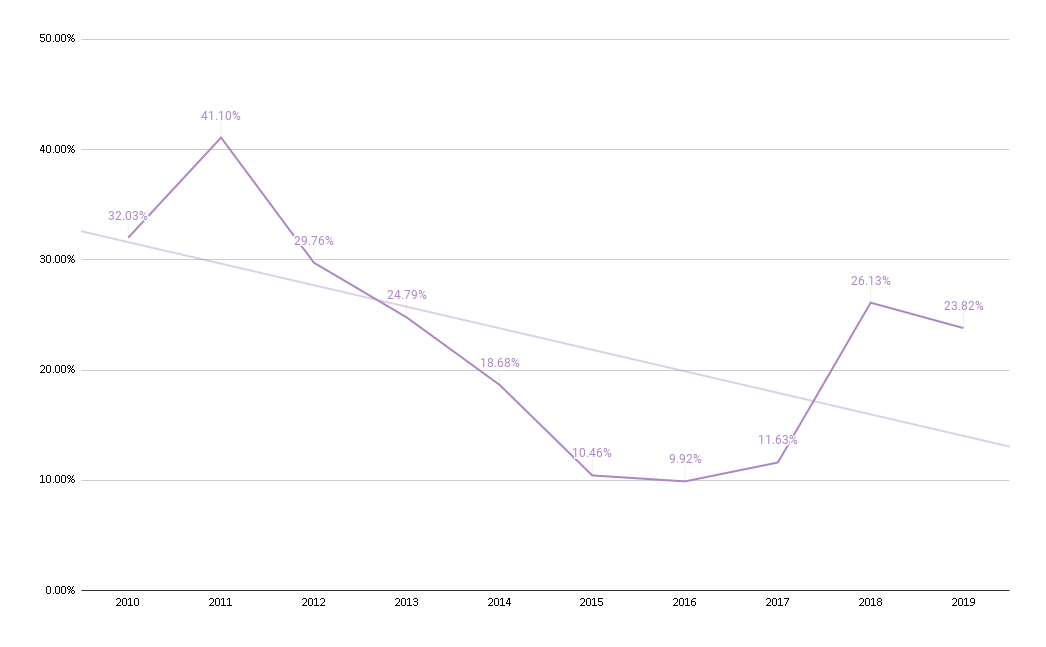
District 9 is on a downtrend since 2010, with its peak of 41.1% occurring back in 2011 because of many new launches in 2010/11. From 2014 to 2017 the price gap between condos and new launch has been very close despite launches like Cairnhill Nine and Martin Modern.
This is because traditionally District 9 has always had a strong pull in terms of residential – both for own stay as well as for rental. So resale prices there have actually held and appreciated quite well because of constant new launches throughout the years.
District 10
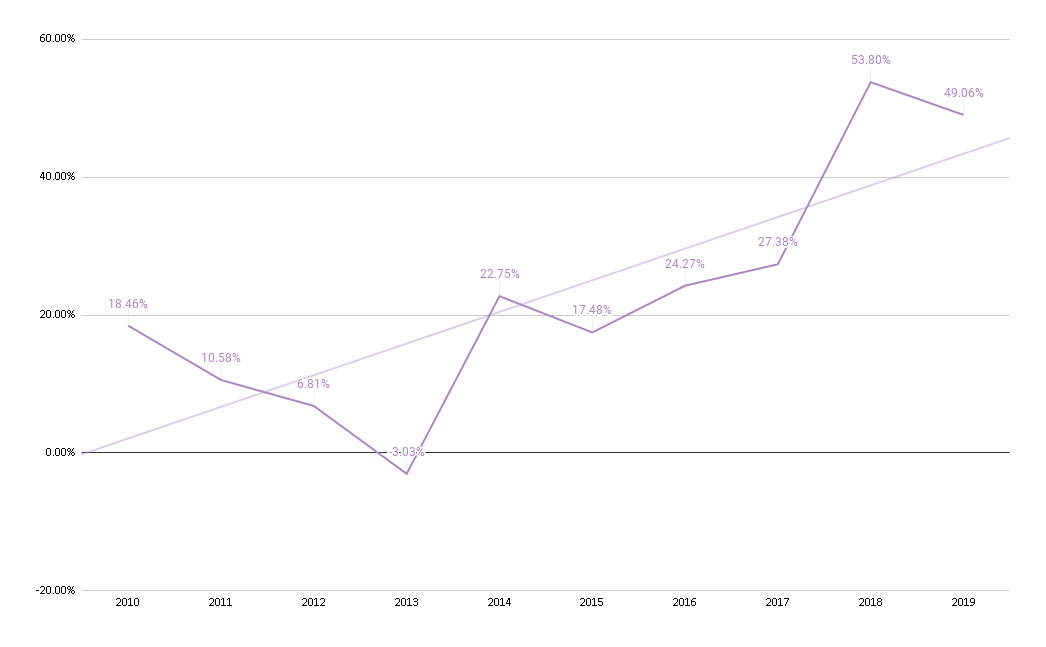
District 10 has seen quite a constant pick up in terms of the price gap between resale and new launch, despite a dip in 2013. This was caused by a dip in new launch prices as well as an increase in resale prices. In fact, average resale psf prices for the year actually surpassed the new launch prices. This can be part attributed to the launch of the 1,715 unit D’leedon – which was one of the few leasehold projects amongst the freehold, thus bringing the average prices down.
But as you can see, prices since 2017 have shot up to a price gap high of 53.80%. Of which you can credit to new launches such as 3 Cuscaden, Boulevard 88, and One Holland Village Residences.
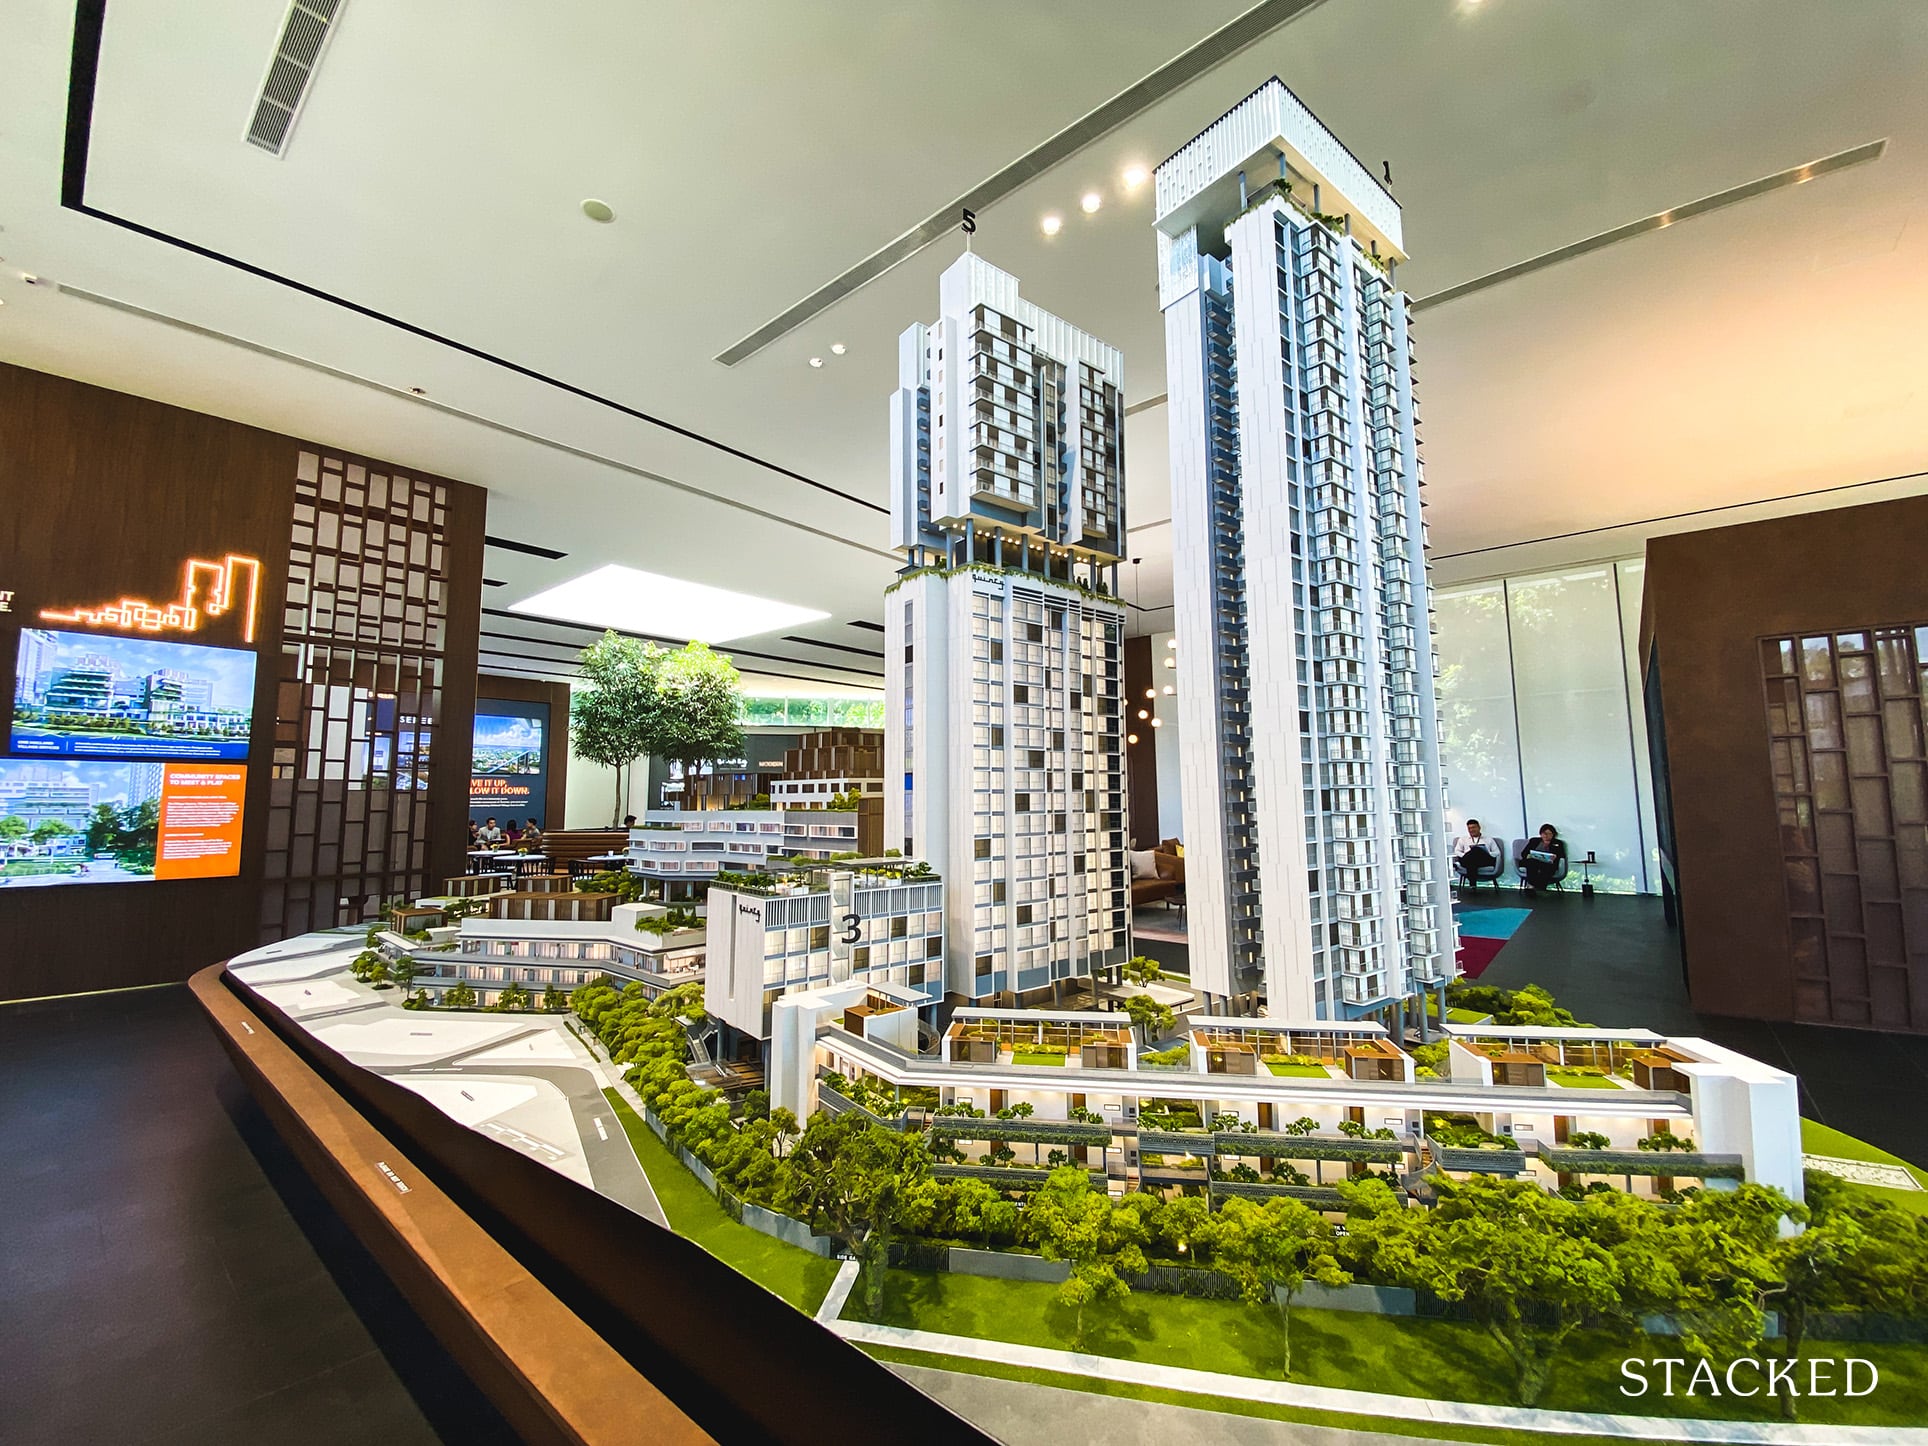
New Launch Condo ReviewsOne Holland Village Residences Review: Best Located New Launch In Holland
by Reuben DhanarajDistrict 11
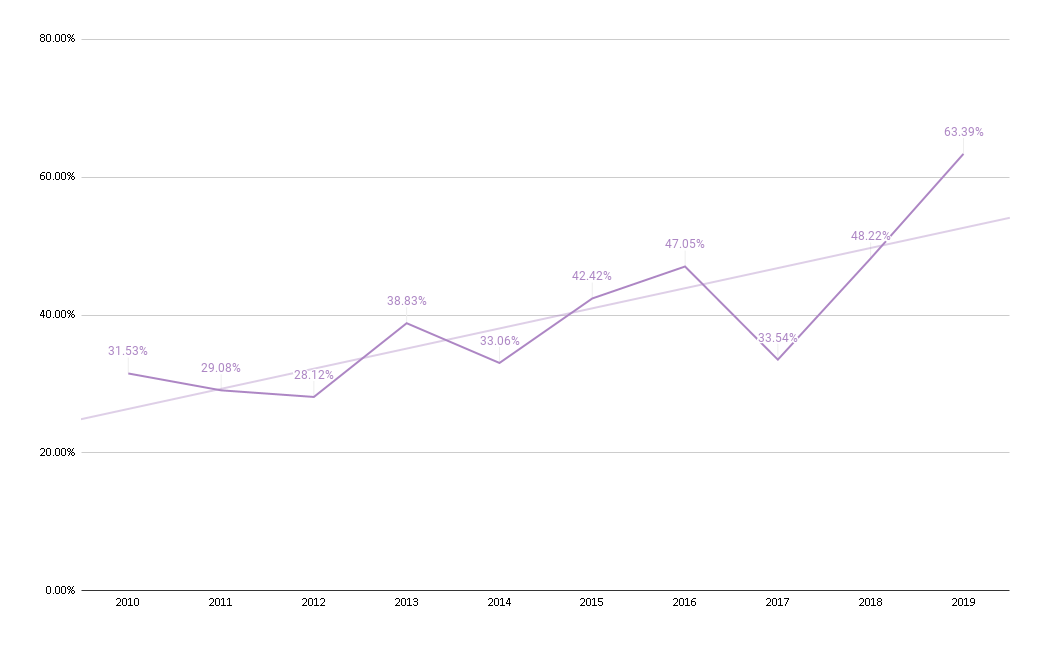
Since 2010, District 11 has one of the higher average price gaps on this list at 39.52%. Majority of the new launch sales actually occured between 2010 to 2014, with developments like 6 Derbyshire and 26 Newton holding the fort for new launch prices up till the spike in 2018 and 2019.
Since then, new developments such as Neu at Novena, 35 Gilstead, and Fyve Derbyshire have really pushed the prices in the area up – reaching a high of 63.39% in 2019.
District 12
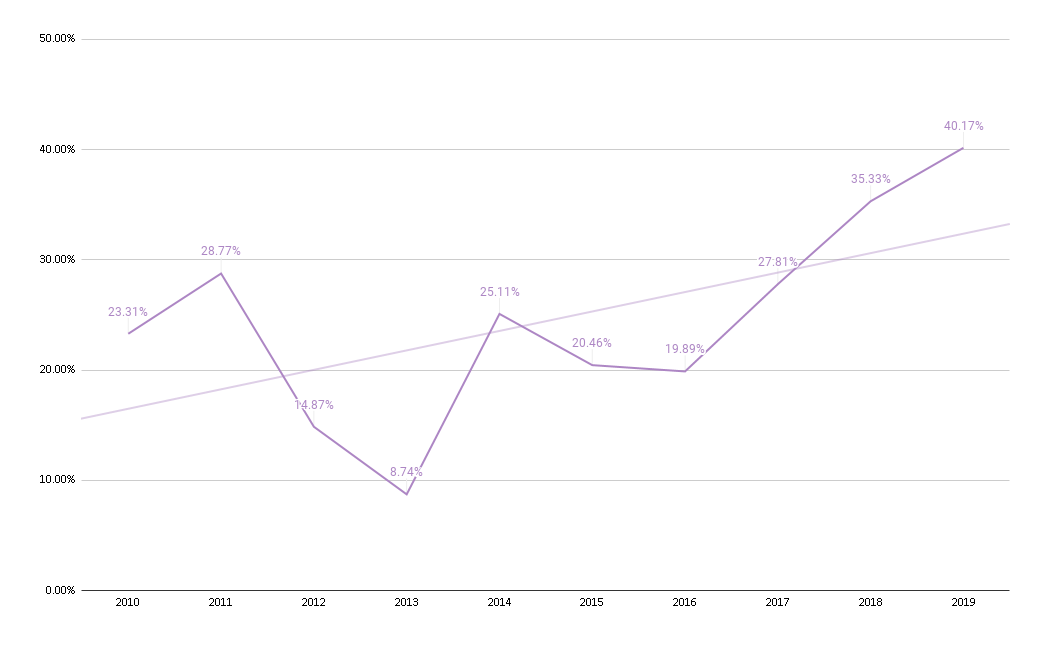
District 12 had a big dip in 2013, with the average price gap for the year reaching a low of 8.74%. This can be partly attributed to a drop in new launch transactions as compared to the preceding few years – resulting in stagnant prices. On the other hand, average resale psf prices had been going up, reaching a high of $1,298.93 psf in 2013.
The price gap has been steadily increasing since 2016 because of the launch of Gem Residences. And that has continued to grow, reaching a high of 40.17% because of developments such as 1953 and Jui Residences.
District 13
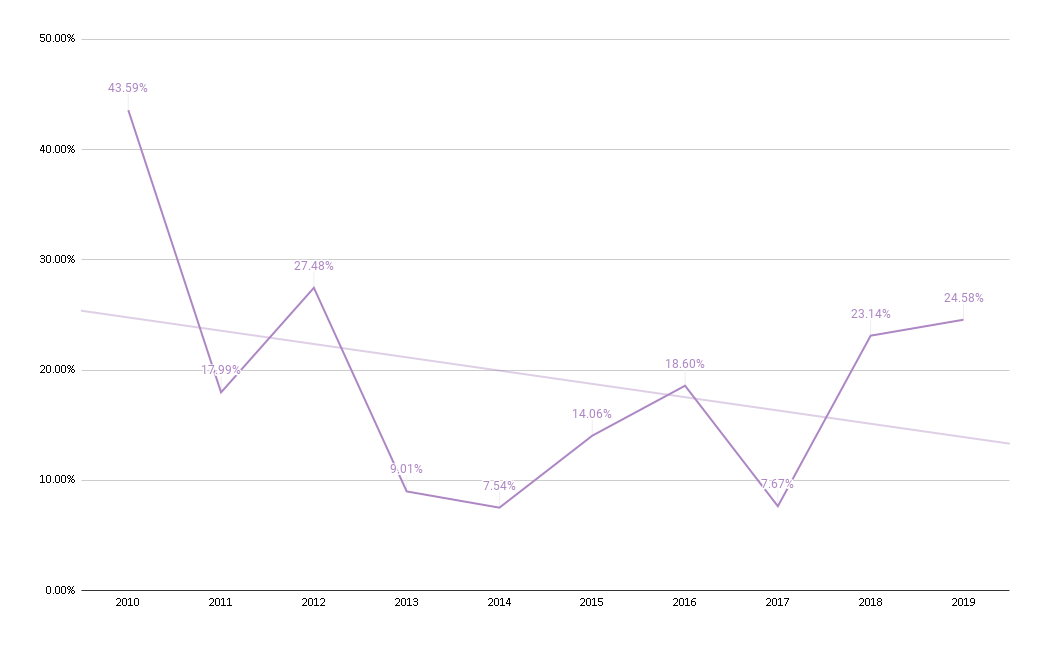
District 13 has a price gap trend that has been decreasing to its current price gap of 24.58%. It actually has the second lowest average price gap over the past ten years, at 19.37%.
More from Stacked
This Freehold New Launch Condo In The CBD Is Launching From Just $1.29M
City Developments (CDL) will preview its mixed-use development Newport Plaza on Friday, Jan 16. Sales bookings for the 246 luxury…
However, the data here is skewed because actual resale transactions have been very low, with periods from 2013 to 2015 only clocking in single digit resale transactions per month.
A major bulk of the transactions have been going to new launches, with launches in 2013 like Bartley Ridge and Sennett Residence. From 2018 the new launch scene has been dominated by projects like The Tre Ver and Park Colonial.
District 14
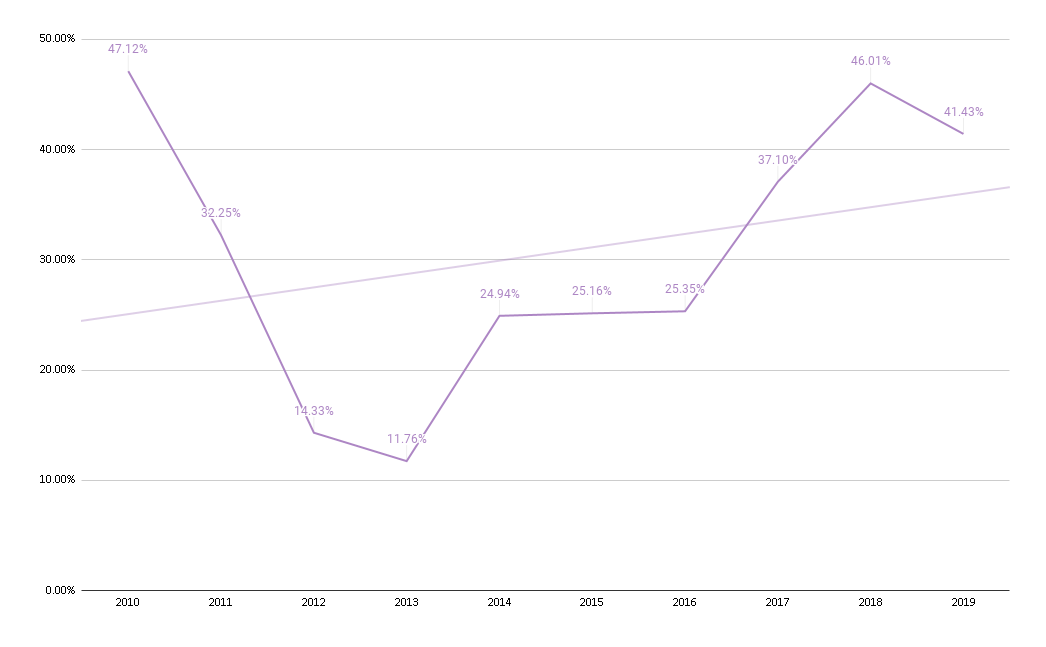
District 14 had a high of 47.12% in terms of price gap between resale and new launches in 2010. This was partly to do with a number of new launches – with Waterbank at Dakota being a major one.
The price gap dropped to a low of 11.76% in 2013 because resale prices had appreciated to a new high back then. But since then, the price gap has widened to a high of 46.01% in 2018. This can be assigned to new launches like Parc Esta, Sims Urban Oasis, and Park Place Residences at PLQ.
District 15
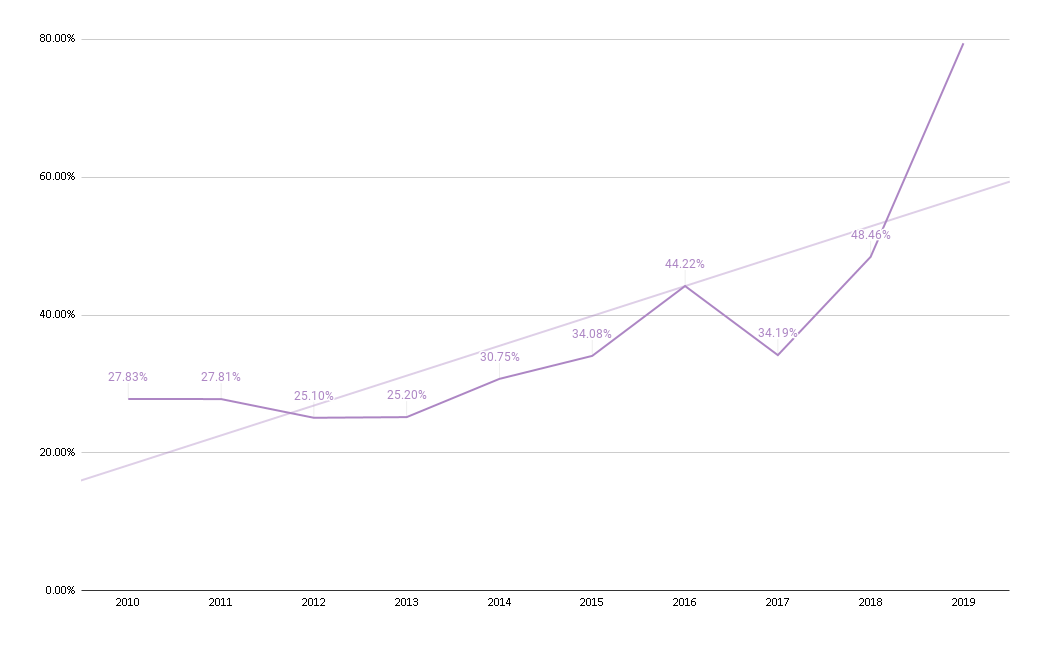
District 15 has the “honour” of being the district with the widest price gap, with 2019 reaching a high of 79.45%. The appreciation for resale condos has been a slow but steady one – so the main attributing factor is the explosion of new launch prices in the area. Some of the big recent new launches include Seaside Residences and Amber Park.
Just to give you an idea of the absolute numbers – in 2019, the average psf for resale condos was at $1,315.79, with new launch projects hitting a high of $2,361.19. That’s an average price gap of $1,045.40! This makes District 15 the likeliest district to have its resale condos appreciating to narrow that gap.
That said, the numbers here could be a little skewed given that District 15 does contain many units that have larger than average unit sizes.
District 16
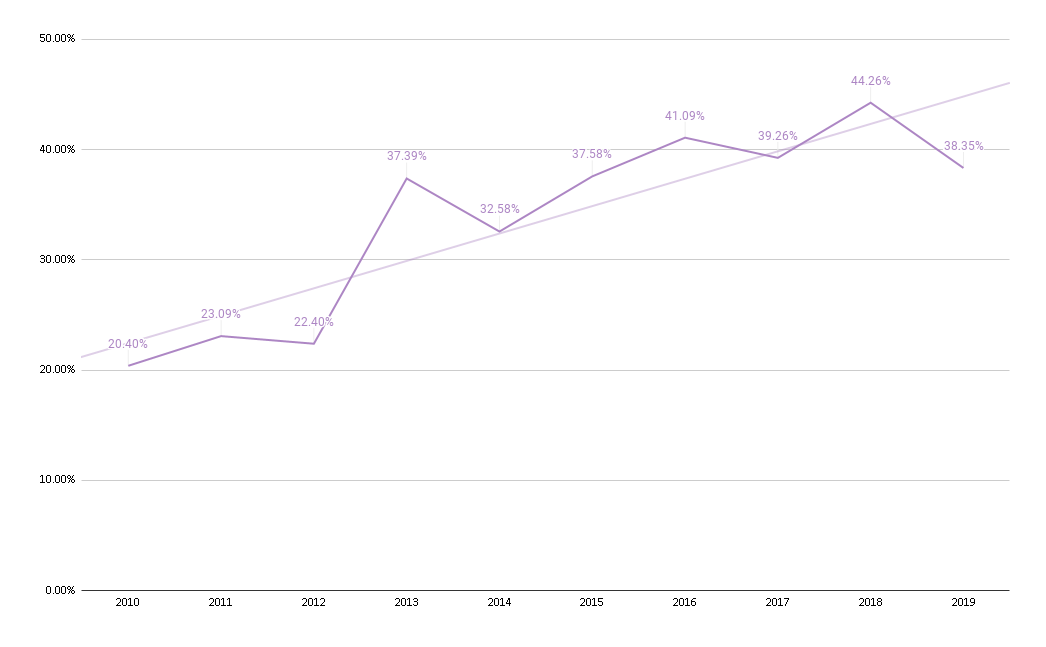
District 16 had its biggest price gap jump from 2012 to 2013 as there were many new launches in the area – Bedok Residences, Archipelago, Eco, and Urban Vista.
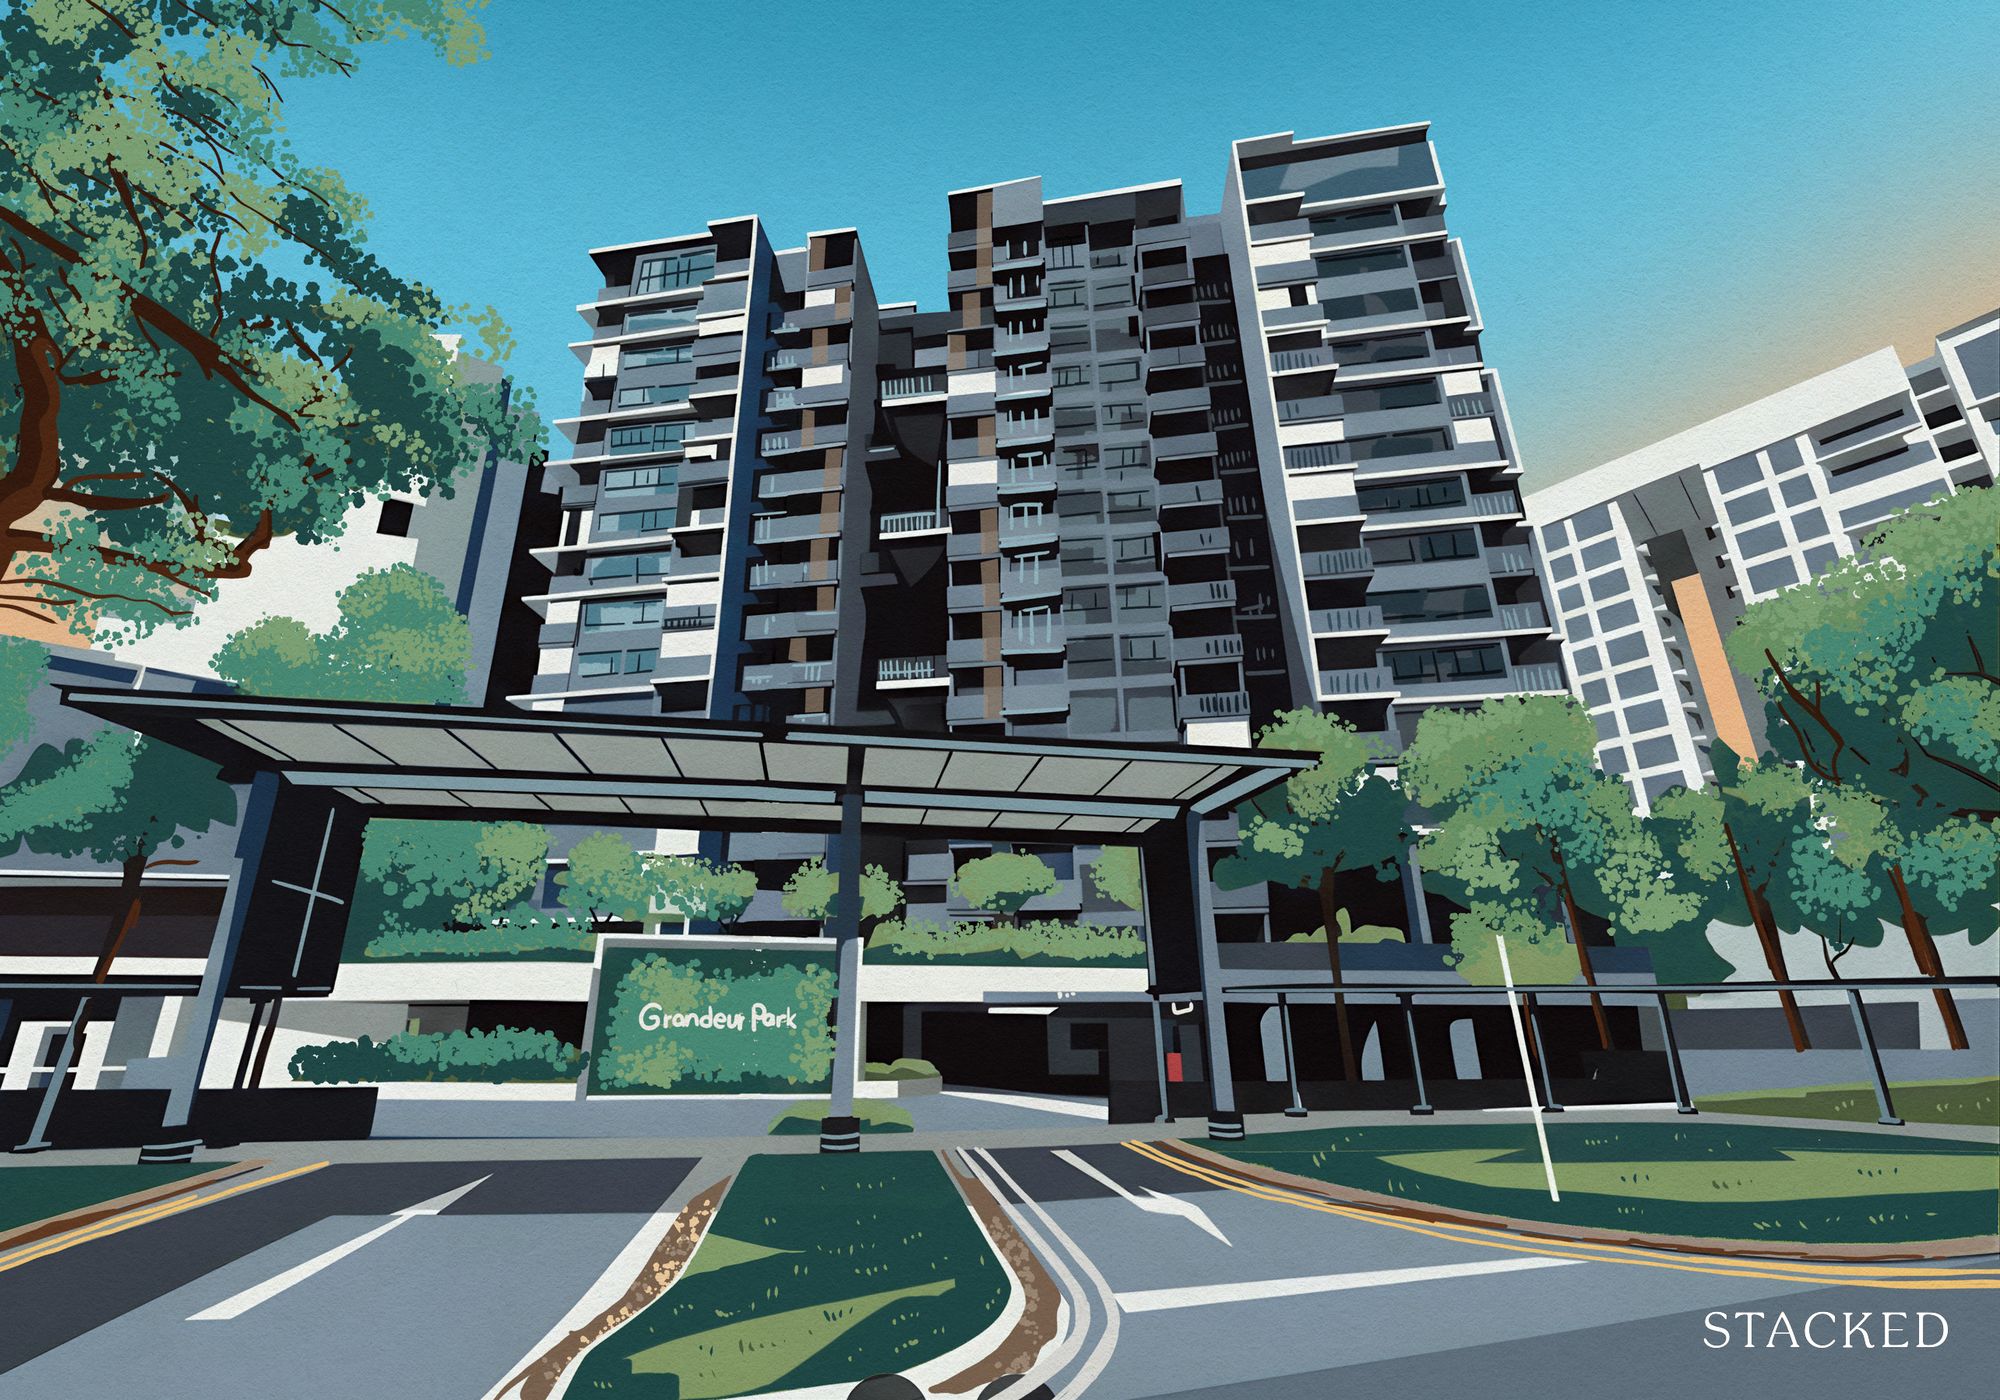
After a slight dip in 2014, that uptrend has mostly continued, hitting a high of 44.26% in 2018 which was mainly because of the launch of Grandeur Park Residences in 2017.
2019 has had very few new launch transactions so far, which has seen the gap start to get closer. As there are no planned new launches in 2020 for District 16 this is likely to narrow further.
District 17
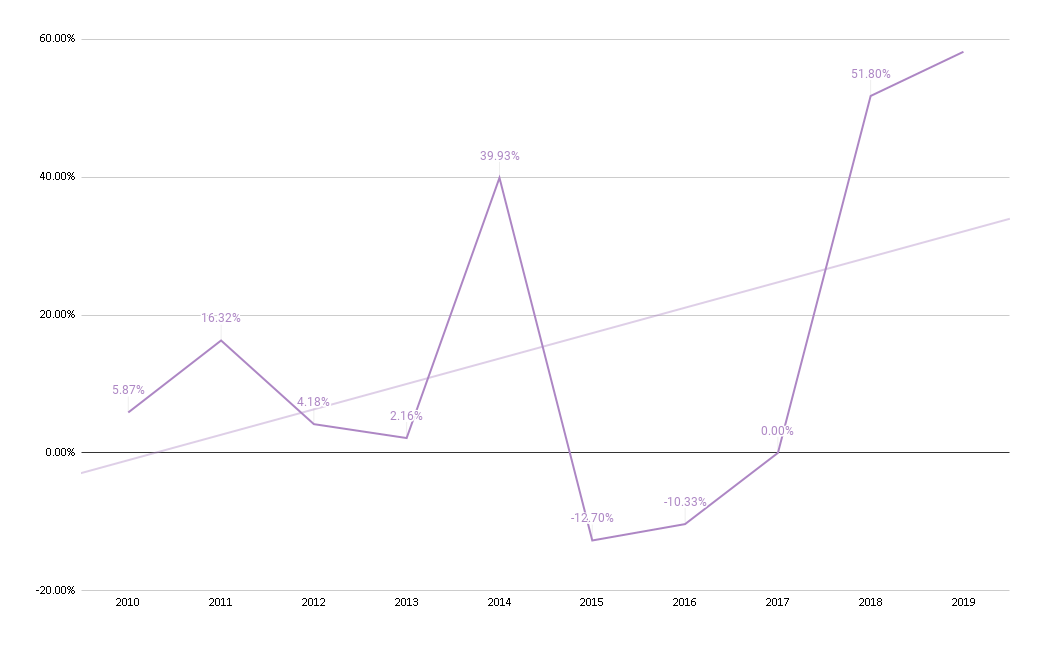
District 17 has had big variations in the price gap over the past 10 years – but it actually has the lowest average price gap psf of only 15.54%. The sudden rise in 2014 to 39.93% can be explained mainly by the launch of Ocean Front Suites, as its small units have really raised the average new launch psf in the area.
However, the price gap was at a negative figure the following years because of a lack of new launches in the area – with zero transactions in 2017. This has also partly caused the resale condo prices over the same period to stagnate.
But this has widened significantly since 2018, reaching a high of 58.21% in 2019 – primarily because of new launches like Parc Komo, The Jovell, and Casa Al Mare.
District 18
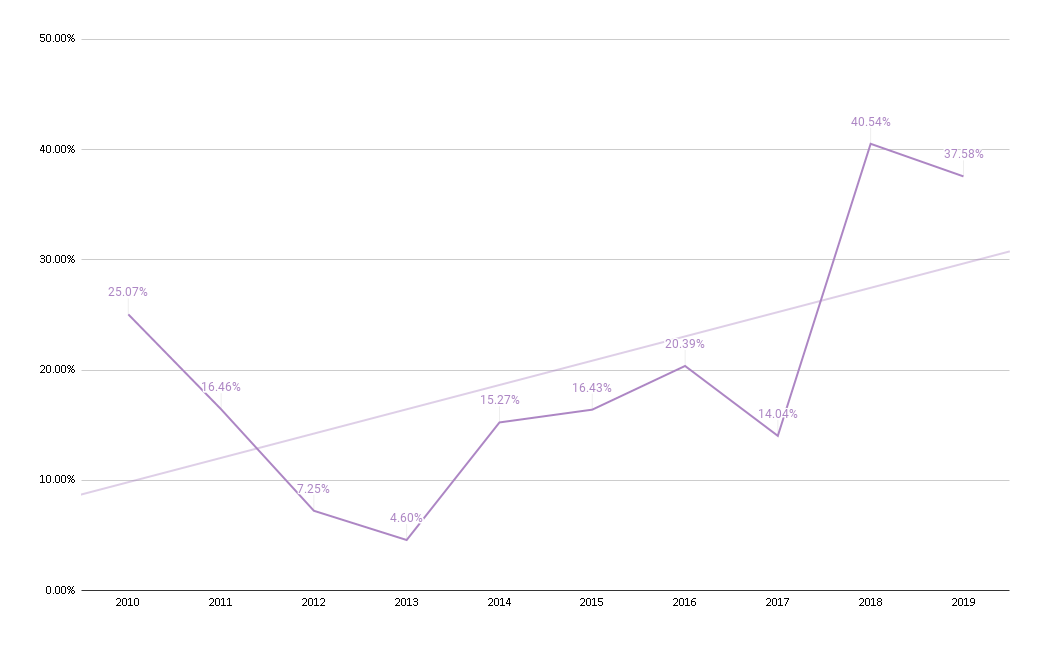
With the exception of 2010, the price gap in District 18 has been quite minimal up till 2017. In fact, in 2012 and 2013 the average price gap was at only 7.25% and 4.6% respectively. This can be explained by the majority of transactions in those years being of the new launch variety, with very few resale transactions to make a proper comparison.
That said, that gap has widened since 2018 to a high of 40.54%, mainly because of new launches like The Tapestry and Treasure @ Tampines.
District 19
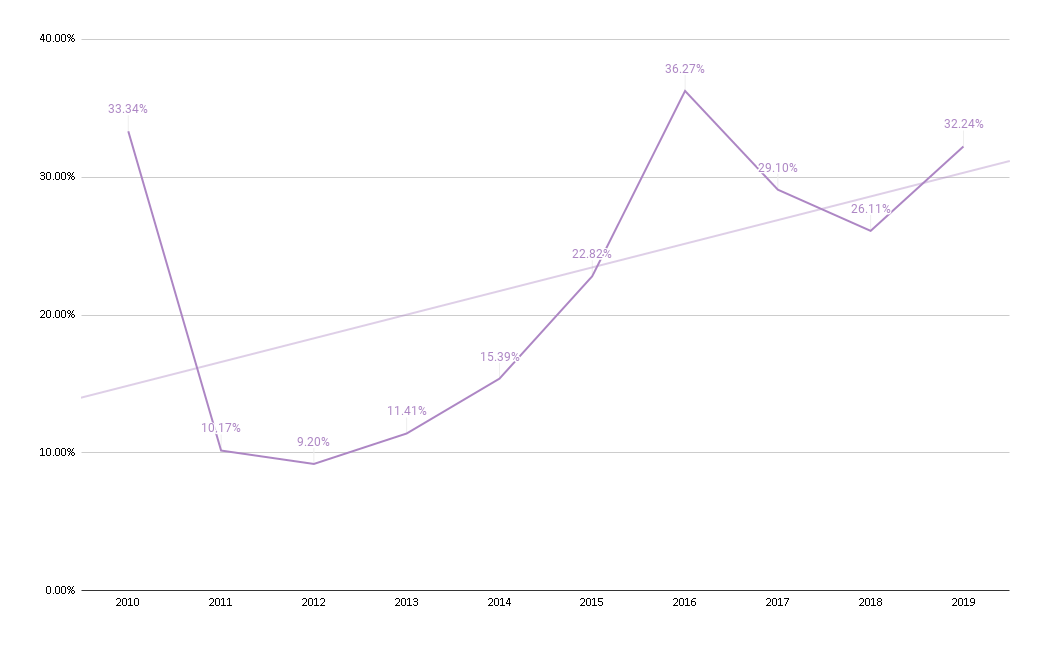
District 19 has had a constant influx of new launches since 2010, with notable ones such as Kovan Regency, Riversails, and La Fiesta. In fact, new launch sales dominated more than 50% of the sales up till mid 2017 where you can see more resale transactions start to come up on the market – contributing to the narrowing of the gap up till 2018. The widest gap was in 2016, at a high of 36.27%.
District 20
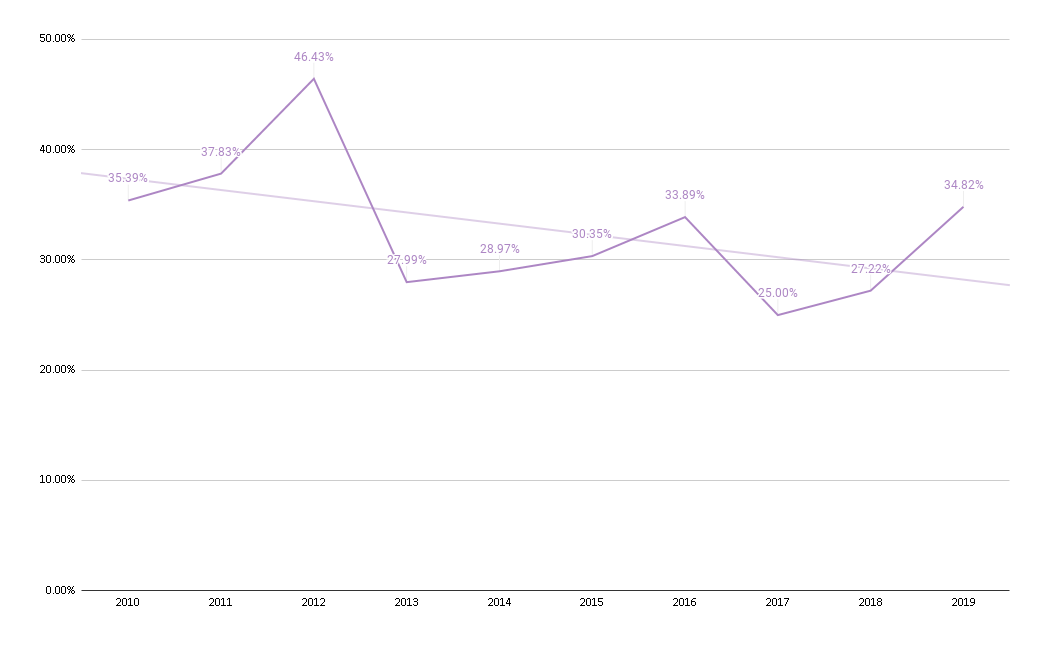
District 20 has been on the downtrend since its highest average price gap peak of 46.43% in 2012. Since then, it has hovered between a 20-30% average price gap range.
District 21
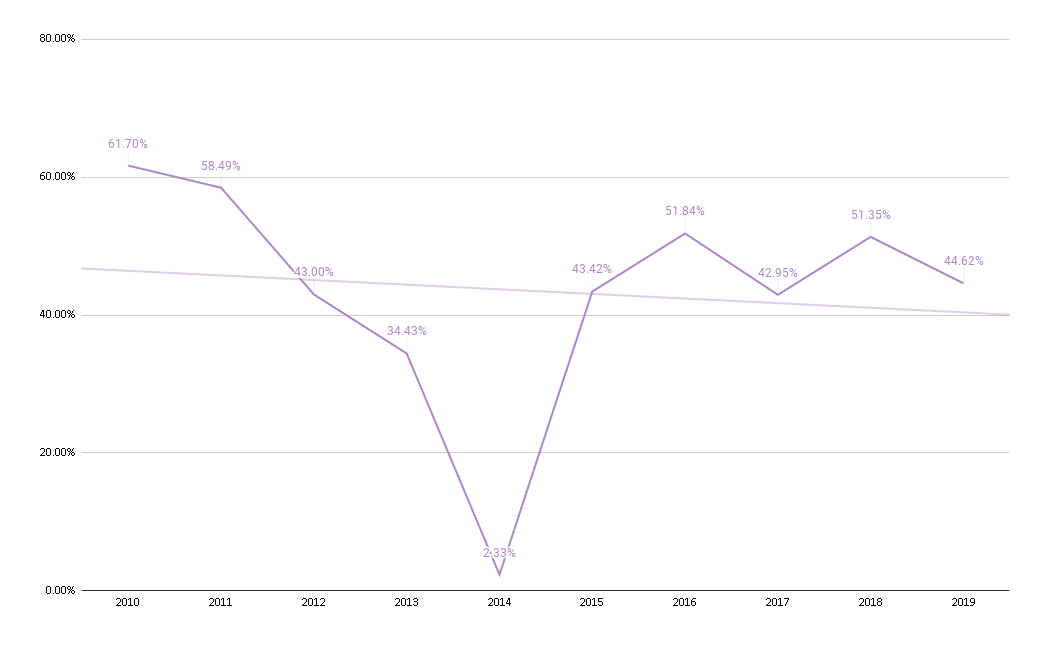
District 21 actually has the highest average price gap over the past 10 years, at 43.41%. It could have been even higher, save for the steep decline to just an average difference of 2.33% in 2014. This can mainly be reasoned through the many transactions of the 60 years leasehold Hillford (the cheapest condo in Singapore for 2019), which brought down the average new launch psf.
Since then, new launches like Daintree Residence and Mayfair Gardens have brought the price gap back to an average of about 40%.
District 23
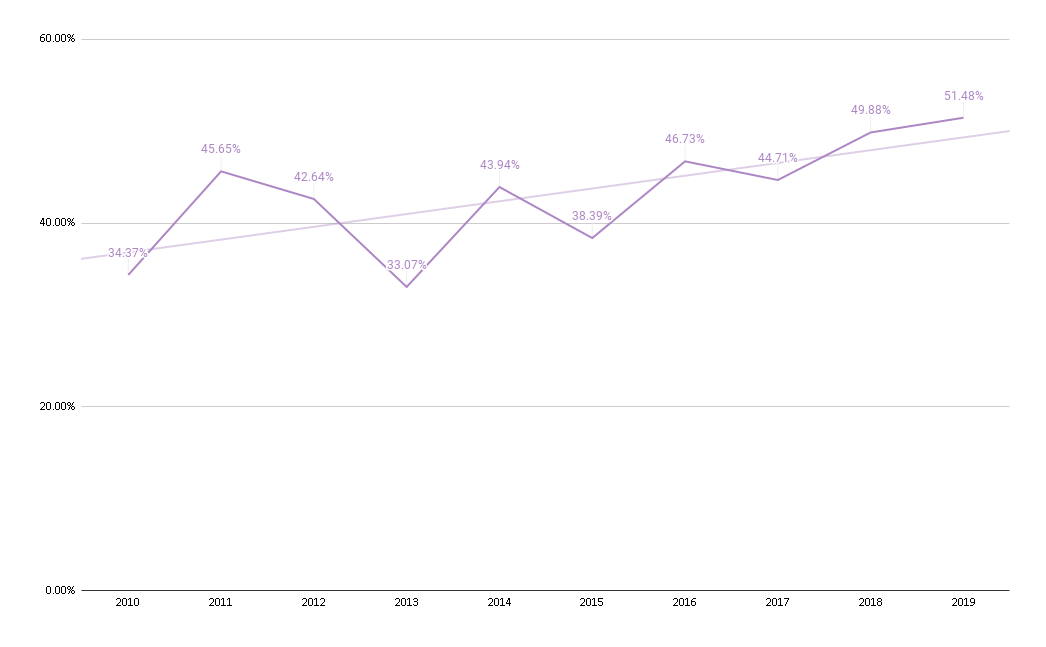
District 23 has the second highest overall price gap average on this list, at 43.09% over the last ten years. It has been on the uptrend ever since 2010, with the highest peak at 51.48% in 2019 – primarily because of new launches like Dairy Farm Residences, Mont Botanik Residence, and Midwood.
District 27
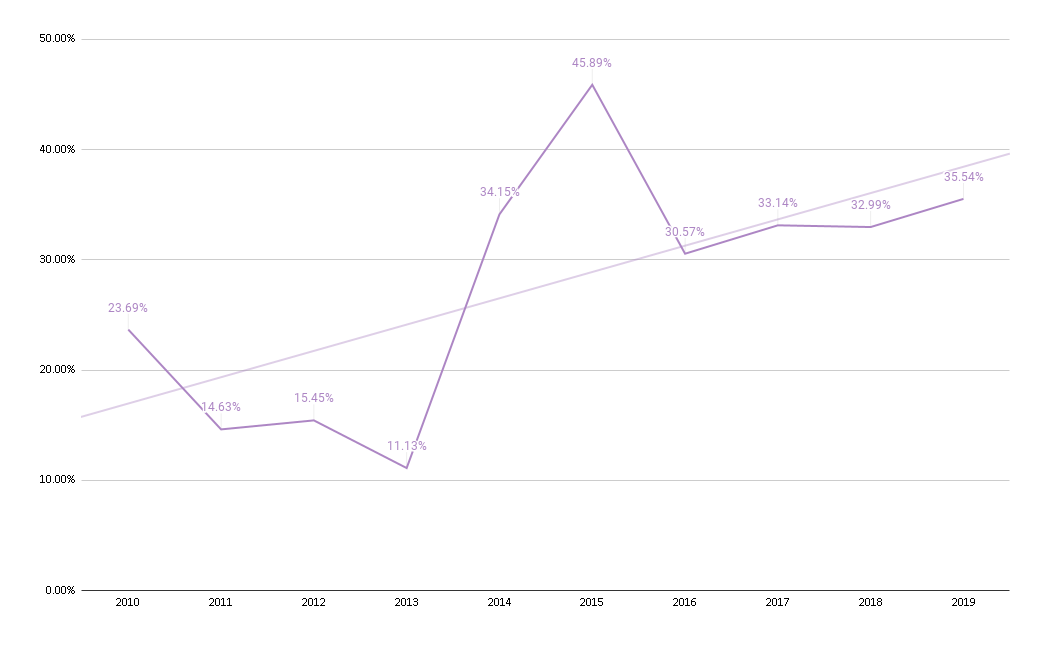
District 27 has an average psf price gap of 27.72% in the past ten years. Its highest peak was in 2015 at 45.89% that can mainly be attributed to the launch of North Park Residences.
District 28
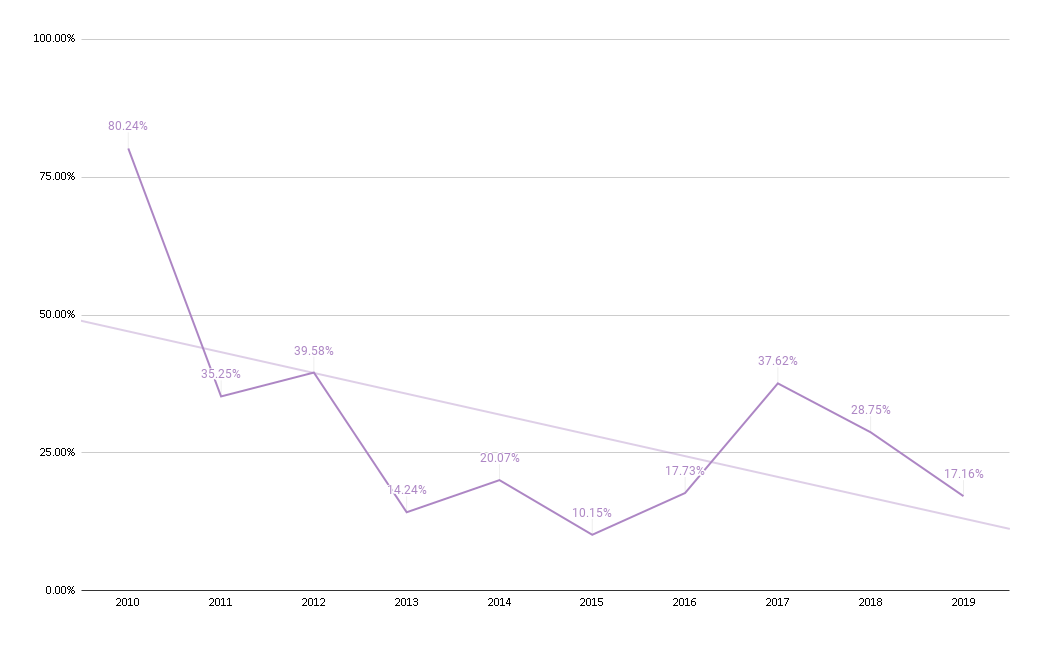
District 28 had a seemingly huge price gap in 2010 of 80.24%, although it would be easy to point to the launch of the Greenwich – it was more so because of the lack of resale transactions in the area.
The launch of High Park Residences in 2015 was a contributing factor to the rising price gap in 2016 and 2017 – but again, because there really isn’t many resale transactions to compare to it would be unfair to come to any sort of conclusion here.
Conclusion
For the eagle-eyed among you – you might have noticed that District 4, 6, 22, 25, and 26 are missing in action. This was purely because of a lack of new sale transactions in certain years, so there wasn’t any point in making any comparison there.
The gap actually widened more significantly from 2010 onwards because of the trend of smaller living spaces and shoebox units. But since the introductions of measures to limit the downsizing of units, you may start to see a smaller influence on the price gap between new sales and resale condos in time to come.
At the end of the day, looking at the price gap from a district level can go some way into helping you sieve out certain opportunities. That said, it is also important to remember that there are numerous factors involved in choosing a development, and solely judging a property by its psf isn’t the ‘be all, end all‘.
Should you need require any advice or simply would like to enquire about anything with regards to Real Estate, feel free to reach out to us at stories@stackedhomes.com!
At Stacked, we like to look beyond the headlines and surface-level numbers, and focus on how things play out in the real world.
If you’d like to discuss how this applies to your own circumstances, you can reach out for a one-to-one consultation here.
And if you simply have a question or want to share a thought, feel free to write to us at stories@stackedhomes.com — we read every message.
Frequently asked questions
What is the current trend of the price gap between resale and new condos in Singapore?
How does the price gap vary across different districts in Singapore?
Can the appreciation of resale condos help close the price gap with new launches?
What factors influence the fluctuations in the price gap between new and resale condos?
Are there districts where the price gap has been consistently high or low over the years?
Sean Goh
Sean has a writing experience of 3 years and is currently with Stacked Homes focused on general property research, helping to pen articles focused on condos. In his free time, he enjoys photography and coffee tasting.Need help with a property decision?
Speak to our team →Read next from Property Investment Insights
Property Investment Insights This Singapore Condo Has Bigger Units Near The MRT — But Timing Decided Who Made Money

Property Investment Insights We Compared Lease Decay Across HDB Towns — The Differences Are Significant

Property Investment Insights This Singapore Condo Skipped 1-Bedders And Focused On Space — Here’s What Happened 8 Years Later
Property Investment Insights Why Buyers in the Same Condo Ended Up With Very Different Results
Latest Posts
On The Market A 40-Year-Old Prime District 10 Condo Is Back On The Market — As Ultra-Luxury Prices In Singapore Hit New Highs

Editor's Pick Happy Chinese New Year from Stacked

Singapore Property News Nearly 1,000 New Homes Were Sold Last Month — What Does It Say About the 2026 New Launch Market?




2 Comments
Does this mean that the wider the gap, the higher the possibility of resale appreciation in that district? Would there be an updated analysis to take into account 2020 (the impact of the pandemic)?