How Much Does The Unit Mix Matter When Buying A One-Bedder Condo?
October 18, 2024
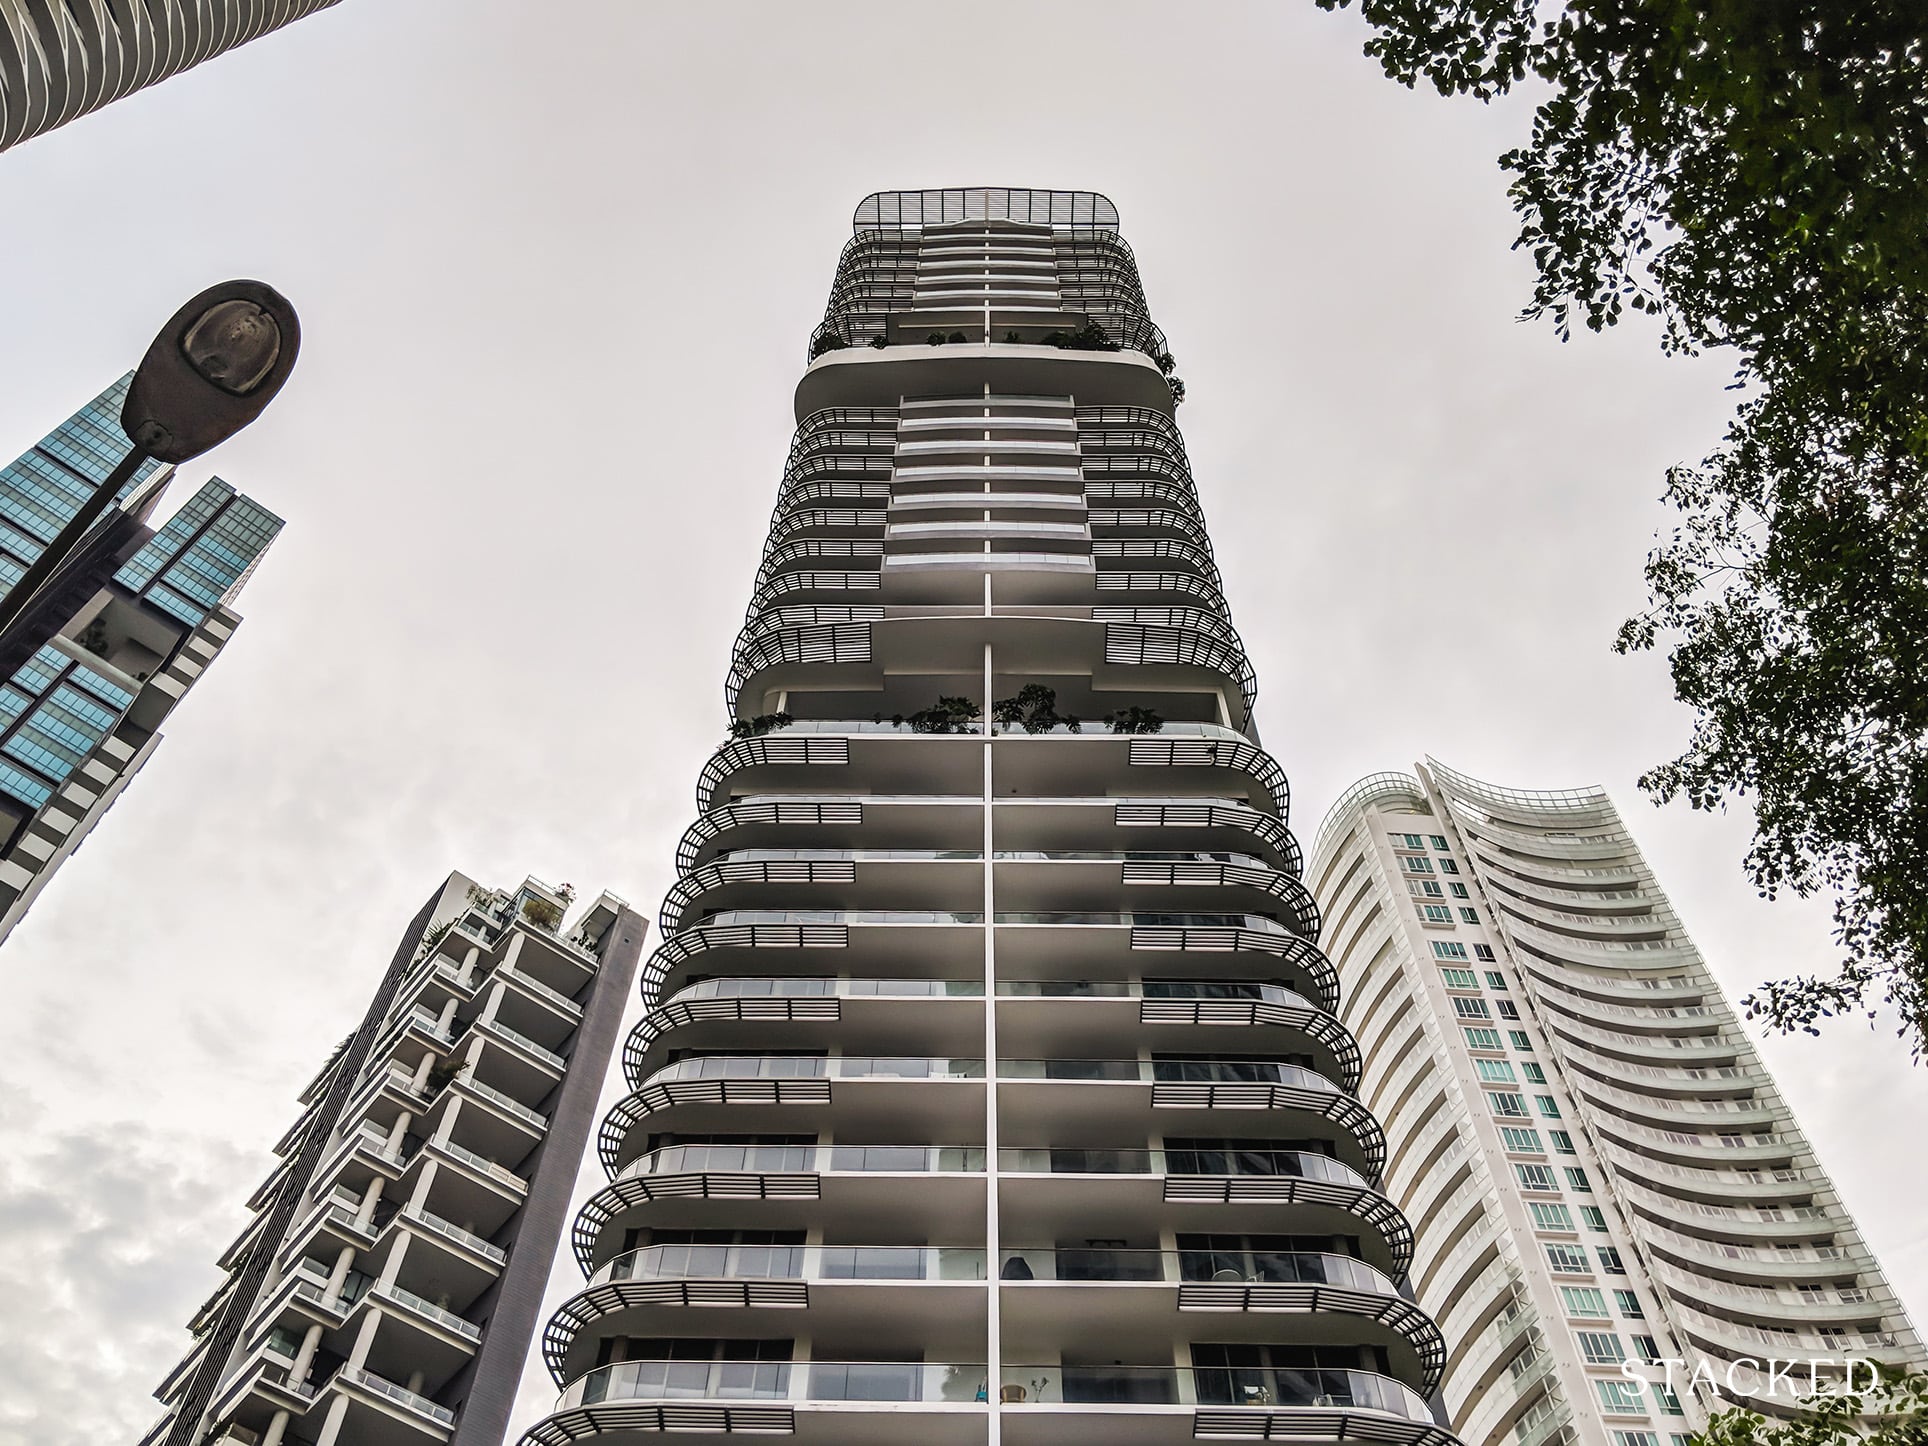
In the Singapore property market, there are many persistent beliefs about shoebox (one-bedder) units, which are tough to prove. However, one thing is for sure – the demand is certainly there given it still is the cheapest entry into the private residential market.
When it comes to buying a shoebox unit (1-bedder), the unit mix of the development is often overlooked. But does it matter if most of the condo consists of shoeboxes and smaller units, or is it better to buy in a development with a wider variety of unit types? Could a balanced mix, from 1-bedders to 5-bedders, offer better long-term value? Here’s what we found out:
Many readers write in because they're unsure what to do next, and don't know who to trust.
If this sounds familiar, we offer structured 1-to-1 consultations where we walk through your finances, goals, and market options objectively.
No obligation. Just clarity.
Learn more here.
Why is the unit mix a concern to some buyers?
In general, a condo with a lot of small units is seen as a negative from an investment standpoint. Reasons range from it just being a rental project, to tougher sales pulling down the average price.
The former is based on the assumption that an “all-small unit” condo will consist of mainly tenants, who come and go regularly; and that the owners are investors who have no qualms about an en-bloc sale.
The latter is based on the belief that small units are tougher to sell/have weaker gains, so an “all-small unit” mix pulls down the price average. On the rental side, it may also spark a lot of competition; again on the assumption that most residents will be renters.
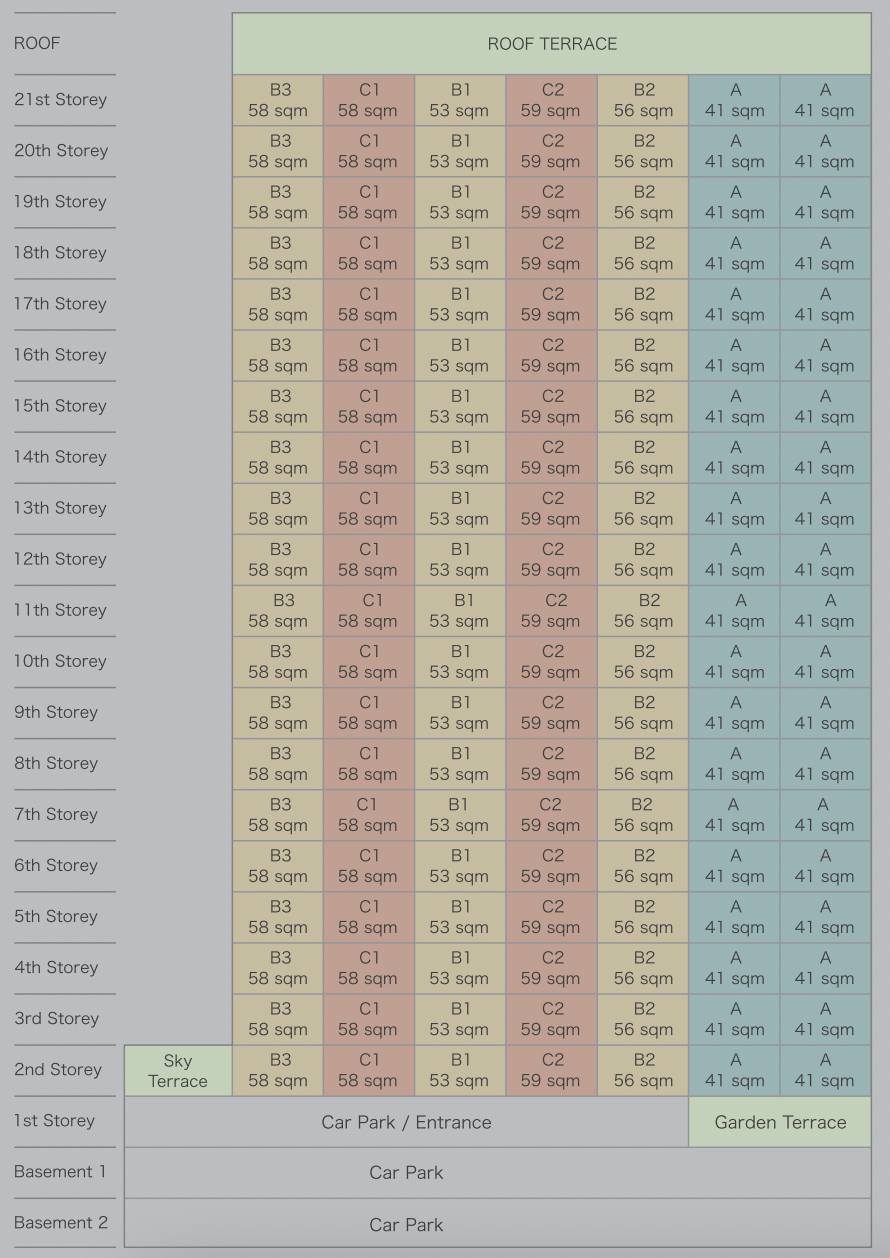
As such, some buyers of one-bedroom units, be they first-time investors or single homeowners, do care about the overall unit mix. Even though they’re buying small units themselves, many prefer a condo development with a balanced mix of small and family-sized units.
This led us to check whether one-bedder performance really is better with a balanced unit mix, compared to projects with just small units.
The condo projects we’ve selected
For the following, we’ve separated condo projects into ones with overwhelmingly small units (over 90 per cent are one and two-bedders), and condo units that count as having a balanced mix (one or two-bedders account for no more than 60 per cent of the unit mix).
| Condos | < 500 sq ft | < 800 sq ft | < 1200 sq ft | > 1200 sq ft | Grand Total | 500 sq ft Portion | Small Unit Portion |
| 16 @ AMBER | 29 | 28 | 1 | 58 | 50% | 98% | |
| 26 NEWTON | 72 | 93 | 8 | 2 | 175 | 41% | 94% |
| 28 IMPERIAL RESIDENCES | 25 | 25 | 3 | 2 | 55 | 45% | 91% |
| 3 CUSCADEN | 46 | 45 | 6 | 97 | 47% | 94% | |
| AIRSTREAM | 115 | 29 | 3 | 147 | 78% | 98% | |
| ASPEN LINQ | 17 | 9 | 26 | 65% | 100% | ||
| ATTITUDE AT KIM YAM | 53 | 16 | 69 | 77% | 100% | ||
| AVANT RESIDENCES | 29 | 18 | 2 | 49 | 59% | 96% | |
| CASA AERATA | 79 | 56 | 8 | 143 | 55% | 94% | |
| CASA CAMBIO | 157 | 94 | 12 | 13 | 276 | 57% | 91% |
| CAVAN SUITES | 56 | 4 | 60 | 93% | 100% | ||
| CENTRA HEIGHTS | 85 | 28 | 6 | 2 | 121 | 70% | 93% |
| CENTRA LOFT | 54 | 6 | 5 | 65 | 83% | 92% | |
| CENTRA STUDIOS | 84 | 7 | 91 | 92% | 100% | ||
| CENTRA SUITES | 103 | 5 | 108 | 95% | 100% | ||
| CITY LOFT | 67 | 7 | 7 | 81 | 83% | 91% | |
| CITY SUITES | 29 | 26 | 4 | 59 | 49% | 93% | |
| COSMO | 39 | 44 | 3 | 1 | 87 | 45% | 95% |
| CRADELS | 100 | 60 | 5 | 3 | 168 | 60% | 95% |
| DEVONSHIRE 12 | 17 | 8 | 2 | 27 | 63% | 93% | |
| DEVONSHIRE RESIDENCES | 40 | 44 | 9 | 93 | 43% | 90% | |
| DORSETT RESIDENCES | 34 | 65 | 7 | 3 | 109 | 31% | 91% |
| EDENZ LOFT | 48 | 7 | 55 | 87% | 100% | ||
| EDENZ SUITES | 57 | 1 | 58 | 98% | 98% | ||
| ESPADA | 197 | 131 | 1 | 3 | 332 | 59% | 99% |
| FIFTY-TWO STEVENS | 13 | 9 | 1 | 1 | 24 | 54% | 92% |
| GRANDVIEW SUITES | 42 | 14 | 2 | 4 | 62 | 68% | 90% |
| GUILLEMARD SUITES | 48 | 111 | 12 | 2 | 173 | 28% | 92% |
| HAIG 162 | 147 | 27 | 11 | 185 | 79% | 94% | |
| HILLION RESIDENCES | 380 | 212 | 26 | 33 | 651 | 58% | 91% |
| IDYLLIC SUITES | 61 | 31 | 92 | 66% | 100% | ||
| ILLUMINAIRE ON DEVONSHIRE | 66 | 61 | 127 | 52% | 100% | ||
| JOOL SUITES | 51 | 19 | 3 | 73 | 70% | 96% | |
| KOVAN GRANDEUR | 88 | 51 | 11 | 3 | 153 | 58% | 91% |
| LA BRISA | 69 | 64 | 9 | 142 | 49% | 94% | |
| LA FLEUR | 77 | 7 | 84 | 92% | 100% | ||
| LE REGAL | 78 | 39 | 4 | 121 | 64% | 97% | |
| LE SOMME | 9 | 14 | 2 | 25 | 36% | 92% | |
| LEICESTER SUITES | 74 | 4 | 4 | 82 | 90% | 95% | |
| LEVENUE | 44 | 8 | 5 | 57 | 77% | 91% | |
| LOFT @ STEVENS | 43 | 15 | 2 | 60 | 72% | 97% | |
| LOFT@HOLLAND | 60 | 5 | 65 | 92% | 92% | ||
| M5 | 18 | 18 | 100% | 100% | |||
| MELOSA | 53 | 33 | 86 | 62% | 100% | ||
| METRO LOFT | 34 | 6 | 40 | 85% | 100% | ||
| MIDTOWN BAY | 65 | 62 | 7 | 3 | 137 | 47% | 93% |
| MOUNT SOPHIA SUITES | 37 | 60 | 97 | 38% | 100% | ||
| NESS | 74 | 16 | 7 | 97 | 76% | 93% | |
| NOTTINGHILL SUITES | 116 | 60 | 1 | 177 | 66% | 99% | |
| OKIO | 72 | 63 | 4 | 139 | 52% | 97% | |
| ONE DUSUN RESIDENCES | 72 | 112 | 9 | 193 | 37% | 95% | |
| OPAL SUITES | 33 | 4 | 2 | 39 | 85% | 95% | |
| PARC SOMME | 37 | 14 | 5 | 56 | 66% | 91% | |
| PARK RESIDENCES KOVAN | 58 | 4 | 4 | 66 | 88% | 94% | |
| PAVILION SQUARE | 55 | 3 | 2 | 60 | 92% | 97% | |
| PRESTIGE HEIGHTS | 237 | 15 | 19 | 3 | 274 | 86% | 92% |
| PRIME RESIDENCE | 19 | 30 | 1 | 50 | 38% | 98% | |
| RANGOON 88 | 29 | 27 | 2 | 1 | 59 | 49% | 95% |
| ROBIN SUITES | 62 | 24 | 5 | 4 | 95 | 65% | 91% |
| ROBINSON SUITES | 59 | 95 | 6 | 2 | 162 | 36% | 95% |
| ROYCE RESIDENCES | 54 | 10 | 1 | 65 | 83% | 98% | |
| RV ALTITUDE | 40 | 101 | 141 | 28% | 100% | ||
| RV EDGE | 142 | 11 | 14 | 167 | 85% | 92% | |
| RV POINT | 40 | 3 | 2 | 45 | 89% | 96% | |
| SILVERSCAPE | 58 | 10 | 68 | 85% | 100% | ||
| SIMS EDGE | 55 | 49 | 10 | 114 | 48% | 91% | |
| SPOTTISWOODE 18 | 202 | 115 | 15 | 3 | 335 | 60% | 95% |
| SUITES @ PAYA LEBAR | 126 | 30 | 12 | 168 | 75% | 93% | |
| SUITES @ SHREWSBURY | 27 | 3 | 1 | 31 | 87% | 97% | |
| SUITES @ SIMS | 56 | 24 | 4 | 84 | 67% | 95% | |
| SUITES@BRADDELL | 45 | 3 | 3 | 51 | 88% | 94% | |
| SUITES@CHANGI | 68 | 6 | 74 | 92% | 92% | ||
| THE EBONY | 47 | 7 | 3 | 57 | 82% | 95% | |
| THE INTERWEAVE | 167 | 79 | 1 | 247 | 68% | 100% | |
| THE M | 141 | 366 | 24 | 531 | 27% | 95% | |
| THE OCTET | 53 | 16 | 69 | 77% | 100% | ||
| THE RED HOUSE | 12 | 16 | 2 | 30 | 40% | 93% | |
| THE TIER | 23 | 55 | 2 | 80 | 29% | 98% | |
| THOMSON V TWO | 98 | 64 | 3 | 165 | 59% | 98% | |
| TREASURES @ G20 | 52 | 2 | 2 | 56 | 93% | 96% | |
| TREASURES@G19 | 36 | 3 | 39 | 92% | 100% | ||
| TREASURES@G6 | 46 | 2 | 2 | 50 | 92% | 92% | |
| URBAN LOFTS | 39 | 48 | 6 | 1 | 94 | 41% | 93% |
| VETRO | 32 | 43 | 3 | 78 | 41% | 96% | |
| VIBES @ EAST COAST | 121 | 42 | 3 | 166 | 73% | 98% | |
| VIENTO | 69 | 10 | 79 | 87% | 100% | ||
| VIVA VISTA | 161 | 30 | 8 | 199 | 81% | 96% | |
| VIVACE | 87 | 20 | 4 | 1 | 112 | 78% | 96% |
| WILKIE 80 | 41 | 50 | 1 | 92 | 45% | 99% | |
| QUEENS PEAK | 333 | 184 | 309 | 56 | 882 | 38% | 59% |
| HIGH PARK RESIDENCES | 318 | 793 | 494 | 247 | 1852 | 17% | 60% |
| KINGSFORD WATERBAY | 309 | 458 | 619 | 51 | 1437 | 22% | 53% |
| TREASURE AT TAMPINES | 285 | 879 | 894 | 502 | 2560 | 11% | 45% |
| BARTLEY RIDGE | 258 | 184 | 570 | 147 | 1159 | 22% | 38% |
| EIGHT RIVERSUITES | 254 | 302 | 530 | 81 | 1167 | 22% | 48% |
| PARC ESTA | 242 | 644 | 660 | 83 | 1629 | 15% | 54% |
| THE INFLORA | 216 | 104 | 192 | 80 | 592 | 36% | 54% |
| D’NEST | 212 | 323 | 389 | 335 | 1259 | 17% | 42% |
| BARTLEY RESIDENCES | 175 | 143 | 506 | 160 | 984 | 18% | 32% |
| PARC CENTROS | 173 | 159 | 332 | 187 | 851 | 20% | 39% |
| COCO PALMS | 168 | 316 | 394 | 301 | 1179 | 14% | 41% |
| SKY VUE | 155 | 367 | 349 | 14 | 885 | 18% | 59% |
| LE QUEST | 147 | 159 | 244 | 30 | 580 | 25% | 53% |
| PARC CLEMATIS | 147 | 587 | 503 | 354 | 1591 | 9% | 46% |
| WATERBANK AT DAKOTA | 143 | 183 | 464 | 216 | 1006 | 14% | 32% |
| THE SCALA | 142 | 10 | 492 | 52 | 696 | 20% | 22% |
| THE PANORAMA | 141 | 251 | 393 | 117 | 902 | 16% | 43% |
| V ON SHENTON | 134 | 89 | 156 | 138 | 517 | 26% | 43% |
| GEM RESIDENCES | 133 | 275 | 219 | 97 | 724 | 18% | 56% |
| STRATUM | 129 | 115 | 126 | 146 | 516 | 25% | 47% |
| AMBER PARK | 114 | 218 | 109 | 178 | 619 | 18% | 54% |
| GRANDEUR PARK RESIDENCES | 113 | 370 | 269 | 108 | 860 | 13% | 56% |
| THE PROMENADE@PELIKAT | 111 | 9 | 94 | 14 | 228 | 49% | 53% |
| LA FIESTA | 110 | 306 | 504 | 131 | 1051 | 10% | 40% |
| HEDGES PARK CONDOMINIUM | 106 | 229 | 369 | 73 | 777 | 14% | 43% |
| SENGKANG GRAND RESIDENCES | 105 | 293 | 264 | 51 | 713 | 15% | 56% |
| NORTH PARK RESIDENCES | 104 | 477 | 369 | 91 | 1041 | 10% | 56% |
| ALEX RESIDENCES | 96 | 153 | 265 | 514 | 19% | 48% | |
| JEWEL @ BUANGKOK | 96 | 278 | 283 | 116 | 773 | 12% | 48% |
| STURDEE RESIDENCES | 95 | 123 | 118 | 42 | 378 | 25% | 58% |
| RIVERBANK @ FERNVALE | 93 | 116 | 448 | 72 | 729 | 13% | 29% |
| ECHELON | 87 | 200 | 176 | 193 | 656 | 13% | 44% |
| THE TEMBUSU | 84 | 122 | 99 | 86 | 391 | 21% | 53% |
| WHISTLER GRAND | 84 | 392 | 202 | 144 | 822 | 10% | 58% |
| THOMSON THREE | 82 | 198 | 231 | 46 | 557 | 15% | 50% |
| SKIES MILTONIA | 79 | 227 | 230 | 66 | 602 | 13% | 51% |
| VACANZA @ EAST | 79 | 71 | 439 | 109 | 698 | 11% | 21% |
| LAKE GRANDE | 73 | 404 | 307 | 24 | 808 | 9% | 59% |
| THE NAUTICAL | 72 | 94 | 301 | 144 | 611 | 12% | 27% |
| NORMANTON PARK | 67 | 1004 | 651 | 150 | 1872 | 4% | 57% |
| PARC OLYMPIA | 66 | 263 | 239 | 130 | 698 | 9% | 47% |
| REGENT RESIDENCES | 65 | 62 | 120 | 9 | 256 | 25% | 50% |
| LINCOLN SUITES | 61 | 29 | 91 | 51 | 232 | 26% | 39% |
| 8@WOODLEIGH | 60 | 4 | 459 | 61 | 584 | 10% | 11% |
| FORESQUE RESIDENCES | 60 | 163 | 219 | 196 | 638 | 9% | 35% |
| THE CREEK @ BUKIT | 58 | 88 | 90 | 80 | 316 | 18% | 46% |
| SKYLINE RESIDENCES | 57 | 104 | 169 | 330 | 17% | 17% | |
| THE LAKEFRONT RESIDENCES | 56 | 244 | 350 | 220 | 870 | 6% | 34% |
| CORALIS | 54 | 2 | 68 | 47 | 171 | 32% | 33% |
| OPTIMA @ TANAH MERAH | 53 | 37 | 263 | 147 | 500 | 11% | 18% |
| THE SORRENTO | 50 | 32 | 44 | 28 | 154 | 32% | 53% |
| RIVERSOUND RESIDENCE | 49 | 80 | 410 | 258 | 797 | 6% | 16% |
| CASPIAN | 47 | 474 | 704 | 1225 | 4% | 4% | |
| NIN RESIDENCE | 47 | 30 | 151 | 74 | 302 | 16% | 25% |
| THE GAZANIA | 45 | 79 | 73 | 49 | 246 | 18% | 50% |
| DOMUS | 43 | 77 | 46 | 166 | 26% | 26% | |
| MARGARET VILLE | 43 | 128 | 172 | 1 | 344 | 13% | 50% |
| THE VERANDAH RESIDENCES | 42 | 61 | 55 | 23 | 181 | 23% | 57% |
| 18 WOODSVILLE | 41 | 24 | 44 | 6 | 115 | 36% | 57% |
| HUNDRED TREES | 41 | 111 | 230 | 231 | 613 | 7% | 25% |
| THE WISTERIA | 41 | 105 | 139 | 285 | 14% | 51% | |
| TWIN VEW | 41 | 200 | 241 | 127 | 609 | 7% | 40% |
| THE LUXURIE | 40 | 276 | 438 | 110 | 864 | 5% | 37% |
| TREVISTA | 40 | 48 | 610 | 337 | 1035 | 4% | 9% |
| FULCRUM | 39 | 34 | 63 | 8 | 144 | 27% | 51% |
| THE SANTORINI | 39 | 343 | 299 | 85 | 766 | 5% | 50% |
| SUITES 28 | 35 | 8 | 49 | 92 | 38% | 47% | |
| THE LINE @ TANJONG RHU | 35 | 34 | 43 | 14 | 126 | 28% | 55% |
| TRE RESIDENCES | 33 | 118 | 167 | 4 | 322 | 10% | 47% |
| JUI RESIDENCES | 32 | 42 | 54 | 128 | 25% | 58% | |
| PARC KOMO | 31 | 119 | 87 | 52 | 289 | 11% | 52% |
| SKY EVERTON | 31 | 136 | 88 | 26 | 281 | 11% | 59% |
| THE PALETTE | 30 | 261 | 762 | 178 | 1231 | 2% | 24% |
| 6 DERBYSHIRE | 29 | 77 | 73 | 1 | 180 | 16% | 59% |
| NYON | 29 | 18 | 23 | 26 | 96 | 30% | 49% |
| SEASIDE RESIDENCES | 27 | 547 | 207 | 191 | 972 | 3% | 59% |
| MEYER MANSION | 25 | 24 | 49 | 103 | 201 | 12% | 24% |
| PALM GALLERIA | 25 | 52 | 14 | 91 | 27% | 27% | |
| SOLEIL @ SINARAN | 25 | 156 | 291 | 291 | 763 | 3% | 24% |
| EIGHT COURTYARDS | 24 | 48 | 692 | 128 | 892 | 3% | 8% |
| BLISS LOFT | 22 | 15 | 35 | 7 | 79 | 28% | 47% |
| RIVER ISLES | 22 | 89 | 423 | 321 | 855 | 3% | 13% |
| URBAN RESIDENCES | 21 | 2 | 25 | 10 | 58 | 36% | 40% |
| VUE 8 RESIDENCE | 21 | 154 | 182 | 220 | 577 | 4% | 30% |
| MY MANHATTAN | 19 | 78 | 226 | 62 | 385 | 5% | 25% |
| VIIO @ BALESTIER | 19 | 16 | 31 | 66 | 29% | 53% | |
| DUO RESIDENCES | 18 | 322 | 238 | 104 | 682 | 3% | 50% |
| NV RESIDENCES | 18 | 266 | 509 | 209 | 1002 | 2% | 28% |
| THE HYDE | 18 | 30 | 34 | 33 | 115 | 16% | 42% |
| NEWEST | 16 | 42 | 8 | 101 | 167 | 10% | 35% |
| CUBIK | 15 | 17 | 2 | 34 | 44% | 44% | |
| ROBIN RESIDENCES | 14 | 54 | 40 | 24 | 132 | 11% | 52% |
| SPRING @ LANGSAT | 14 | 2 | 31 | 7 | 54 | 26% | 30% |
| 8 SAINT THOMAS | 13 | 40 | 92 | 92 | 237 | 5% | 22% |
| MOUNTBATTEN SUITES | 13 | 15 | 24 | 13 | 65 | 20% | 43% |
| 24 ONE RESIDENCES | 11 | 5 | 8 | 5 | 29 | 38% | 55% |
| THE LUCENT | 11 | 30 | 39 | 80 | 14% | 14% | |
| AURA 83 | 10 | 28 | 16 | 10 | 64 | 16% | 59% |
| HAIG RESIDENCES | 10 | 12 | 4 | 26 | 38% | 38% | |
| SENNETT RESIDENCE | 10 | 141 | 197 | 76 | 424 | 2% | 36% |
| THE VENUE RESIDENCES | 10 | 24 | 240 | 62 | 336 | 3% | 10% |
| VENTURA VIEW | 10 | 19 | 11 | 20 | 60 | 17% | 48% |
| 3@SANDILANDS | 9 | 12 | 13 | 9 | 43 | 21% | 49% |
| SEA PAVILION RESIDENCES | 9 | 3 | 10 | 3 | 25 | 36% | 48% |
| SHIRO | 9 | 10 | 1 | 20 | 45% | 45% | |
| THE BENTLY RESIDENCES@KOVAN | 9 | 19 | 21 | 11 | 60 | 15% | 47% |
| THE SCENIC @ BRADDELL | 8 | 7 | 10 | 10 | 35 | 23% | 43% |
| THREE 11 | 8 | 37 | 35 | 4 | 84 | 10% | 54% |
| 38 JERVOIS | 7 | 4 | 17 | 28 | 25% | 39% | |
| HILBRE28 | 7 | 19 | 10 | 36 | 19% | 19% | |
| RIZ HAVEN | 7 | 5 | 32 | 15 | 59 | 12% | 20% |
| BLISS@KOVAN | 6 | 36 | 63 | 77 | 182 | 3% | 23% |
| ONAN SUITES | 6 | 9 | 19 | 13 | 47 | 13% | 32% |
| RESIDENCES BOTANIQUE | 6 | 7 | 94 | 17 | 124 | 5% | 10% |
| TRILIVE | 6 | 142 | 113 | 261 | 2% | 57% | |
| DUNEARN 386 | 5 | 16 | 15 | 36 | 14% | 58% | |
| NINE RESIDENCES | 5 | 122 | 89 | 20 | 236 | 2% | 54% |
| LEVILLE ISUITES | 4 | 18 | 16 | 11 | 49 | 8% | 45% |
| ONE DUCHESS | 4 | 2 | 8 | 2 | 16 | 25% | 38% |
| RESIDENCE TWENTY-TWO | 4 | 11 | 8 | 23 | 17% | 17% | |
| SUITES @ AMBER | 3 | 18 | 27 | 3 | 51 | 6% | 41% |
| UBER 388 | 3 | 17 | 52 | 42 | 114 | 3% | 18% |
| BALCON EAST | 2 | 17 | 23 | 21 | 63 | 3% | 30% |
| D’ ALMIRA | 2 | 5 | 21 | 21 | 49 | 4% | 14% |
| HIJAUAN | 2 | 11 | 28 | 4 | 45 | 4% | 29% |
| NOVA 88 | 2 | 53 | 66 | 47 | 168 | 1% | 33% |
| BERKELEY RESIDENCES | 1 | 17 | 14 | 2 | 34 | 3% | 53% |
| GARDEN PARK RESIDENCES | 1 | 25 | 12 | 8 | 46 | 2% | 57% |
| SANCTUARY @ 813 | 1 | 10 | 24 | 35 | 3% | 31% | |
| WHITEHAVEN | 1 | 73 | 46 | 16 | 136 | 1% | 54% |
From here, we first looked at the profitability of the one-bedders (below 500 sq. ft.), from January 2013 to the present.
(We chose January 2013 as that was when the Sellers Stamp Duty (SSD) was implemented. All the transactions have an equal footing, as none of them occurred before the added tax on sellers)
As a general conclusion, it seems better to buy a one-bedder in a condo with a balanced unit mix.
There’s a substantial difference in performance: the one-bedders in almost purely “small unit” condos saw average returns of 6.6 per cent. However, the one-bedders in condos with a balanced unit mix saw returns of 14.9 per cent.
This was over an almost similar holding period (5.7 years versus six years).
But could this also be related to the total unit count (e.g., boutique condos with very few units, versus mass-market condos with lots of units?)
To check this out, we want to set up a comparison between condo projects that are boutique (less than 150 total units), and the larger mass market projects:
| Type | Not Boutique | Boutique | Grand Total |
| QUALIFY AS GOOD MIX | 81 | 50 | 131 |
| QUALIFY AS SMALL | 11 | 79 | 90 |
| Grand Total | 92 | 129 | 221 |
There’s a discrepancy here. Most of the “all-small unit” projects are boutique condos (79 are boutique, versus 11 mass-market projects). So let’s look at performance specific to just the boutique projects:
| Type | QUALIFY AS GOOD MIX | QUALIFY AS SMALL |
| Average of quantum | $51,092 | $22,327 |
| Average of % | 7.30% | 4.07% |
| Average of annualised | 1.06% | 0.88% |
| Average of holding period | 6.1 | 5.7 |
| Volume | 60 | 370 |
Even confined to boutique projects, we see the same overall result.
On average, one-bedders in a condo with a balanced unit mix will outperform. Regardless of whether it’s a boutique or mass-market condo, there does seem to be justification for avoiding “all-small unit” mixes.
Next, we checked if the results would be the same for new-to-resale transactions, versus resale-to-resale transactions
| New to resale | |||
| Values | QUALIFY AS GOOD MIX | QUALIFY AS SMALL | Difference |
| Average of quantum | $95,838 | $35,742 | $60,097 |
| Average of % | 16.0% | 7.1% | 8.9% |
| Average of annualised | 2.2% | 1.0% | 1.2% |
| Average of holding period | 6.9 | 6.7 | 0.2 |
| Volume | 854 | 257 |
| Resale to Resale | | | |
| Values | QUALIFY AS GOOD MIX | QUALIFY AS SMALL | Difference |
| Average of quantum | $66,510 | $45,665 | $20,845 |
| Average of % | 10.7% | 7.8% | 2.8% |
| Average of annualised | 2.5% | 1.8% | 0.7% |
| Average of holding period | 4.5 | 4.8 | -0.2 |
| Volume | 179 | 281 | |
We saw a big difference in returns between those who bought new, and those who bought as resale.
To some degree, this may reflect developer pricing methods: in a project with a balanced unit mix, developers tend to price the one and two-bedders to move first. If nothing else, the combination of a lower quantum, plus early bird discounts, makes for impressive-looking launch figures.
As such, those who bought new one-bedders in balanced projects have seen the best overall returns. Also note that 2013 was the last property market peak, which may also contribute to the good performance.
For projects that are all-small units, however, there seems to be less difference whether they’re new-to-resale, or resale-to-resale. So if you’re going for a shoebox or a two-bedder, a new launch may be the better option – regardless of how the unit mix looks.
What about the issue of timing?
Could market conditions have affected the overall results? 2013 was, after all, a peak year. To get a sense of this, we first need to look at the transaction volumes based on the year:
| Year Purchased | QUALIFY AS GOOD MIX | QUALIFY AS SMALL | Grand Total | Exclude? |
| 2013 | 397 | 74 | 471 | No |
| 2014 | 142 | 108 | 250 | No |
| 2015 | 105 | 8 | 113 | Yes |
| 2016 | 102 | 27 | 129 | No |
| 2017 | 66 | 39 | 105 | No |
| 2018 | 17 | 1 | 18 | Yes |
| 2019 | 13 | 13 | Yes | |
| 2020 | 11 | 11 | Yes | |
| 2021 | 1 | 1 | Yes | |
| Grand Total | 854 | 257 | 1111 |
| Year Purchased | QUALIFY AS GOOD MIX | QUALIFY AS SMALL | Grand Total | Exclude? |
| 2013 | 3 | 14 | 17 | Yes |
| 2014 | 3 | 16 | 19 | Yes |
| 2015 | 12 | 19 | 31 | No |
| 2016 | 14 | 39 | 53 | No |
| 2017 | 39 | 62 | 101 | No |
| 2018 | 49 | 67 | 116 | No |
| 2019 | 29 | 34 | 63 | No |
| 2020 | 24 | 18 | 42 | No |
| 2021 | 5 | 10 | 15 | Yes |
| 2022 | 1 | 2 | 3 | Yes |
Unfortunately, transaction volumes for both types of projects (balanced unit mixes and all-small units) are very low in certain years. Including these transactions could skew averages and distort the results – so we’ve excluded these as outliers when taking a second look at the data.
Now here’s what we can see:
| New to Resale | ||
| Values | QUALIFY AS GOOD MIX | QUALIFY AS SMALL |
| Average of quantum | $92,169 | $36,009 |
| Average of % | 15.0% | 7.1% |
| Average of annualised | 2.0% | 1.0% |
| Average of holding period | 7.1 | 6.7 |
| Volume | 707 | 248 |
| Resale to Resale | | |
| Values | QUALIFY AS GOOD MIX | QUALIFY AS SMALL |
| Average of quantum | $40,047 | $32,449 |
| Average of % | 6.1% | 5.6% |
| Average of annualised | 0.9% | 1.1% |
| Average of holding period | 5.4 | 5.5 |
| Volume | 59 | 131 |
The results are still consistent. We can conclude that, for one-bedder units, average performance is much better if:
- You purchase it as a new launch
- You purchase it in a project with a balanced unit mix, rather than one that’s just packed with other small units
- The project has a higher unit count, as you can see from the higher average return for projects with 150 units or more
It seems that conventional wisdom from realtors and veteran investors has panned out here: the market does seem more reluctant about landlord-oriented, all-small unit condos. It may also be a good reason to overlook the lack of immediate rental income when you pick a new launch one-bedder.
At Stacked, we like to look beyond the headlines and surface-level numbers, and focus on how things play out in the real world.
If you’d like to discuss how this applies to your own circumstances, you can reach out for a one-to-one consultation here.
And if you simply have a question or want to share a thought, feel free to write to us at stories@stackedhomes.com — we read every message.
Ryan J. Ong
A seasoned content strategist with over 17 years in the real estate and financial journalism sectors, Ryan has built a reputation for transforming complex industry jargon into accessible knowledge. With a track record of writing and editing for leading financial platforms and publications, Ryan's expertise has been recognised across various media outlets. His role as a former content editor for 99.co and a co-host for CNA 938's Open House programme underscores his commitment to providing valuable insights into the property market.Need help with a property decision?
Speak to our team →Read next from Property Advice

Property Advice We Can Buy Two HDBs Today — Is Waiting For An EC A Mistake?

Property Advice I’m 55, Have No Income, And Own A Fully Paid HDB Flat—Can I Still Buy Another One Before Selling?

Property Advice We’re Upgrading From A 5-Room HDB On A Single Income At 43 — Which Condo Is Safer?

Property Advice We’re In Our 50s And Own An Ageing Leasehold Condo And HDB Flat: Is Keeping Both A Mistake?
Latest Posts

Singapore Property News Why Some Singaporean Parents Are Considering Selling Their Flats — For Their Children’s Sake
Pro River Modern Starts From $1.548M For A Two-Bedder — How Its Pricing Compares In River Valley
New Launch Condo Reviews River Modern Condo Review: A River-facing New Launch with Direct Access to Great World MRT Station








0 Comments