How many HDB MOP flats are entering Singapore’s resale market in 2020 and 2021?
November 22, 2020
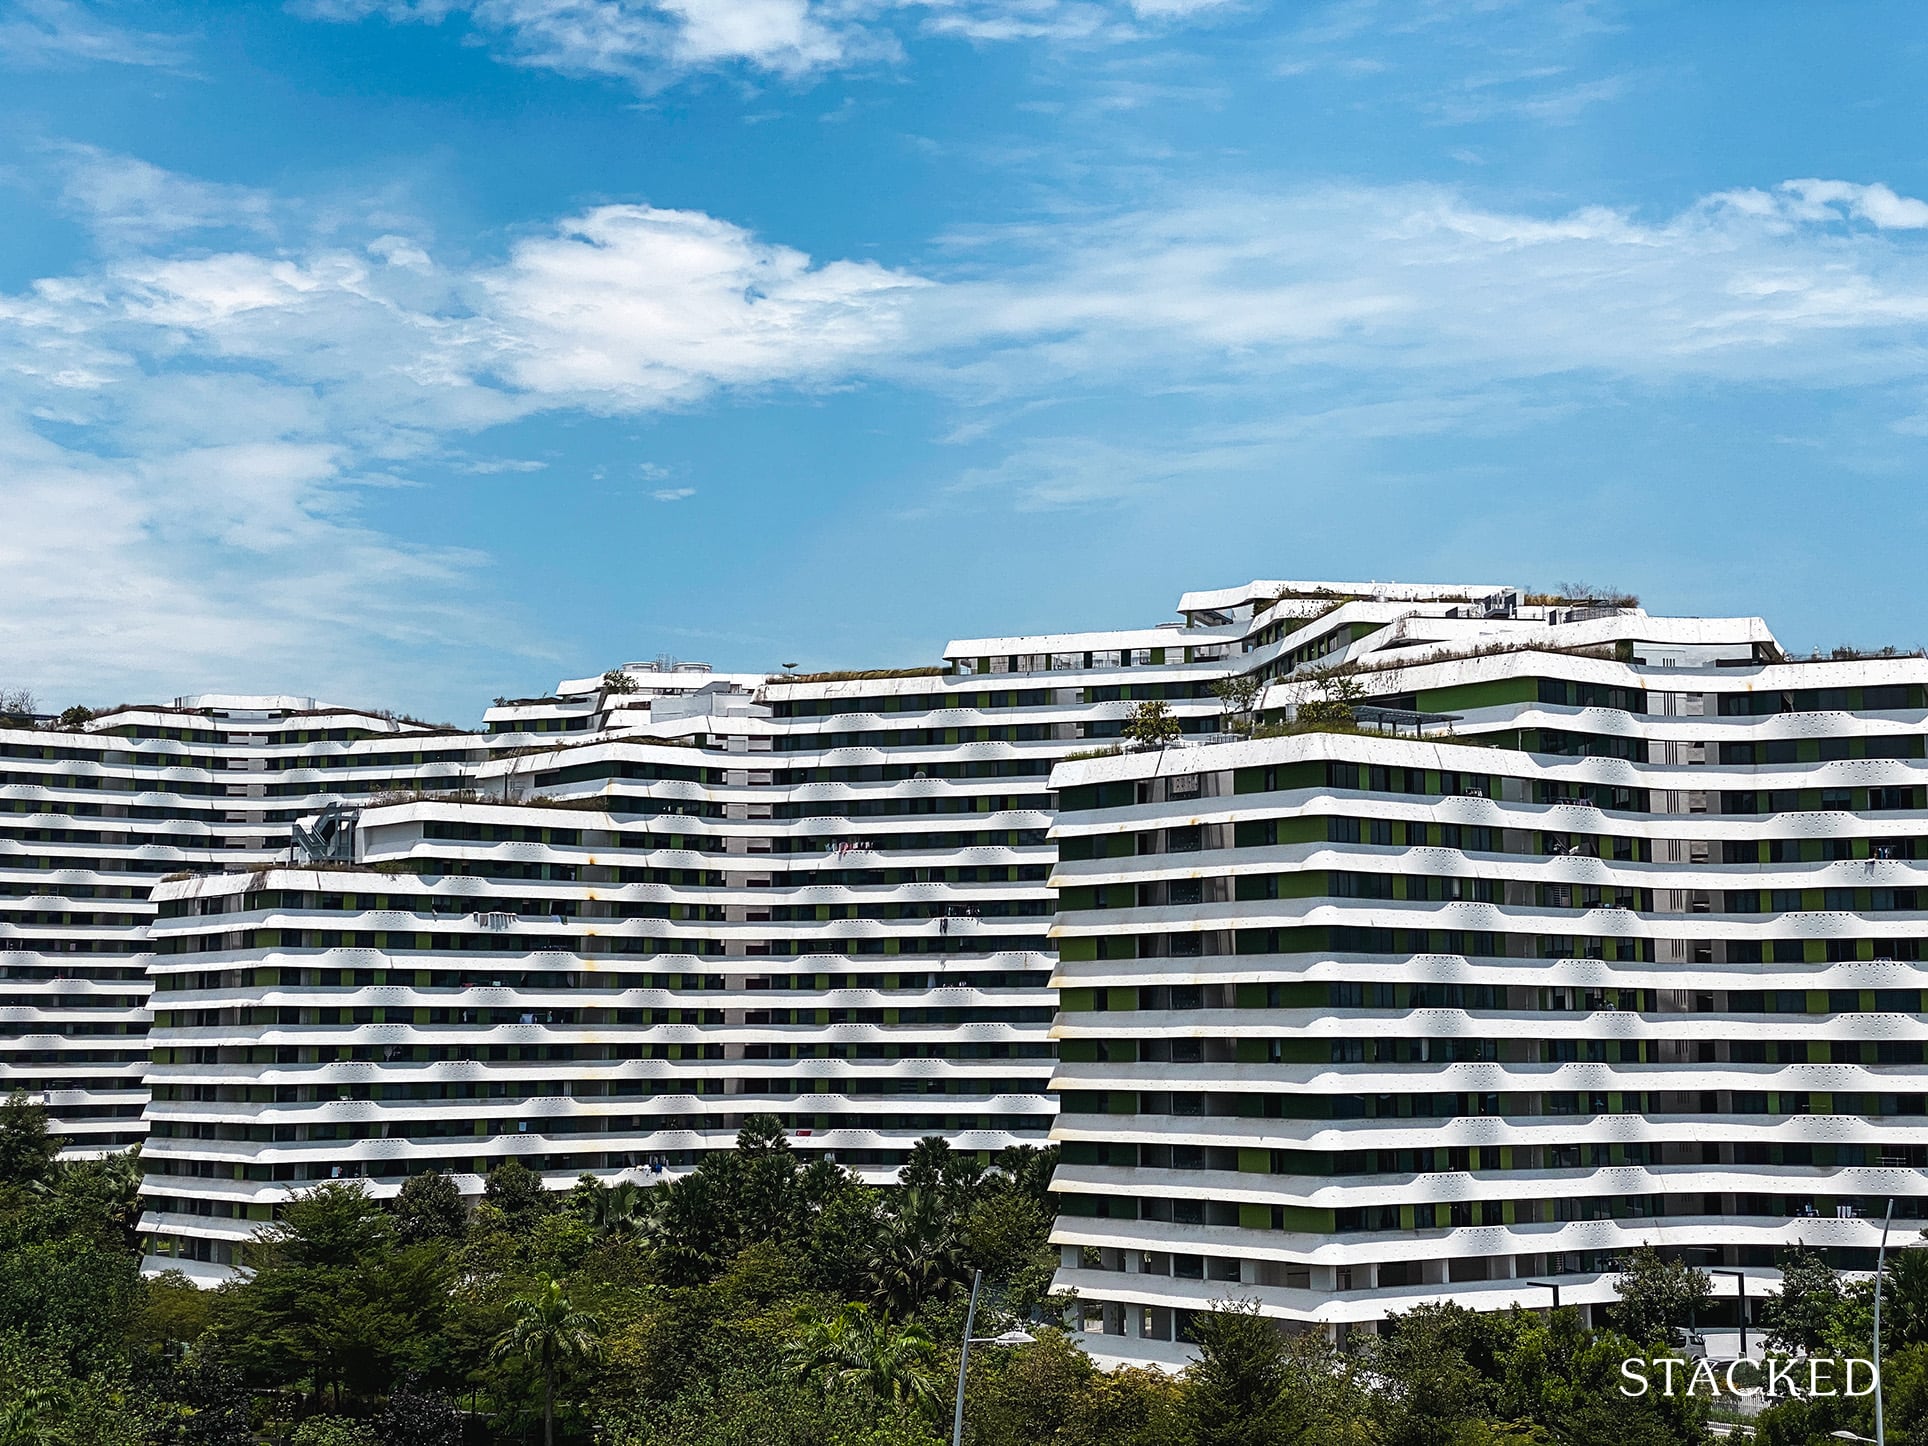
Have you noticed the lift at your block being extra slow lately, as movers or renovators keep cramming into it? Or have you seen more strangers walking up and down the corridors of late, peering into nearby flats?
Consider it the result of a record breaking 50,000+ flats reaching their Minimum Occupation Period (MOP) between 2020 and 2021. This is massive when you consider the 10-year average between 2010 and 2018, when only around 9,000 flats reached MOP every year.
We mentioned it in a previous article, where we discussed the resale flat market taking a U-turn.
What’s of interest to most resale flat seekers, however, are the new, five-year old flats that are just now entering the market. These are the most alluring choices if you’re seeking a flat right now, as you can move in immediately, plus the lease decay is practically irrelevant.
Here’s where you might find them:
Why are new flats reaching MOP more desirable than older resale flats reaching MOP?
This is due to the simple fact that HDB flats are on 99-year leases. Flats that are only five years old still have significant resale potential or legacy value. In addition, these flats are likely to be better maintained.
As a further bonus, those who sell their new flats right after MOP are often upgraders; they would have been planning to move out soon after. They often keep renovations to a minimum, as the flat is transitory to them; this can mean it’s quicker for you to renovate and move in (there are fewer walls, floors, cabinets, etc. to hack up).
On the downside, any new flats reaching MOP in 2020 or 2021 would have been completed in 2015 to 2016; note that these newer flats tend to be smaller than flats built in, say, the 1980’s or 1990’s.
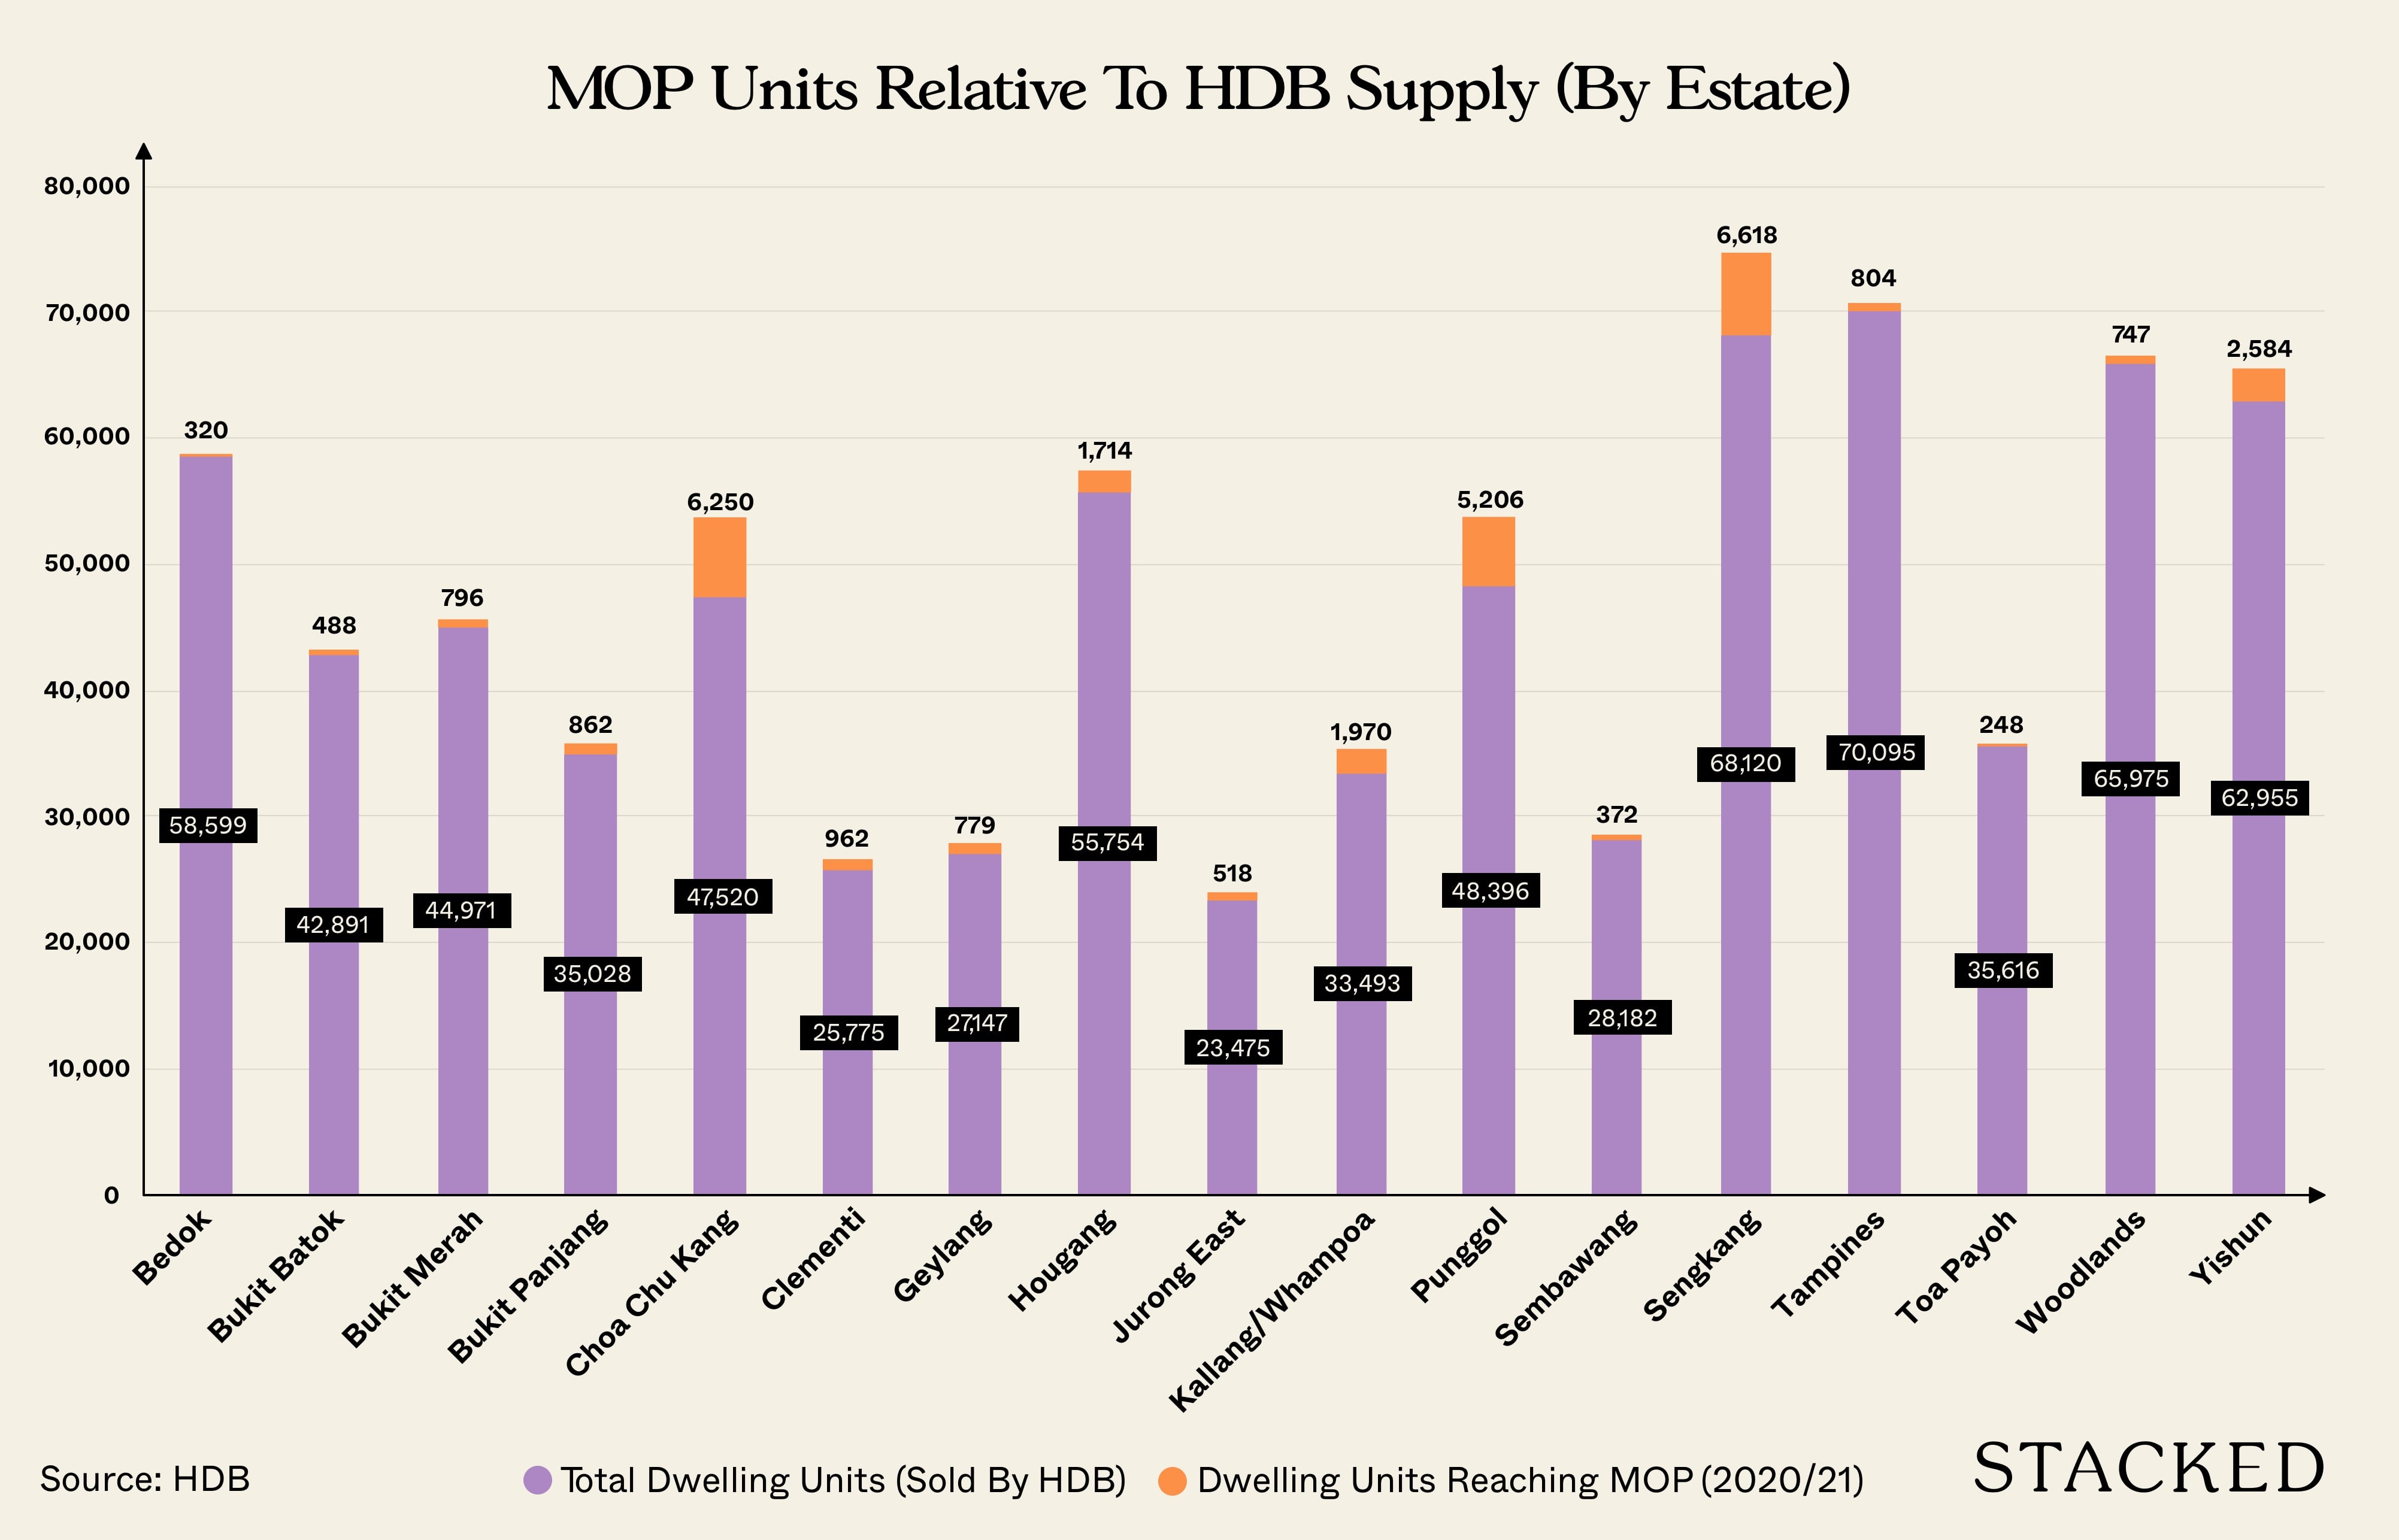
For those wondering, here is the upcoming MOP HDB flats as compared to the HDB supply by HDB estate.
New flats reaching MOP between 2020 to 2021:
Note: The following are estimates only; we have based the numbers on projects completed in 2015 and 2016 (as MOP is calculated from the time of key collection, not the launch date of the BTO project)
We have focused on 3, 4, and 5-room flats as these are the most commonly sought after units.
Again, these are the newest (BTO) flats reaching their 5th year mark; we have not included older resale flats that are reaching their MOP.
1. Bedok (320 units)
| Name | Est. Completion Date | 3-room | 4-room | 5-room | Est. total |
| Ping Yi Greens | Q4 2015 | 84 | 236 | – | 320 |
2. Bukit Batok (488 units)
| Name | Est. Completion Date | 3-room | 4-room | 5-room | Est. total |
| Skyline I @ Bukit Batok | Q2 2016 | 78 | 216 | 194 | 488 |
3. Bukit Merah (796 units)
| Name | Est. Completion Date | 3-room | 4-room | 5-room | Est. total |
| Depot Heights | Q3 2016 | 128 | 176 | – | 304 |
| Telok Blangah Ridgeview | Q1 2016 | 96 | 396 | – | 492 |
4. Bukit Panjang (862 units)
| Name | Est. Completion Date | 3-room | 4-room | 5-room | Est. total |
| Fajar Hills | Q4 2015 | 146 | 392 | 324 | 862 |
5. Choa Chu Kang (6,250 units)
| Name | Est. Completion Date | 3-room | 4-room | 5-room | Est. total |
| Sunshine Gardens | Q2 2015 | 118 | 788 | 518 | 1,424 |
| Keat Hong Pride | Q2 2016 | 80 | 656 | 407 | 1,143 |
| Keat Hong Axis | Q1 2016 | 140 | 520 | 372 | 1,032 |
| Keat Hong Quad | Q1 2016 | – | 334 | 190 | 524 |
| Keat Hong Mirage | Q3 2016 | 114 | 559 | 486 | 1,159 |
| Keat Hong Colours | Q4 2016 | 136 | 484 | 348 | 968 |
6. Clementi (962 units)
| Name | Est. Completion Date | 3-room | 4-room | 5-room | Est. total |
| Clementi Ridges | Q3 2016 | 156 | 312 | 216 | 684 |
| Clementi Gateway | Q3 2016 | 134 | 144 | – | 278 |
7. Geylang (779 units)
| Name | Est. Completion Date | 3-room | 4-room | 5-room | Est. total |
| MacPherson Residency | Q4 2015 | 211 | 426 | – | 637 |
| Greentops @ Sims Place | Q4 2015 | 142 | – | – | 142 |
8. Hougang (1,714 units)
| Name | Est. Completion Date | 3-room | 4-room | 5-room | Est. total |
| Capeview | Q1 2015 | 108 | 429 | 244 | 637 |
| Dew Court | Q1 2015 | – | 181 | – | 181 |
| Hougang Park Edge | Q2 2016 | 136 | 204 | 238 | 578 |
| Hougang Crimson | Q4 2016 | 104 | 210 | – | 314 |
9. Jurong East (518 units)
| Name | Est. Completion Date | 3-room | 4-room | 5-room | Est. total |
| Teban View | Q4 2015 | 185 | 333 | – | 518 |
10. Kallang / Whampoa (1,970 units)
| Name | Est. Completion Date | 3-room | 4-room | 5-room | Est. total |
| Bendemeer Light | Q4 2016 | 212 | 412 | – | 624 |
| McNair Towers | Q4 2016 | 115 | 476 | – | 591 |
| Tenteram Peak | Q4 2016 | 319 | 436 | – | 755 |
11. Punggol (5,206 units)
| Name | Est. Completion Date | 3-room | 4-room | 5-room | Est. total |
| Waterway Terraces | Q1 2015 | 178 | 588 | 306 | 1,072 |
| Punggol Topaz | Q2 2015 | 184 | 542 | 284 | 1,010 |
| Waterway Terraces II | Q2 2015 | 118 | 440 | 246 | 804 |
| Waterway Woodcress | Q1 2015 | 100 | 350 | 244 | 694 |
| Waterway Brooks | Q3 2015 | – | 691 | 465 | 1,156 |
| Matilda Portico | Q2 2016 | – | 251 | 219 | 470 |
12. Sembawang (372 units)
| Name | Est. Completion Date | 3-room | 4-room | 5-room | Est. total |
| EastBank @ Canberra | Q4 2016 | – | 193 | 179 | 372 |
13. Sengkang (6,618)
| Name | Est. Completion Date | 3-room | 4-room | 5-room | Est. total |
| Fernvale Rivergrove | Q3 2015 | 484 | 892 | 252 | 1,628 |
| Fernvale Lea | Q3 2015 | 100 | 600 | 350 | 1,050 |
| Compassvale Boardwalk | Q4 2015 | – | 252 | 222 | 474 |
| Compassvale Mast | Q2 2016 | 104 | 465 | 359 | 928 |
| Rivervale Delta | Q2 2016 | 102 | 425 | 357 | 884 |
| Compassvale Cape | Q4 2016 | 196 | 588 | 440 | 1,194 |
| Compassvale Helm | Q4 2016 | – | 253 | 207 | 460 |
14. Tampines (804 units)
| Name | Est. Completion Date | 3-room | 4-room | 5-room | Est. total |
| Tampines GreenLace | Q1 2016 | – | 215 | 165 | 380 |
| Tampines GreenForest | Q2 2016 | 160 | 264 | – | 424 |
15. Toa Payoh (248)
| Name | Est. Completion Date | 3-room | 4-room | 5-room | Est. total |
| Joo Seng Green | Q1 2016 | 102 | 146 | – | 248 |
16. Woodlands (747 units)
| Name | Est. Completion Date | 3-room | 4-room | 5-room | Est. total |
| Woodlands Peak | Q3 2015 | 95 | – | – | 95 |
| TreeTrail @ Woodlands | Q2 2016 | – | 418 | 234 | 652 |
17. Yishun (2,584 units)
| Name | Est. Completion Date | 3-room | 4-room | 5-room | Est. total |
| Acacia Breeze | Q1 2015 | 108 | 418 | 308 | 834 |
| Oleander Breeze @ Yishun | Q3 2016 | 160 | 348 | 180 | 688 |
| Vine Grove @ Yishun | Q4 2016 | 192 | 324 | – | 516 |
| Palm Breeze @ Yishun | Q4 2016 | 96 | 274 | 176 | 546 |
All in, we estimate that the bulk of new flats entering the resale market (in 2020 and 2021) will be in Sengkang, Choa Chu Kang, Punggol.
As expected, it’s the non-mature areas that are seeing the bulk of five-year old flats. This could see a bigger influx into these areas, if buyers decide that age is a bigger factor than a built-up estate.
About Sengkang
Sengkang is often underrated in terms of amenities. This is mostly a holdover from the early 2000’s, when it was one of the more underdeveloped estates.
Today Sengkang has three malls – Rivervale Plaza, Rivervale Mall, and Compass One Shopping Centre, as well as its own MRT / LRT station; it also benefits from the increased development of the neighbouring Punggol area.
Sengkang’s distinguishing feature is youth – it’s so closely associated with younger families, it was even credited with affecting the last general election. The abundance of new resale flats in this area is likely to compound the effect: younger Singaporeans are more inclined to seek out these five-year old flats, as they have more need of a longer remaining lease.
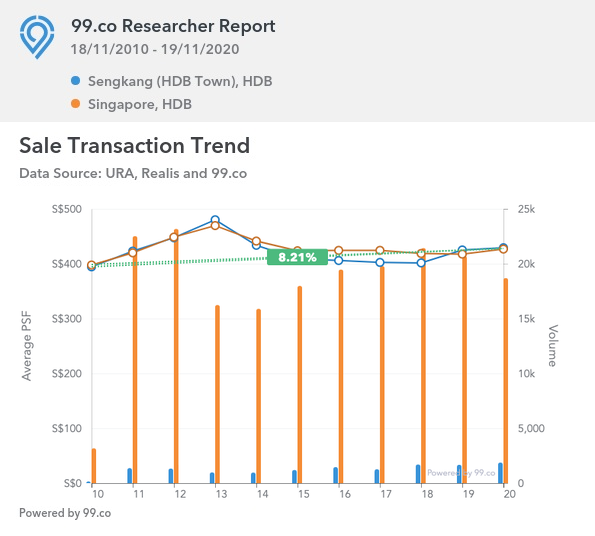
As at the time of writing, prices in Sengkang average $429 psf in 2020. This is ever so slightly higher than the average of $427 psf, for all HDB towns island-wide.

Property Market CommentaryDo Resale Properties Really Cost More To Renovate?
by Ryan J. OngAbout Choa Chu Kang
The reason for Choa Chu Kang seeing such a big number of new resale flats is just a matter of odds. This estate consists of seven sub-zones, from Choa Chu Kang Central to Yew Tee and Teck Whye; this is one of the biggest HDB estates, hence the large number of flats.
Choa Chu Kang still has a ways to go in building up its amenities though; despite its large size, there’s only Lot One and Junction 10 in terms of major retail.
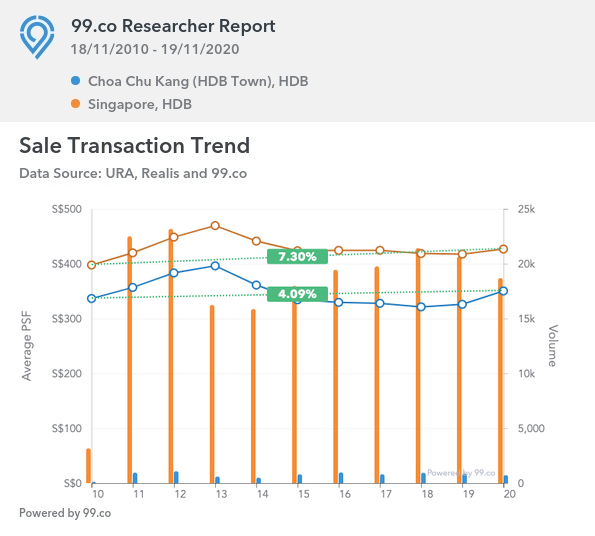
Prices in CCK have been on the up from 2019, averaging $350 psf in 2020 (perhaps it’s even the effect of more five-year old resale flats we’re seeing). This is far below the Singapore-wide average of $427 psf.
About Punggol
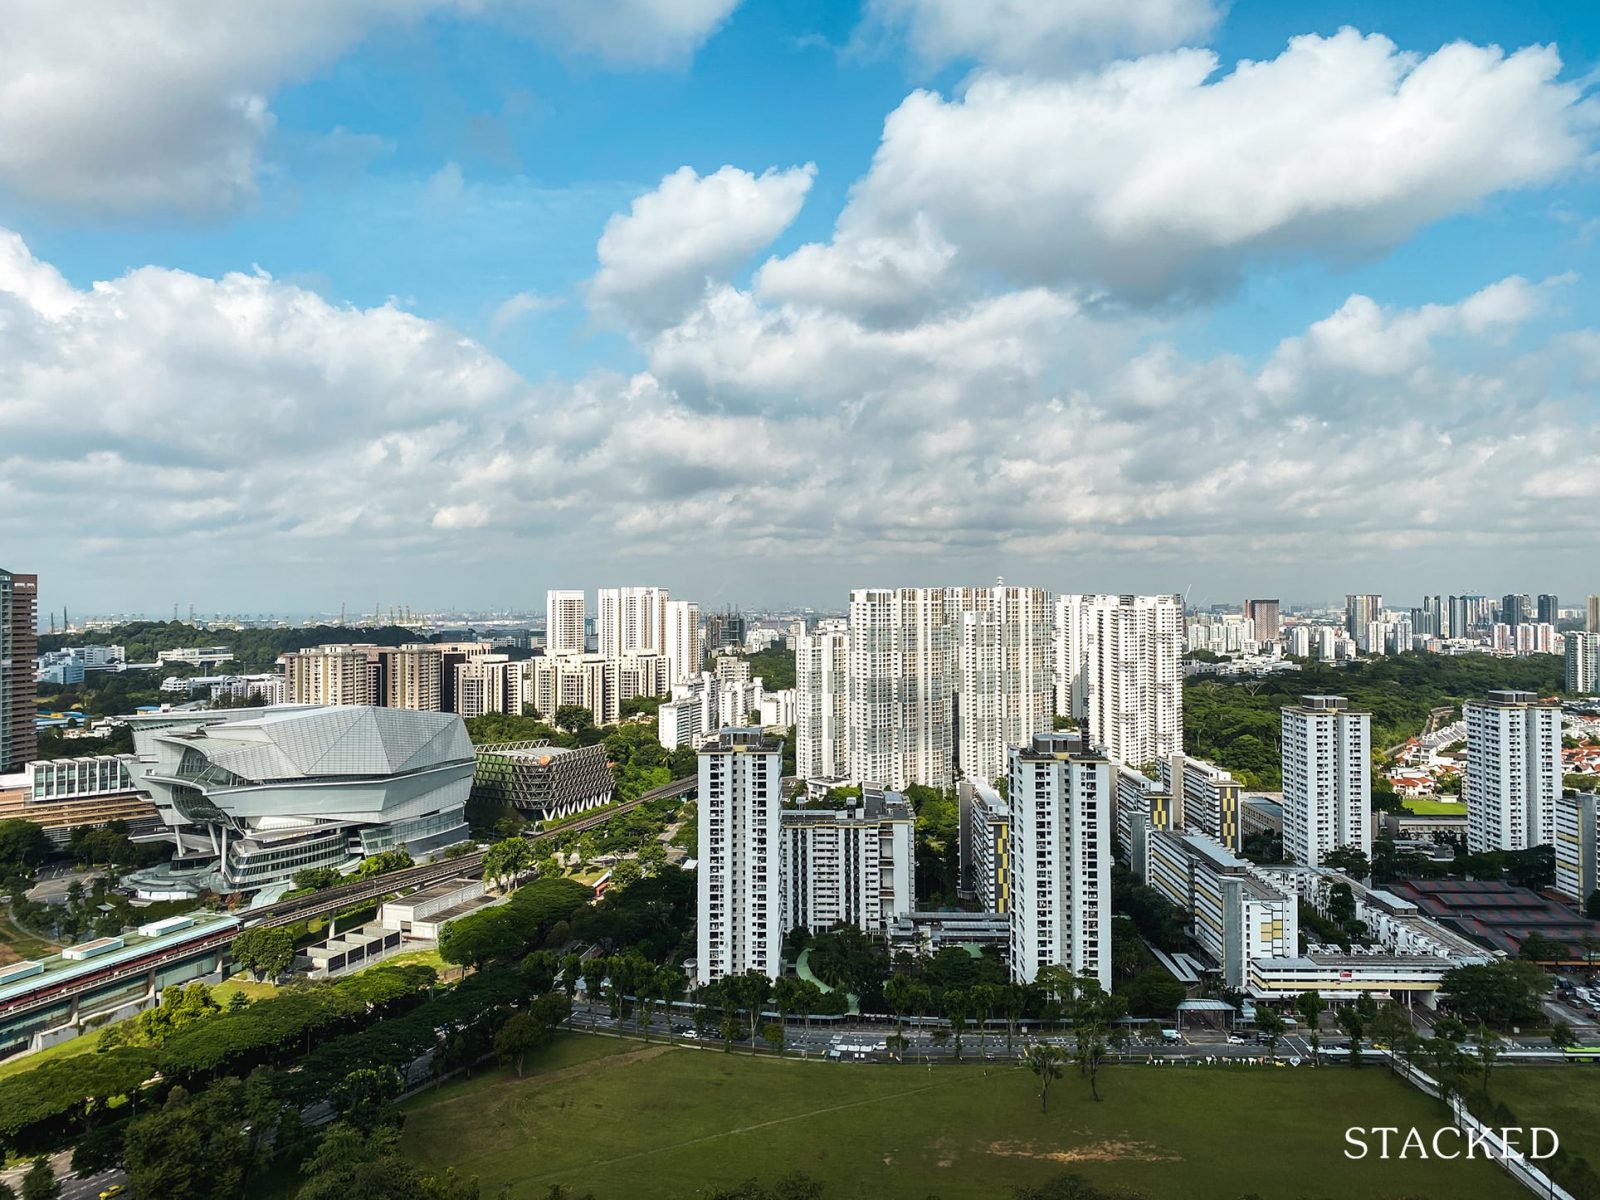
Punggol used to be one of the most inaccessible places in Singapore; so many Singaporeans were shocked to realise the extent of the transformation when Piermont Grand (Executive Condominium) launched in 2019.
An EC launching at around $1,107 psf, in supposedly “cheap” Punggol, has since changed perceptions of the area. Punggol Waterway and Coney Island now make up unique draws, which rival Bukit Timah in terms of outdoor amenities. Punggol is, in fact, Singapore’s first designated eco-town, with Punggol Waterway and Tree Trail @ Punggol being the first “sustainable waterfront towns”. The prospect of waterfront living might also draw buyers to the newly HDB MOP flats in the area.
This is all down to the fruition of the Punggol 21 Plus plan, which dates back to 2007.
The five-year old flats here are in a sweet spot: they have a long lease ahead of them, and they were built just as the best parts of waterfront living came about (sadly the older resale flats here had to suffer through more years of limited amenities).
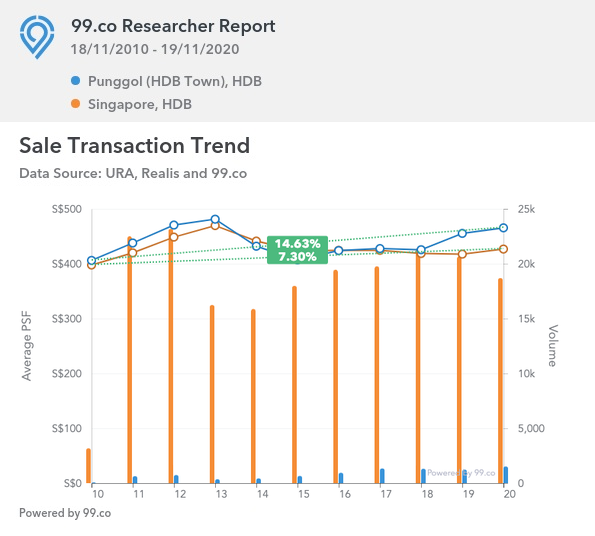
Flat prices in Punggol average $465 psf in 2020, higher than the island-wide average of $427 psf. Like we said, those who still think of Punggol as “ulu budget housing” should revisit the area.
Are you thinking of upgrading to a condo from your flat at some point? The best stepping stone may be a five-year old resale flat.
If you buy a BTO flat, you’ll need to wait three to five years for its completion, before your HDB MOP countdown starts. But buy a resale flat, and you only have five years to wait – you could be upgrading much sooner (or renting out the entire unit much sooner, if you need the added income).
Of course, this doesn’t mean you should just grab any resale flat; get some expert help in analysing the area first. You can contact us on Facebook for help; and follow us on Stacked for more tips and analysis on the property market.
At Stacked, we like to look beyond the headlines and surface-level numbers, and focus on how things play out in the real world.
If you’d like to discuss how this applies to your own circumstances, you can reach out for a one-to-one consultation here.
And if you simply have a question or want to share a thought, feel free to write to us at stories@stackedhomes.com — we read every message.
Frequently asked questions
How many HDB flats reached their MOP in Singapore between 2020 and 2021?
Which areas have the most new flats reaching MOP in 2020 and 2021?
Why are five-year-old flats entering the resale market considered desirable?
What are some benefits of buying flats that have just reached MOP?
How does the size of flats reaching MOP in 2020-2021 compare to older flats?
Ryan J. Ong
A seasoned content strategist with over 17 years in the real estate and financial journalism sectors, Ryan has built a reputation for transforming complex industry jargon into accessible knowledge. With a track record of writing and editing for leading financial platforms and publications, Ryan's expertise has been recognised across various media outlets. His role as a former content editor for 99.co and a co-host for CNA 938's Open House programme underscores his commitment to providing valuable insights into the property market.Need help with a property decision?
Speak to our team →Read next from Property Trends
Property Trends The Room That Changed the Most in Singapore Homes: What Happened to Our Kitchens?
Property Trends Condo vs HDB: The Estates With the Smallest (and Widest) Price Gaps

Property Trends Why Upgrading From An HDB Is Harder (And Riskier) Than It Was Since Covid
Property Trends Should You Wait For The Property Market To Dip? Here’s What Past Price Crashes In Singapore Show
Latest Posts
Pro River Modern Starts From $1.548M For A Two-Bedder — How Its Pricing Compares In River Valley
New Launch Condo Reviews River Modern Condo Review: A River-facing New Launch with Direct Access to Great World MRT Station
On The Market Here Are The Cheapest 5-Room HDB Flats Near An MRT You Can Still Buy From $550K






1 Comments
Hi Ryan,
Thanks for all the well thought and informative articles, always a fan. With 50k projected MOP next year as compared to the previous average of 9k. Would it mean that the supply would be more than demand for those who are planning to sell their MOPed HDB and may not fetch a good price?