The Essential Guide to Integrated Developments: An In-Depth Analysis of 14 Exclusive Projects
November 22, 2019
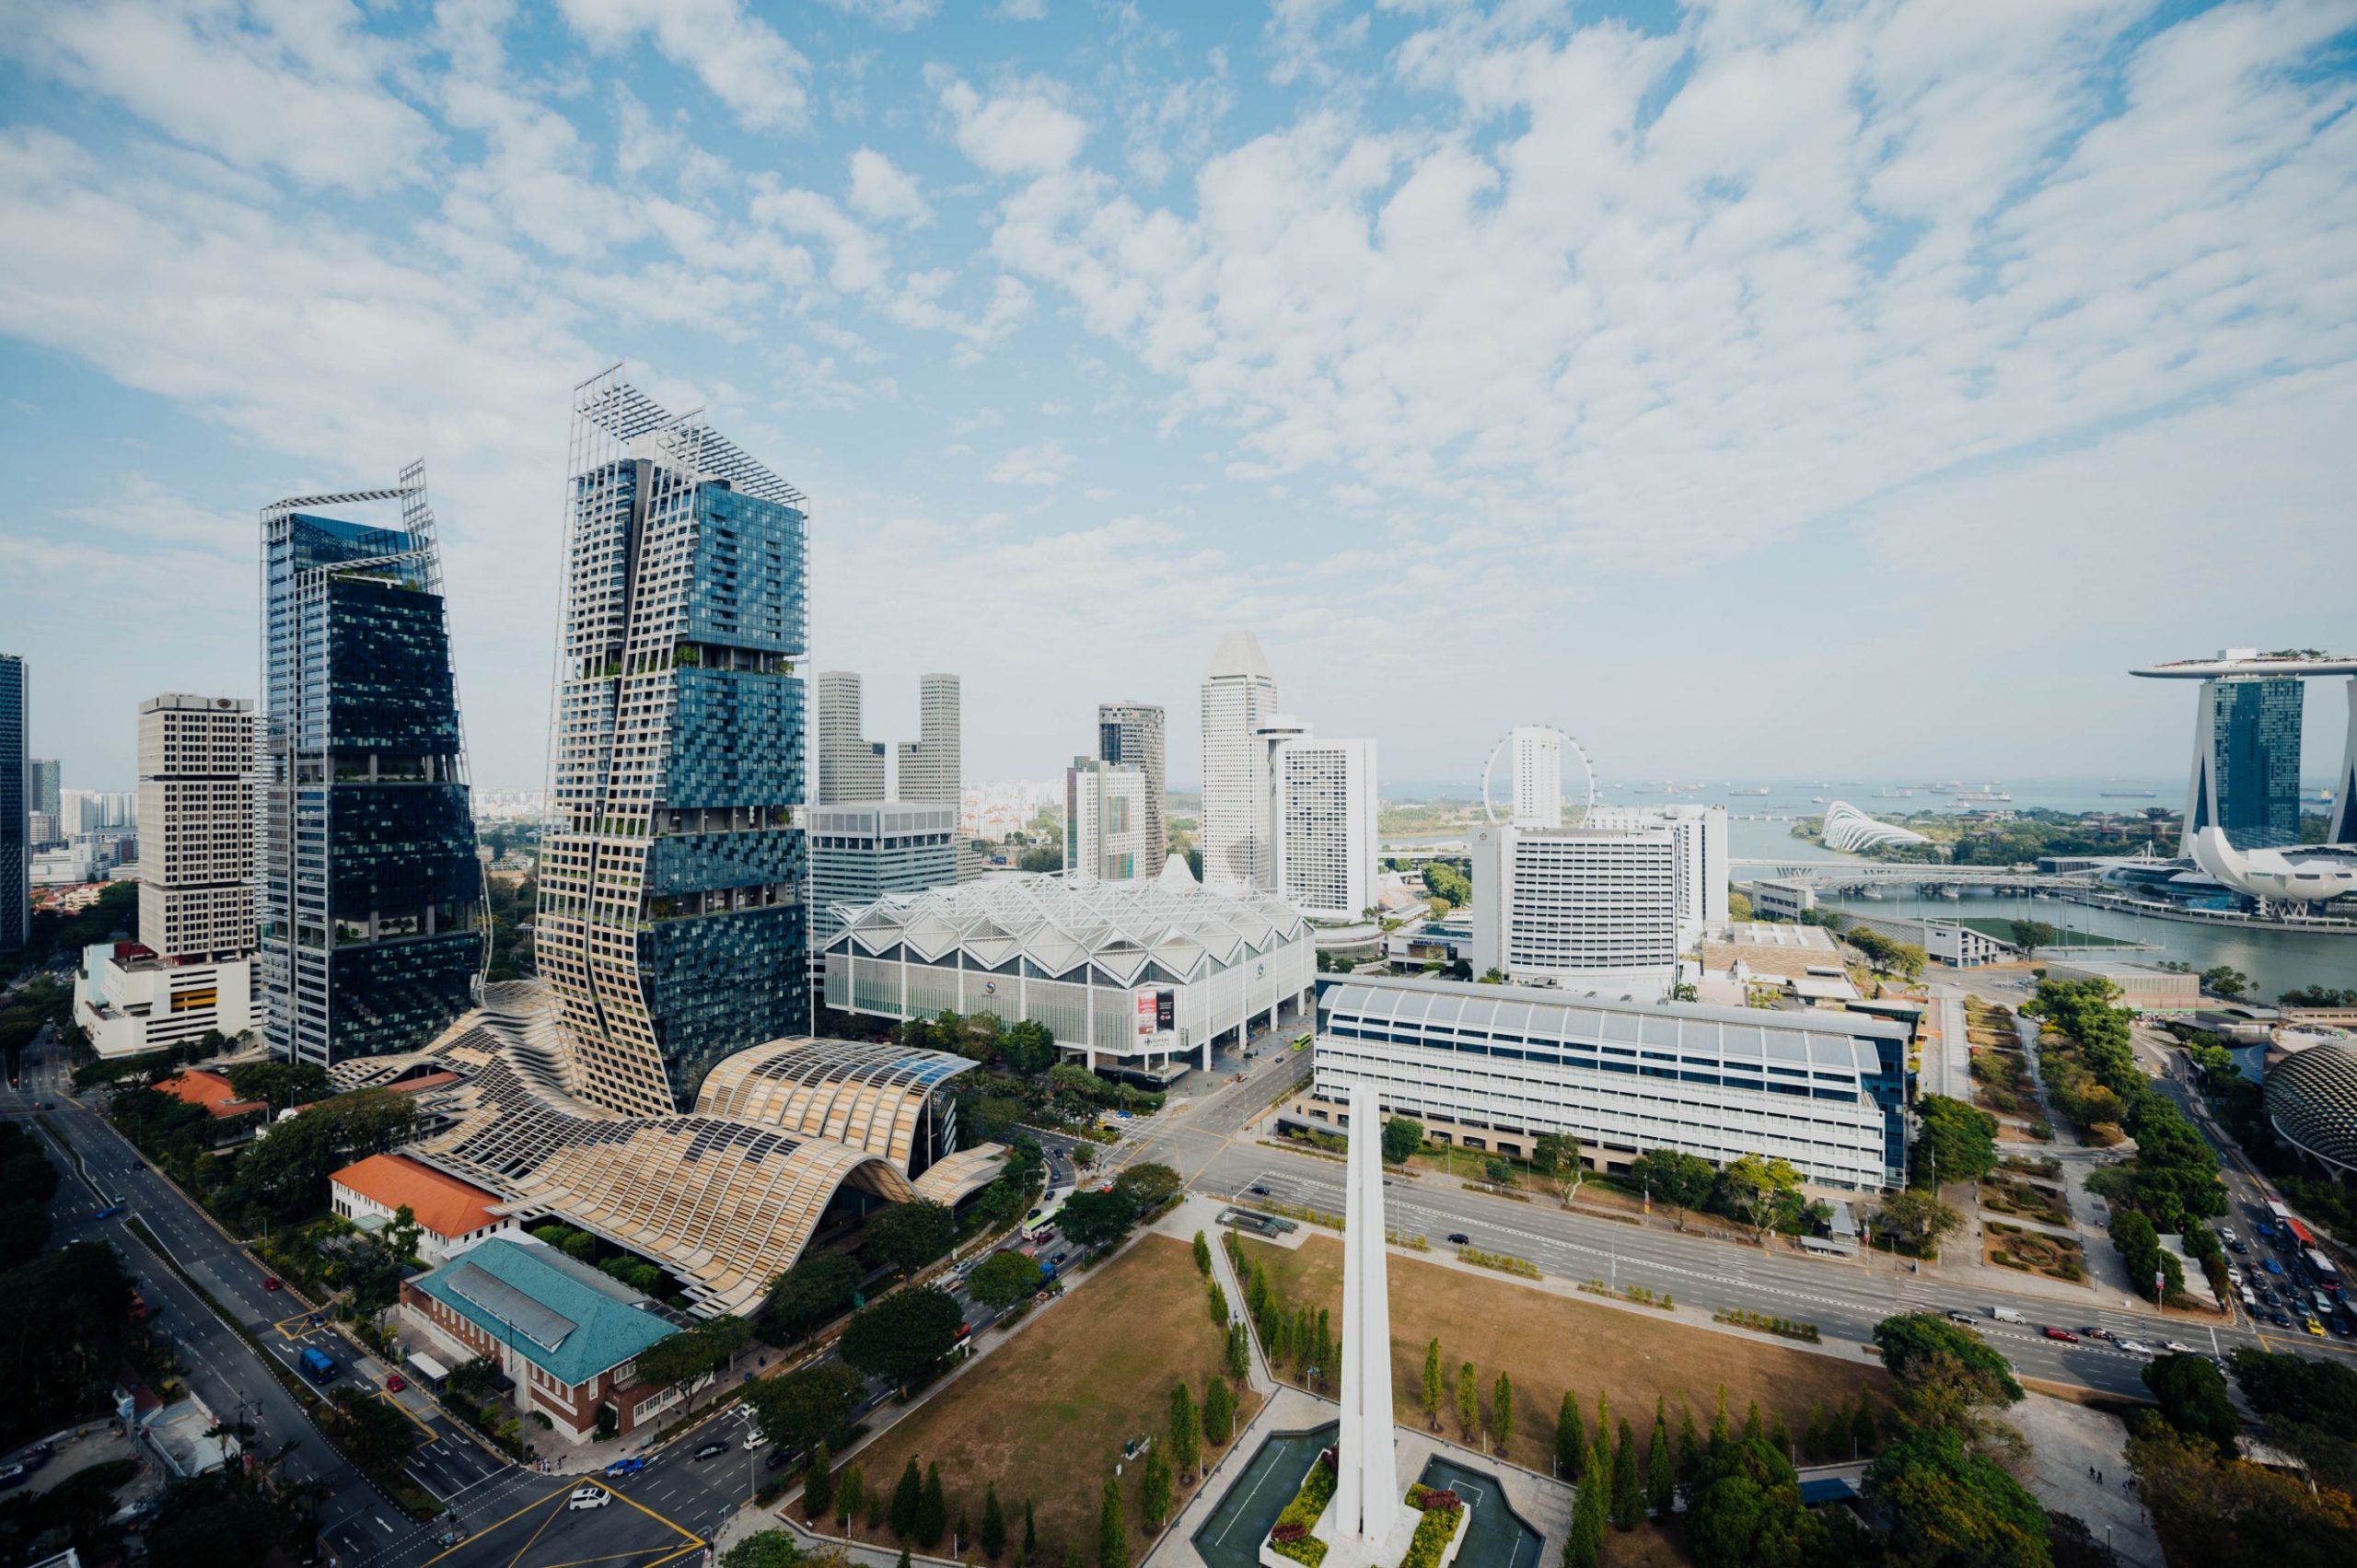
The Importance Of Integrated Developments
If you have read our latest review on Sengkang Grand Residences, you might have realised the lure of integrated developments.
You might have also realised that these guys are potential goldmines waiting to happen – especially if you’ve read about Compass Heights’ astonishing 137% appreciation statistic.
Let’s face it. People want good things.
And an integrated development unit is right up there on Singapore’s list of ‘good things’.
Why? Because these projects offer an all-in-one easy-access factor for their residents.
Transport. Entertainment. Work. Groceries. All of which are within immediate reach.
Think of integrated developments as a one-stop life hub that cuts out the downtimes. An emphasis on efficiency that gives you that extra bit of time that everyone in the rat race so craves.
Just look at the launch day of Capitaland’s Bedok Residences back in November 2011. It attracted such an interest that people were willing to actually queue overnight (in the scorching sun and pouring rain) just for a shot at a unit here!
Which brings us on to our next point.
‘When a good thing is hard to come by, people are willing to pay a premium for it.’
We’ve seen how units in these developments are in high demand from those who can afford them. And once people secure these units and the years roll by, their ease of life as a result of staying here generally makes them reluctant to sell their units.
Unless a solid offer comes by.
The result?
A phenomenon that allows most integrated developments to command a generally stabilised quantum through the years with chance of massive resale appreciation.
Content Breakdown
In lieu of the recent talk on integrated developments, we decided to explore the topic a little more.
Having painstakingly gathered stats from the various developments around Singapore, we will be individually analysing 14 different (ranked) integrated developments in the city based on their various stats such as appreciation figures and average monthly rental fees.
More importantly, we aim to highlight important (appreciation-related) factors/tips based on these analyses for you to consider when choosing future integrated developments.
Our goal: To ensure that you can make wise and informed decisions as a result of this knowledge should the need ever arise.
Our List of 14 Integrated Developments Ranked According To Their Appreciation Statistics:
14 – Woodleigh Residences (District 13)
| Project Name | Launch | TOP | Current Price (Average PSF) | Current Rental(Average PSF PM) |
| Woodleigh Residences | November 2018 | 2022 | $1,849 | |
| 8 @ Woodleigh | June 2009 | 2012 | $1,415 | $3.29 |
| Park Colonial | July 2018 | 2022 | $1,802 |
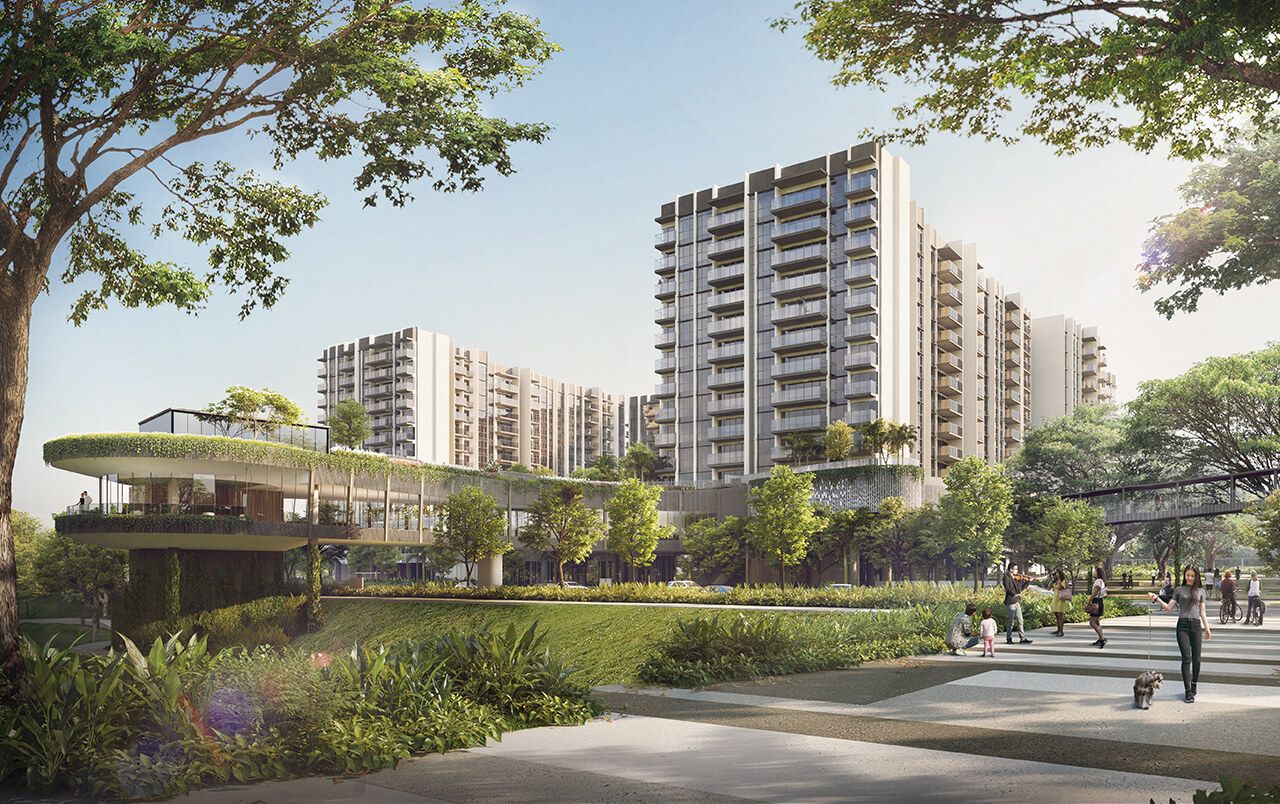
Woodleigh Residences has a shopping size of 161,640 sqft with 667 residential units. The condo’s quantum is currently 23.42% higher than the average district PSF of $1,416. Unfortunately, it has sustained an appreciation loss of -8.87% from $2,029 average PSF since its launch to $1,849 average current PSF.
Its competitors include Park Colonial and 8 @ Woodleigh. Because the former and Woodleigh Residences are both new launches, rental prices have not been drawn.
Analysis: It’s always interesting when a statistic goes against the grain. In this case, Woodleigh Residences’ -8.87% appreciation makes it only 1 of 3 integrated developments listed here that have not garnered positive appreciation.
The biggest reason for this? Strong competition from neighbouring developments, namely Park Colonial.
With better layouts overall, an earlier (July 2018 vs November 2018) and more ‘affordable’ launch price ($1,757 vs $2,029), it makes sense that the nearby Park Colonial also piqued the interests of potential Woodleigh Residences’ buyers and thus provided some competition.
More importantly, Park Colonial is also situated right next to the MRT, hence matching Woodleigh Residences in this very important regard.
Granted, it doesn’t have a shopping area of its own, but Park Colonial’s proximity to the upcoming Woodleigh Residences’ commercial space means easy access minus the noise.
Perhaps the icing on the cake in this intriguing appreciation loss analysis is that Woodleigh Residences is being developed by both Kajima and SPH – the latter undertaking a development project for the very first time hence its status as a greenhorn in the development sphere.
13 – The Poiz Residences (District 13)
| Project Name | Launch | TOP | Current Price (Average PSF) | Current Rental(Average PSF PM) |
| The Poiz Residences | Nov 2015 | 2018 | $1,388 | $4.37 |
| Nin Residence | Dec 2010 | 2014 | $1,416 | $3.43 |
| Sennett Residence | March 2013 | 2016 | $1,365 | $3.80 |
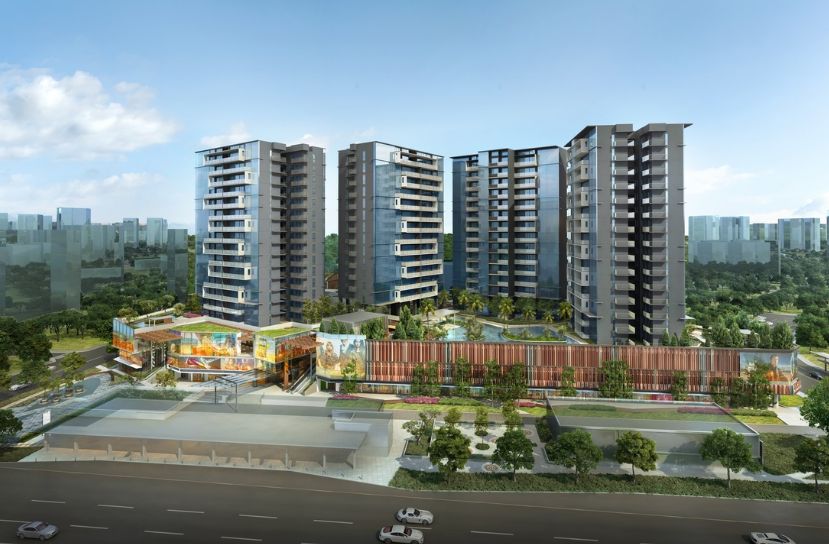
The Poiz Residences has a shopping size of 50,000 sqft with 731 residential units. The condo’s quantum is currently -1.95% lower than the average district PSF of $1,415. It has also sustained an appreciation loss of -3.88% from $1,444 average PSF to $1,388 average current PSF. Its current rental (average PSF pm) of $4.37 is 37.53% more than the current average district rental of $2.73.
Its competitors include Nin Residence and Sennett Residence.
Analysis: The case of the Poiz Residences is extremely intriguing, yet it does present itself as a wonderful investment opportunity with room for valuation growth.
For those who haven’t heard of the term ‘city fringe’, it basically means that this particular development is located very close to (and not actually in) the city. The closer a project is to the city fringe, usually the higher the valuation of this project.
…Which is why it is intriguing that The Poiz Residence is currently commanding a $1,388 average psf quantum as compared to other ‘further’ developments like Sengkang Grand Residences ($1,746 average psf) and the above-mentioned Woodleigh Residences’ ($1,849 average psf).
More so when you realise that it is within immediate driving distance of Upper Serangoon Road and the PIE!
Perhaps it is the noise factor, or maybe its smaller-than-average retail size of 50,000 sqft coupled with it being 1 MRT stop further from Serangoon MRT (North-East and Circle Line) as compared with Woodleigh Residences.
Either way, there is definitely room for valuation increase here – and at its current quantum, represents great value for buyers.
12 – Park Place Residences (District 14)

| Project Name | Launch | TOP | Current Price (Average PSF) | Current Rental(Average PSF PM) |
| Park Place Residences | March 2017 | 2020 | $1,751 | – |
| Sims Residences | Sept 2008 | 2002 | $862 | $2.23 |
| Katong Regency | May 2012 | 2015 | $1,570 | $4.15 |
Park Place Residences has a shopping size of 470,813 sqft with 429 residential units. The condo’s quantum is currently 23.76% higher than the average district psf of $1,335. It is the last of the 14 integrated developments to have sustained an appreciation loss of -2.99% from $1,805 average psf since its launch to $1,751 average current psf.
Its competitors include Sims Residences and Katong Regency. Because Park Place Residences is a new, rental prices have not been drawn from it as yet.
Analysis: Park Place Residences’ novelty in a well-developed estate with multiple malls should ensure a relatively stable quantum with slight potential for valuation increase through the years. More so when it is the only condo that is actually within ‘immediate distance’ of these malls.
The reason why ‘slight’ isn’t ‘high’ is the fact that similar to Woodleigh Residences, Park Place Residences also faces stiff competition from its neighbours. New factors that have been thrown into the mix – project tenure and project diversities.
If you were to look at the other ‘newer’ condos surrounding Park Place Residences (eg. D’Weave/Park 1 Suites), you’ll realise that just like Katong Regency, they are all freehold properties. And as we know, freehold properties tend to keep their valuation for a longer period than their leasehold counterparts hence our project’s ‘inferiority’.
Furthermore, the presence of older (and cheaper) developments in the form of Sims Residences, Paya Lebar Residences and Grand Link Square that are within walking (although not immediate) proximity of the MRT and commercial spaces will provide a third and more feasible option to potential buyers of Park Place Residences with a disciplined budget.
11 – Wallich Residence (District 2)
| Project Name | Launch | TOP | Current Price (Average PSF) | Current Rental(Average PSF PM) |
| Wallich Residence | Dec 2013 | 2017 | $3,594 | $8.89 |
| Altez | Feb 2010 | 2014 | $2,210 | $6 |
| Skysuites @ Anson | March 2011 | 2014 | $2,115 | $6.90 |
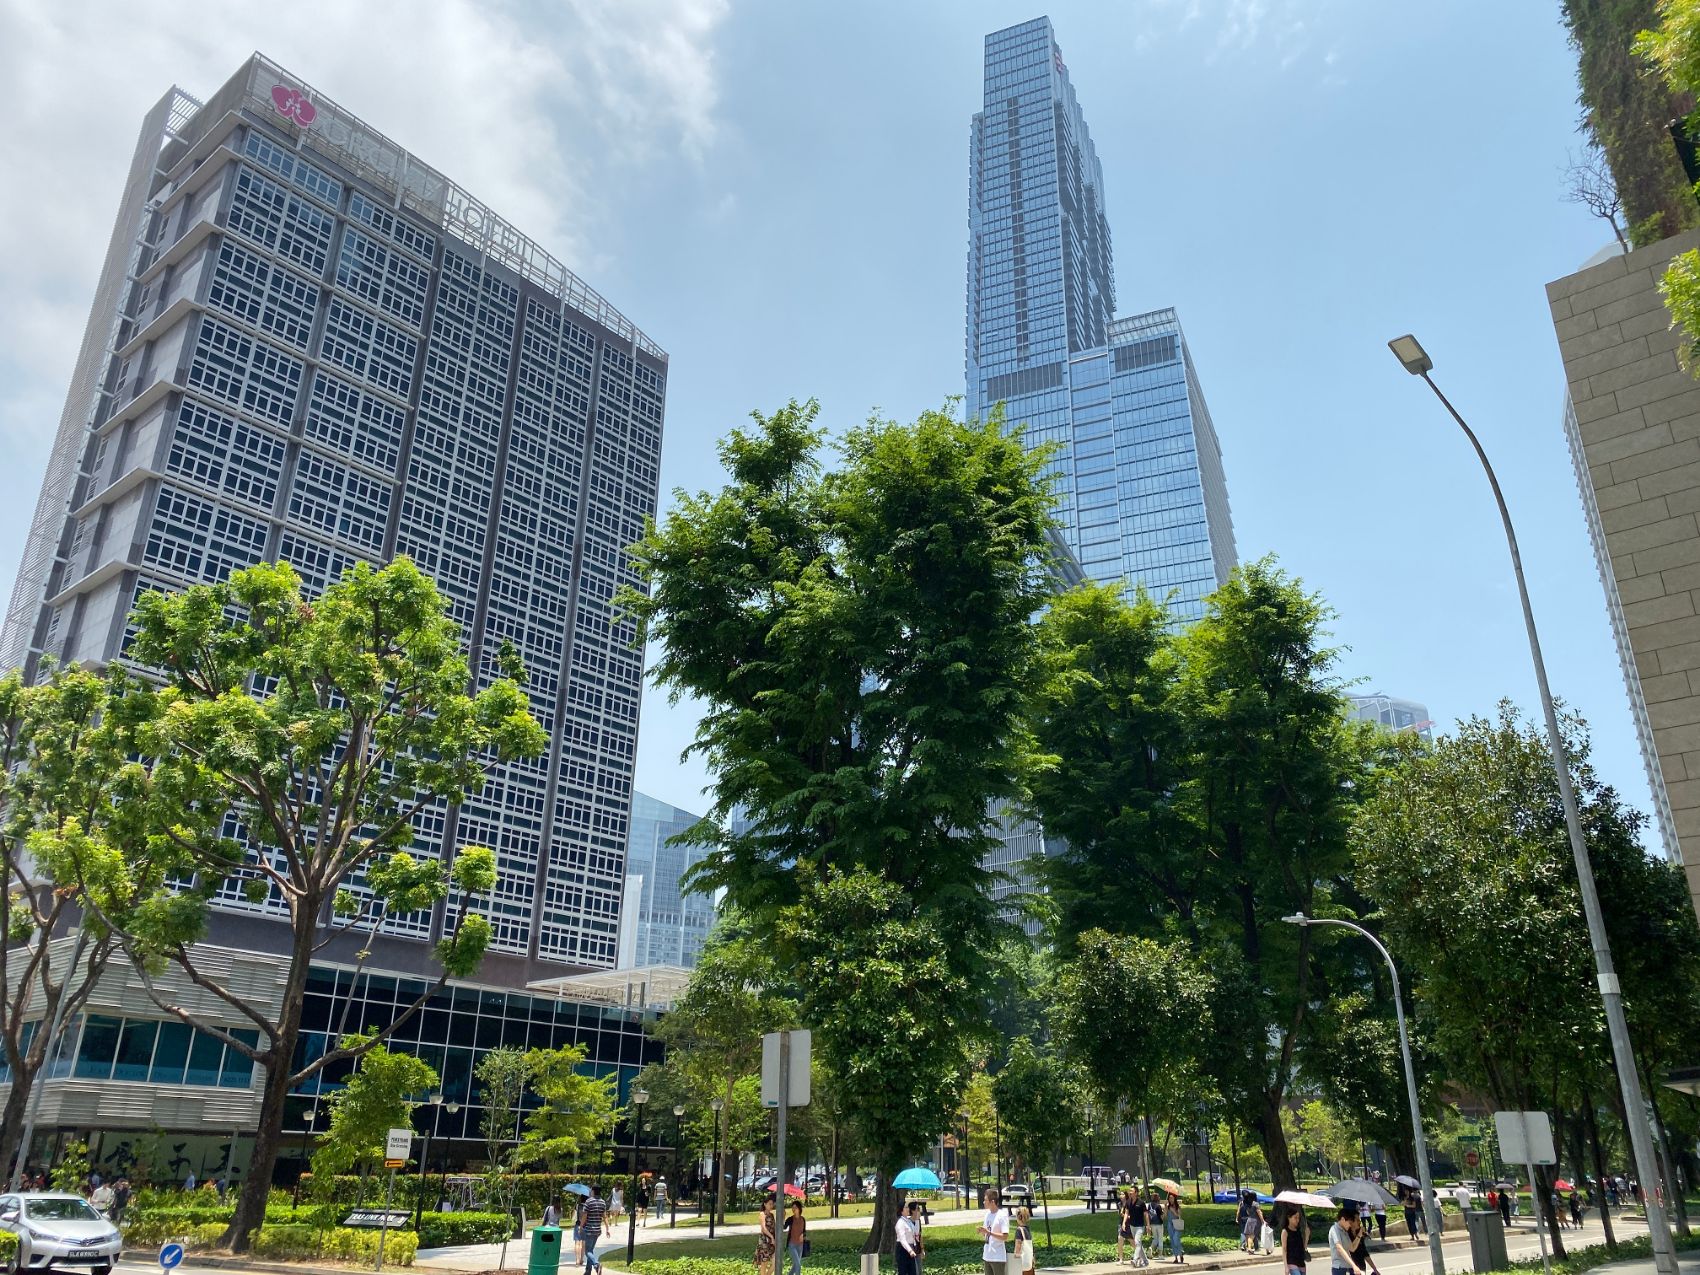
Wallich Residence has a shopping size of 100,000 sqft with 181 residential units. The condo’s quantum is currently 43.10% higher than the average district PSF of $2,045. It has garnered an appreciation increase of 3.63% from $3,468 average PSF since its launch to $3,594 average current PSF (despite its massive valuation). Its current rental (average PSF pm) of $8.89 is 41.96% more than the current average district rental of $5.16.
Its competitors include Altez and Skysuites @ Anson.
Analysis: Our first positive appreciator is also the tallest residential building in Singapore – and as many of you already know, harbours the biggest penthouse currently available in Singapore.
While we aren’t going to go into details, James Dyson’s purchase of this incredible unit (if you can even call it that) has brought international renown to the development. Naturally, fame would incite a valuation rise – especially in a luxury condo of this stature where its buyers aren’t usually limited by quantum.
It is an extremely rare circumstance and although we aren’t looking at too many repeats, it is worth noting the power of fame on the quantum of high-end developments in general.
Another point worth noting is that it is the only residential development within a sizable immediate area hence its ability to command a solid quantum (and even appreciate) alongside its famed, luxury status.
10 – South Beach Residences (District 7)
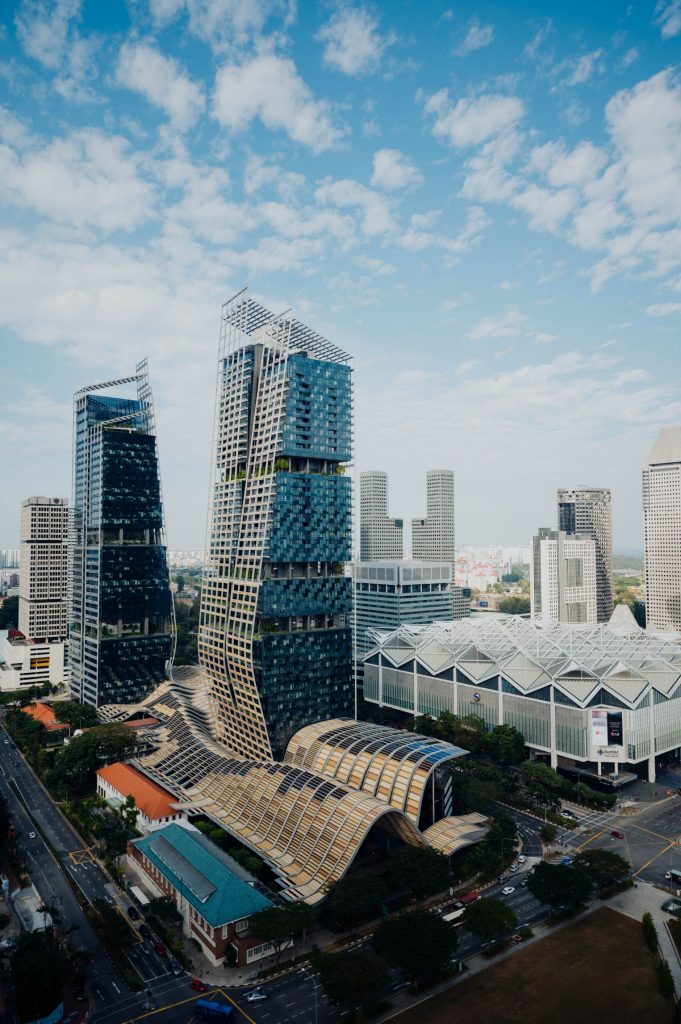
| Project Name | Launch | TOP | Current Price (Average PSF) | Current Rental(Average PSF PM) |
| South Beach Residences | Sep 2018 | 2016 | $3,335 | $8.21 |
South Beach Residences has a shopping size of 37,000 sqft with 190 residential units. The condo’s quantum is currently 37.18% higher than the average district PSF of $2,095. It has garnered an appreciation increase of 5.40% from $3,164 average PSF since its launch to $3,335 average current PSF. Its current rental (average PSF pm) of $8.21 is 45.80% more than the current average district rental of $4.45.
It doesn’t have any main competitors.
Analysis: Another quantum powerhouse, South Beach Residences has almost no immediate competitors save partially for the upcoming Midtown Bay ‘extravaganza’. As far as luxury status combined with immediate access to Esplanade MRT goes, there is none. In fact, if you were to look at the number of condos in this area of district 7, you’d be hard-pressed to find a handful of them.
Add in the point that it is within walking proximity to one of Singapore’s most sought-after grade-A office towers districts in the Suntec area, and you’d understand how the project can command such a price.
It also allows for the condo to put forth an incredible rental quantum of $8.21 psf pm due to solid demand from well-heeled expats with a penchant for convenience and luxury and are naturally working in the area.
Unsurprisingly, its rental quantum stands at a whopping 45.8% more than the district average, making it the highest amongst all integrated developments in Singapore.
9 – Bedok Residences (District 16)

| Project Name | Launch | TOP | Current Price (Average PSF) | Current Rental(Average PSF PM) |
| Bedok Residences | Dec 2011 | 2015 | $1,435 | $4.03 |
Bedok Residences has a shopping size of 222,463 sqft with 583 residential units. The condo’s quantum is currently 13.80% higher than the average district PSF of $1,237. It has garnered an appreciation increase of 6.53% from $1,347 average PSF since its launch to $1,435 average current PSF. Its current rental (average PSF pm) of $4.03 is 34.24% more than the current average district rental of $2.65.
It doesn’t have any main competitors.
Analysis: You read earlier about how people were queueing overnight just for a chance at a unit here and how those that came a little later were left disappointed.
So why the crazy demand for Bedok Residences?
Firstly, the condo is situated in an older estate that many are familiar and extremely attached to. The estate’s age also means it comes with well developed amenities in the area. Add in a string of malls, food courts and grocery options in the immediacy of Bedok Residences, and it is no wonder that demand here was and still continues to be so high.
Secondly (and perhaps the bigger reason for the high demand) is the condo’s lack of competition. With no other immediate condo options to choose from, Bedok Residences is able to command its solid price tag and even positively appreciate despite its current average psf standing at 13.8% higher than the average quantum of other developments in the district.
Talk about king of the (urban) jungle!
8 – Duo Residences (District 7)
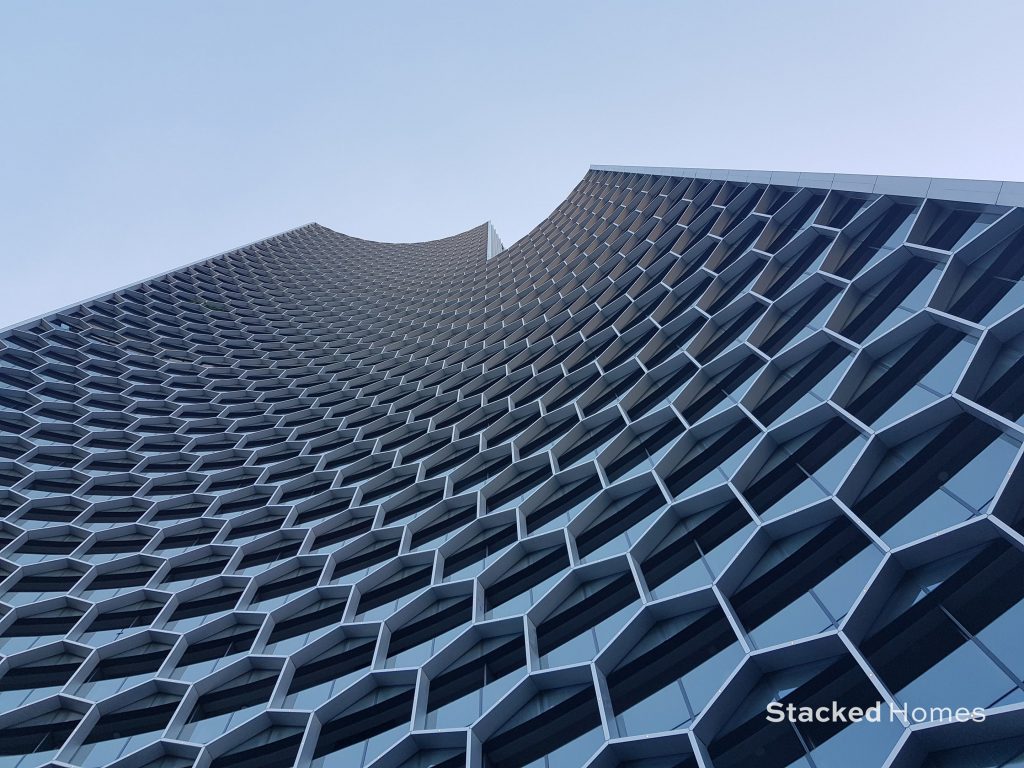
| Project Name | Launch | TOP | Current Price (Average PSF) | Current Rental(Average PSF PM) |
| Duo Residences | Nov 2013 | 2017 | $2,114 | $5.75 |
| The Plaza | March 1995 | 1979 | $1,139 | $3.30 |
| Concourse Skyline | Sep 2008 | 2014 | $2,160 | $4.40 |
Duo Residences has a shopping size of 56,000 sqft with 660 residential units. The condo’s quantum is currently 0.90% higher than the average district PSF of $2,095. It has garnered an appreciation increase of 7.15% from $1,973 average PSF since its launch to $2,114 average current PSF. Its current rental (average PSF pm) of $5.75 is 22.61% more than the current average district rental of $4.45.
Its competitors include The Plaza and Concourse Skyline.
Analysis: Perhaps there is more than one reason as to why Duo Residences is termed as such…
Built by M&S, its status as a collaboration between Malaysia and Singapore removes any room for failure – hence quality assurance and quantum stabilisation in that regard for its residents.
At its time of launch in November 2013, it made the news as one of the first to occupy the glamorous and otherwise ‘un-residential-touched’ District 7. The lack of competition and allure of a residential development in such an area at that time allowed it to command such a premium.
As the years rolled on and news of other more expensive developments begin to surface alongside upgrades to the Bugis shopping and entertainment-belt, Duo Residences naturally climbed in its quantum.
The fact that there is a grade-A office tower next to it also ensures that rental yields here are unsurprisingly higher than that of the average district while still promising relative price stability to its investors (eg. no rent-related quantum crashes overnight).
7 – Hillion Residences (District 23)
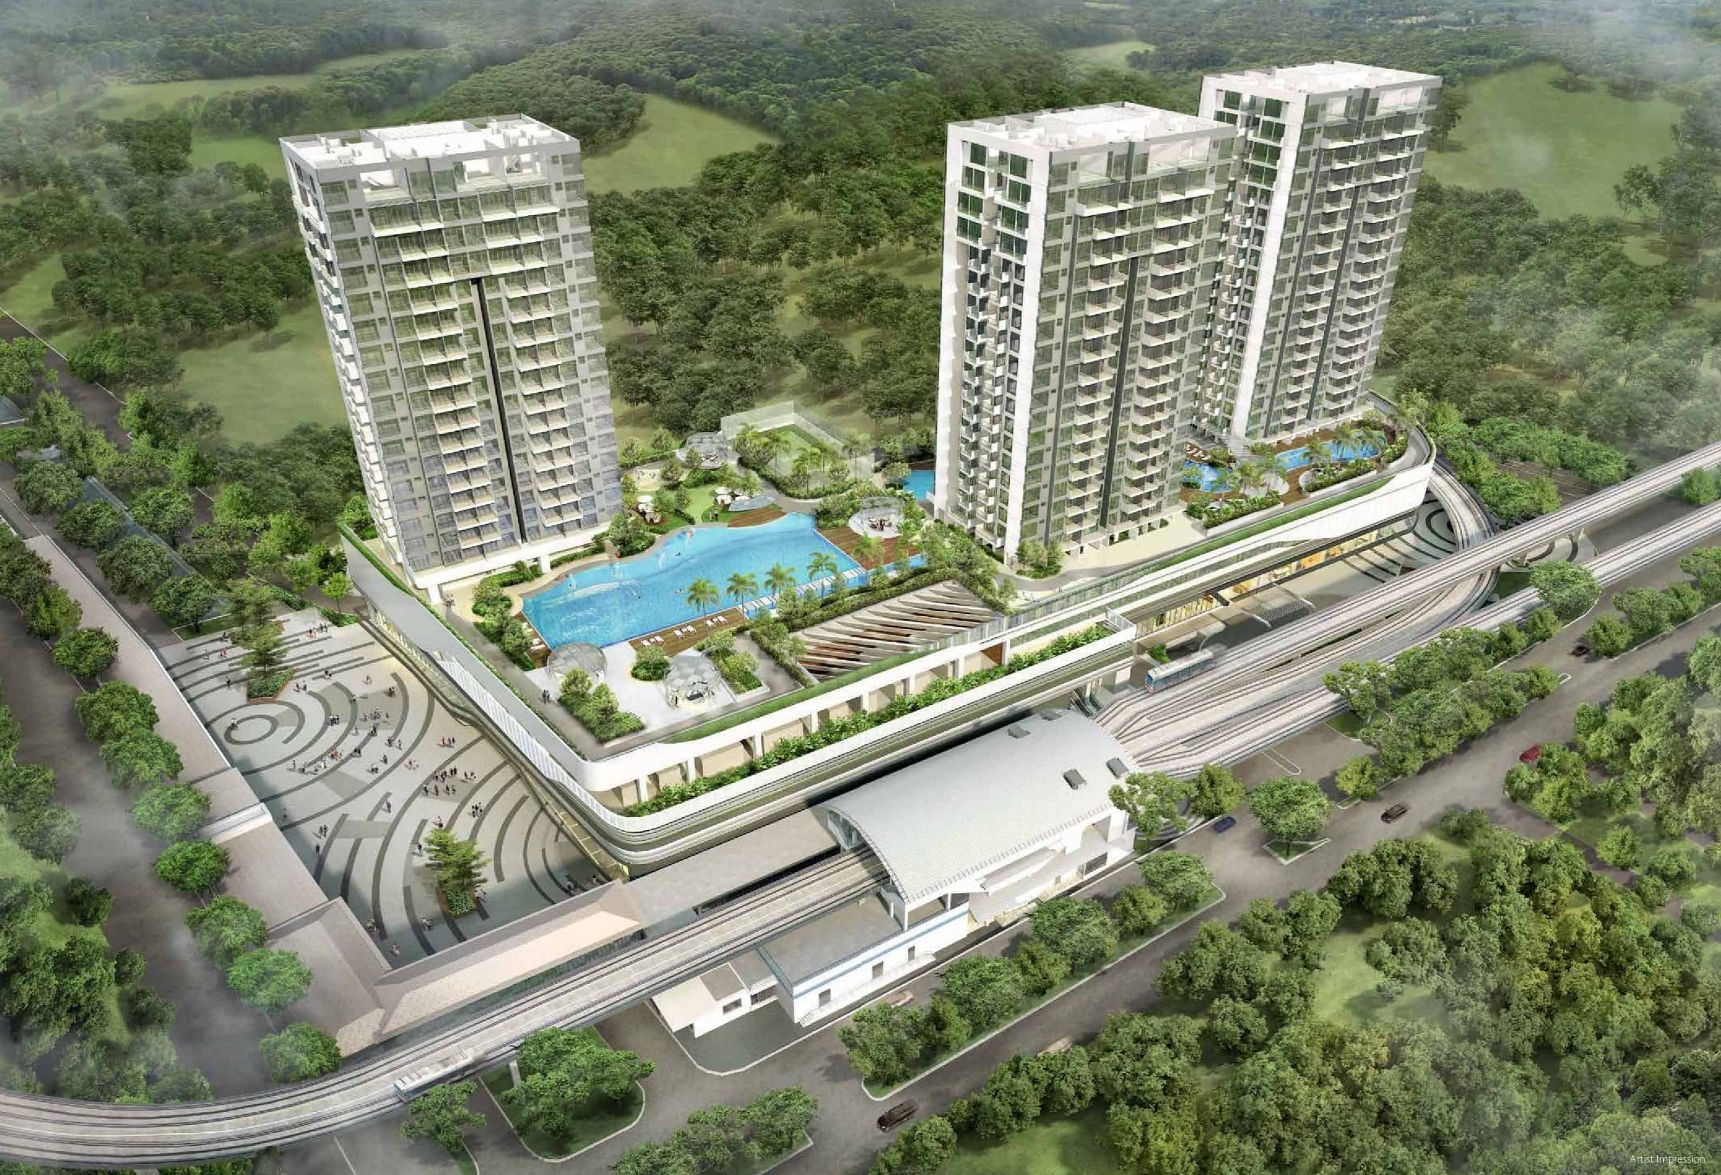
| Project Name | Launch | TOP | Current Price (Average PSF) | Current Rental(Average PSF PM) |
| Hillion Residences | March 2013 | 2017 | $1,480 | $3.93 |
| Maysprings | April 1996 | 1998 | $857 | $2.20 |
| The Tennery | Jan 2011 | 2014 | $1,143 | $2.90 |
Hillion Residences has a shopping size of 174,730 sqft with 546 residential units. The condo’s quantum is currently 19.26% higher than the average district PSF of $1,195. It has garnered an appreciation increase of 10.37% from $1,341 average PSF since its launch to $1,480 average current PSF. Its current rental (average PSF pm) of $3.93 is 41.22% more than the current average district rental of$2.31.
Its competitors include Maysprings and The Tennery.
Analysis: By now, you would have observed the importance of competition to an integrated condo’s quantum.
Hillion Residences is no different.
It also has the privilege of sitting atop the more ‘exclusive’ Hillion Mall as compared to its counterpart, The Tennery – which peers out from above the much older Junction 10 mall. Factor in its better proximity to Bukit Panjang MRT and it is no wonder that Hillion Residences commands a better quantum.
With upgrades to the Bukit Panjang LRT also underway in a rapidly developing estate, its 10.37% appreciation statistic over the last 6 years definitely makes sense.
Granted, there will always be a cheaper albeit older alternative in Maysprings, but for now its presence only further adds to the allure of novelty that emits from the Hillion Residences.
6 – Watertown (District 19)
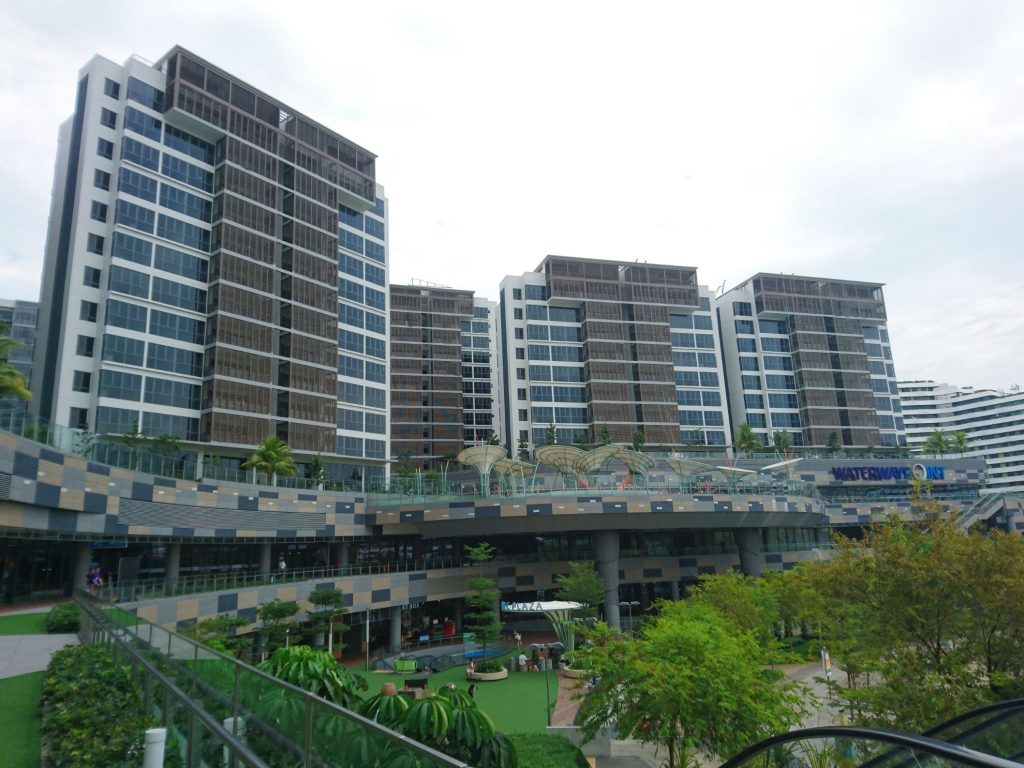
| Project Name | Launch | TOP | Current Price (Average PSF) | Current Rental(Average PSF PM) |
| Watertown | Jan 2012 | 2017 | $1,338 | $3.39 |
| A Treasure Trove | Sep 2011 | 2015 | $1,075 | $2.70 |
| Parc Centros | July 2012 | 2016 | $1,221 | $3.10 |
Watertown has a shopping size of 370,824 sqft with 992 residential units. The condo’s quantum is currently 3.66% higher than the average district PSF of $1,289. It has garnered an appreciation increase of 12.06% from $1,194 average PSF since its launch to $1,338 average current PSF. Its current rental (average PSF pm) of $3.39 is 25.96% more than the current average district rental of $2.51.
Its competitors include A Treasure Trove and Parc Centros.
Analysis: In our recent article of the top 22 HDB flat appreciators scattered around Singapore, we had to analyse 10 different flats in the Punggol district.
Now why are we talking about this?
Because those who sold BTO flats post-MOP and made some cash would naturally be looking at an upgrade to condo developments – especially one that has all the convenience that Watertown has to offer.
Yes, it does have rather strong competition from its surrounding condos like Parc Centros – which by the way has a relatively similar quantum to Watertown (it’s average psf difference from the other condos in the district is a mere 3.66%).
But if you consider Punggol’s status as an up-and-comer with the addition of the Punggol Digital District and the increasing demand for the waterfront and nature lifestyle, you’ll understand that Punggol’s Watertown’s 12.06% appreciation in the last 9 years might just be the beginning of something bigger.
5 – Marina One Residences (District 1)
| Project Name | Launch | TOP | Current Price (Average PSF) | Current Rental(Average PSF PM) |
| Marina One Residences | Oct 2014 | 2017 | $2,575 | $5.22 |
| Marina Bay Residences | Dec 2006 | 2010 | $2,608 | $5.65 |
| Marina Bay Suites | Dec 2009 | 2013 | $1,864 | $4.32 |
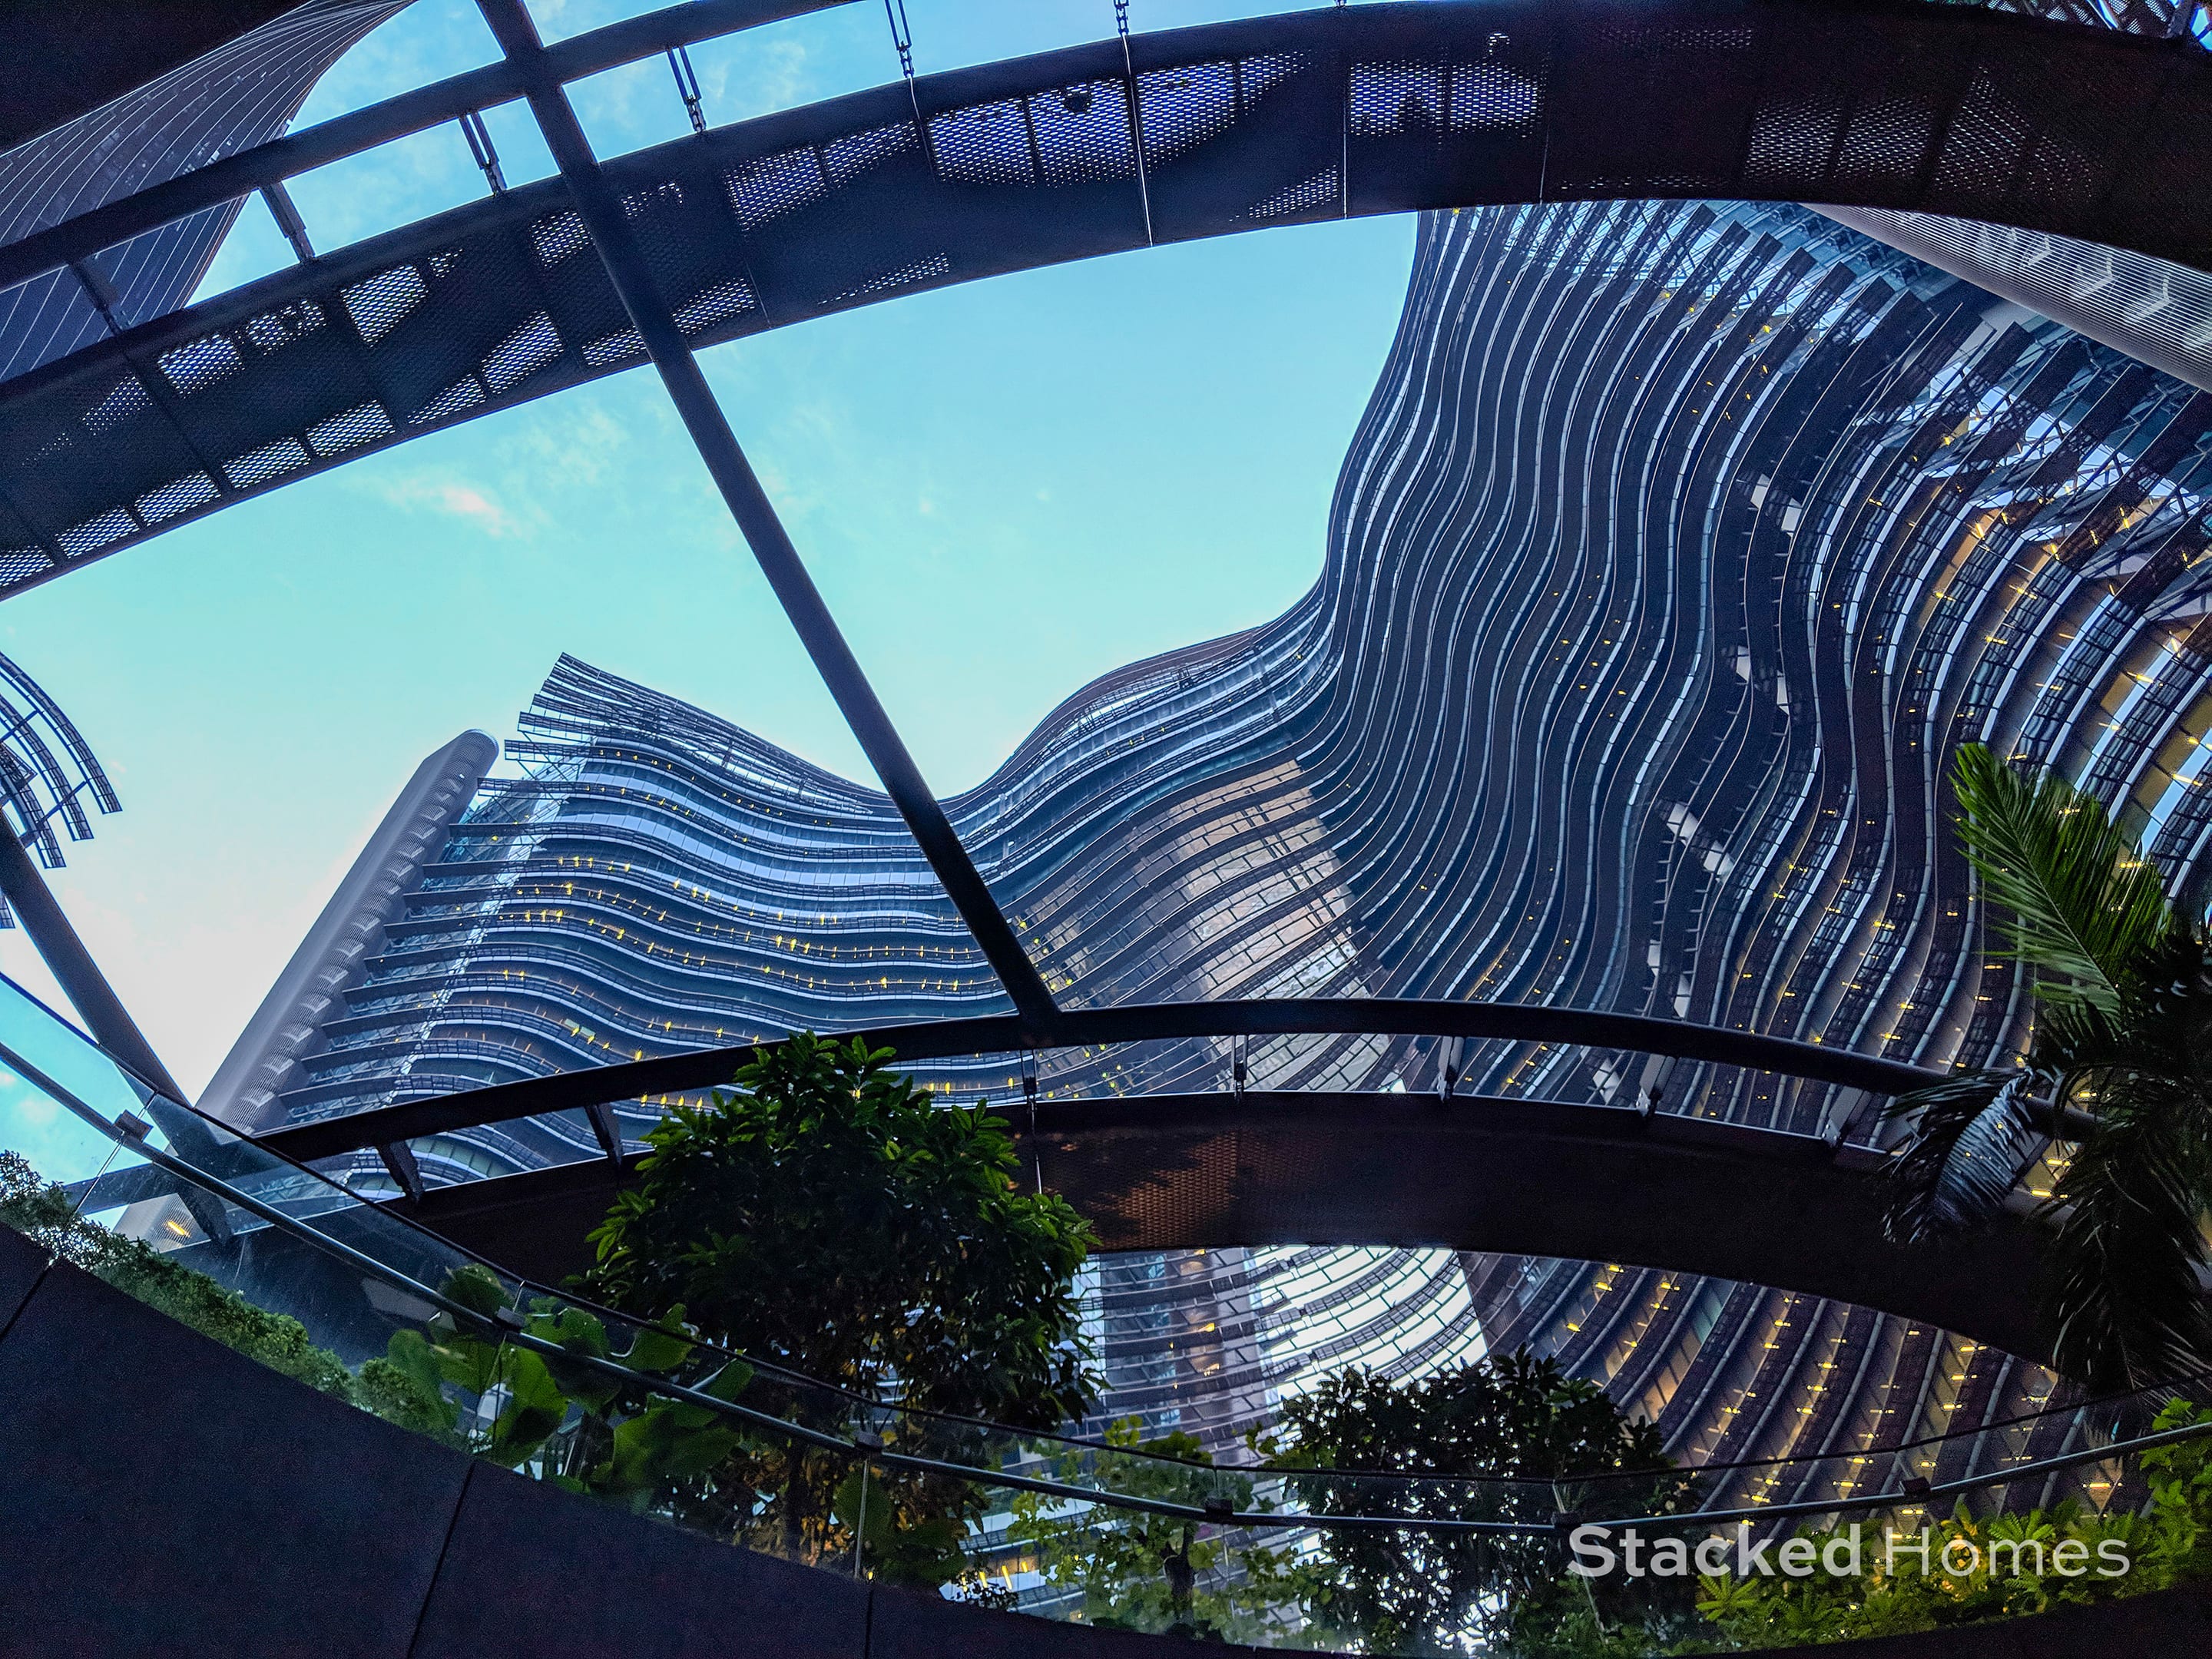
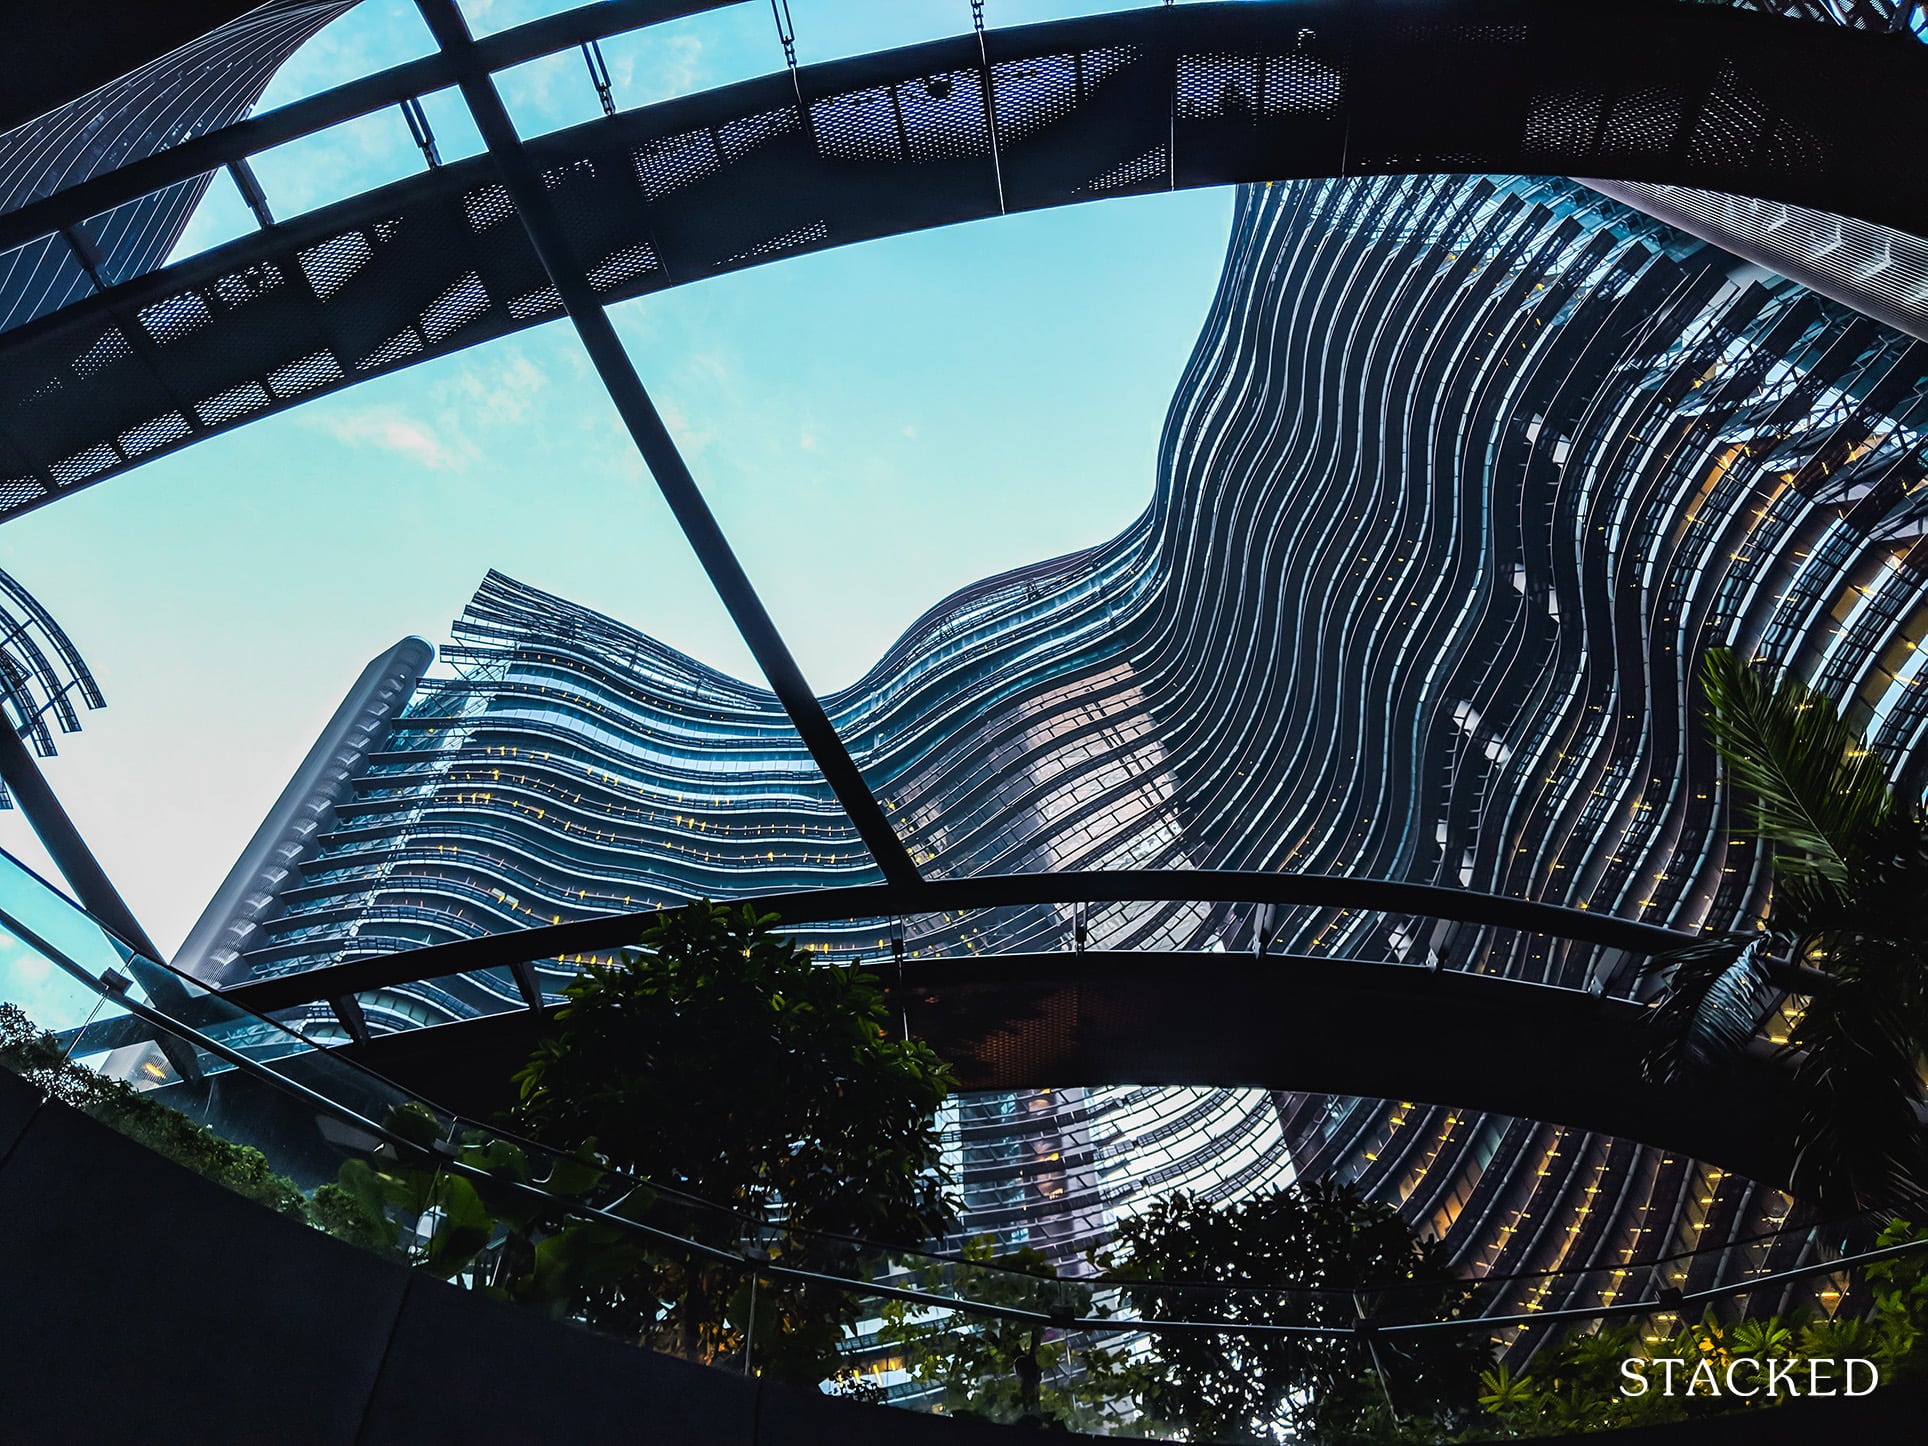
Marina One Residences has a shopping size of 140,000 sqft with 1042 residential units. The condo’s quantum is currently 18.45% higher than the average district PSF of $2,100. It has garnered an appreciation increase of 14.65% from $2,246 average PSF since its launch to $2,575 average current PSF. Its current rental (average PSF pm) of $5.22 is 10.34%% more than the current average district rental of $4.68.
Condo ReviewsMarina One Residences Review: Stunning Hideaway in the CBD
by Reuben DhanarajIts competitors include Marina Bay Residences and Marina Bay Suites.
Analysis: Very similar to Duo Residence in more regard than one, Marina One Residences was also built by M&S – a factor that no doubt pinned high hopes on the project with little room to disappoint.
Situated in an area where Singapore’s tourism appeal resonates, it is also a ‘work hot-spot’ given the Marina One Residences’ locale in the CBD and the presence of its 2 integrated 30-storey grade-A commercial towers (that are occupied by powerful companies) in the immediate vicinity.
An unparalleled proximity to 3 different MRT lines further helps its cause alongside the fact that there are no current adjacent condo developments to Marina One Residences’, and hence a lack in current competition.
What’s more, because of the amount of surrounding land that has yet to been released, we can definitely see the potential of owning a unit here from a further appreciation standpoint past the 14.65% valuation increase we now witness.
4 – North Park Residences (District 27)
| Project Name | Launch | TOP | Current Price (Average PSF) | Current Rental(Average PSF PM) |
| North Park Residences | April 2015 | 2018 | $1,576 | $3.49 |
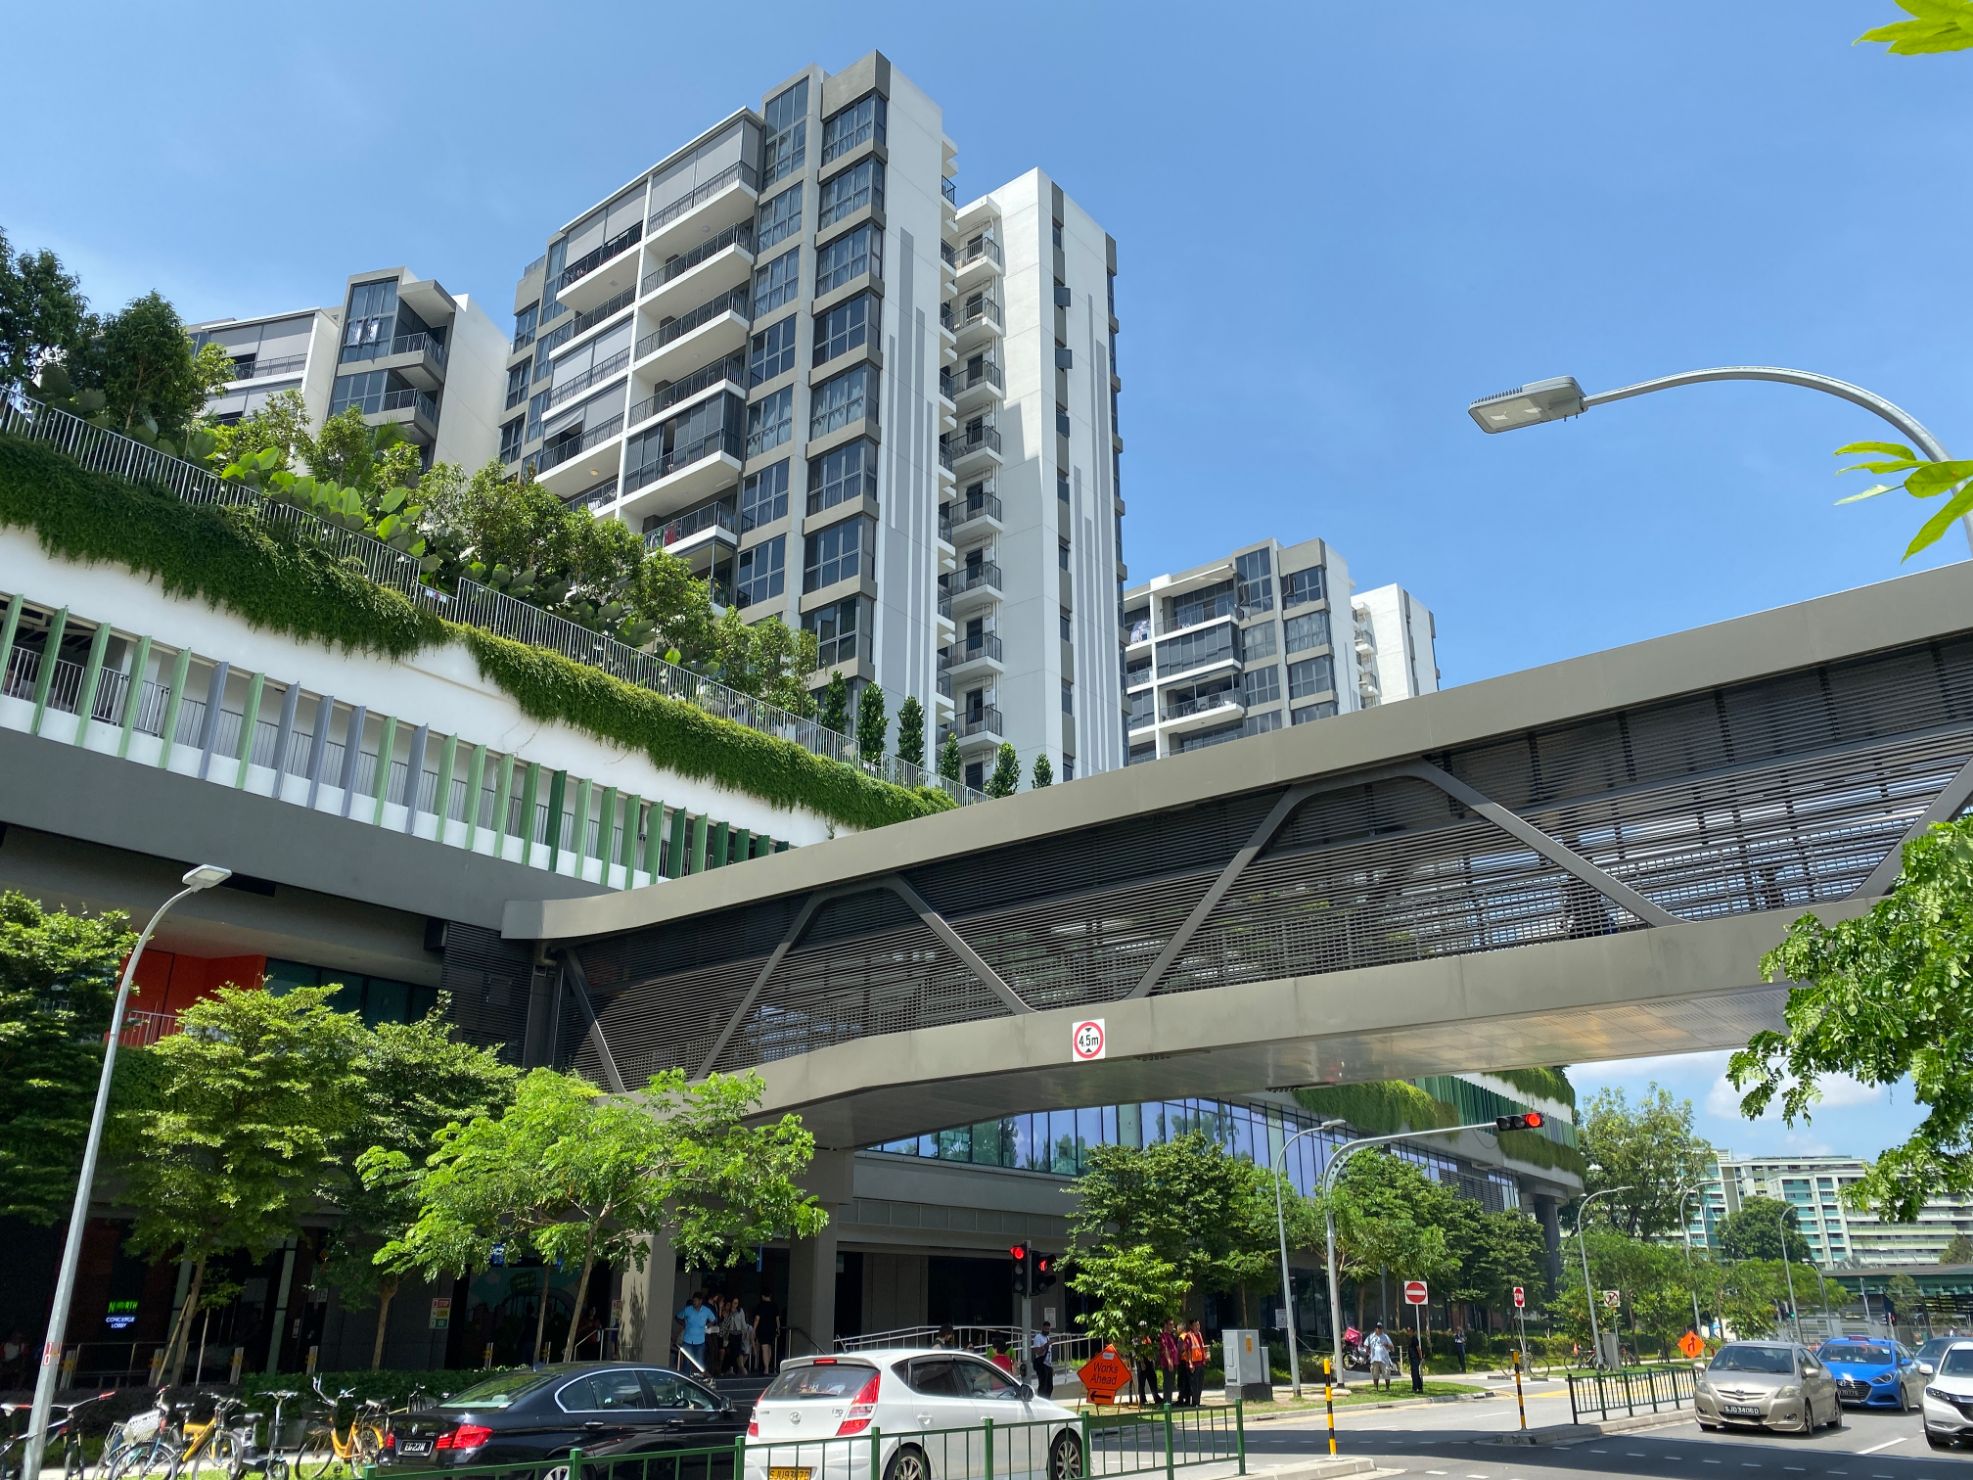
North Park Residences has a whopping shopping size of 1,330,000 sqft with 920 residential units. The condo’s quantum is currently 42.32% higher than the average district PSF of $909. It has garnered an appreciation increase of 16.48% from $1,353 average PSF since its launch to $1,576 average current PSF. Its current rental (average PSF pm) of $3.49 is 37.54% more than the current average district rental of $2.18.
It doesn’t have any main competitors.
Analysis: Like Bedok, Yishun is another one of those estates that have been around for a long period.
The result?
Well-developed amenities that include a variety of schools, entertainment hubs and food options. Somehow, there doesn’t seem to be any competition or even any other condo in the vicinity for that matter!
Further given the abundance of HDB flats in the area, it is therefore understandable that North Park Residences commands a 42.32% higher average quantum than the various other developments in the district.
The massive 1,330,000 sq ft commercial area at its doorstep also plays a huge role in its demand, and thus sizable quantum and heightened appreciation.
3 – The Orchard Residences (District 9)
| Project Name | Launch | TOP | Current Price (Average PSF) | Current Rental(Average PSF PM) |
| The Orchard Residences | March 2007 | 2010 | $3,367 | $5.75 |
| Scotts Square | July 2007 | 2011 | $3,670 | $6.47 |
| Twentyone Angullia Park | May 2012 | 2014 | $3,765 | $5.89 |
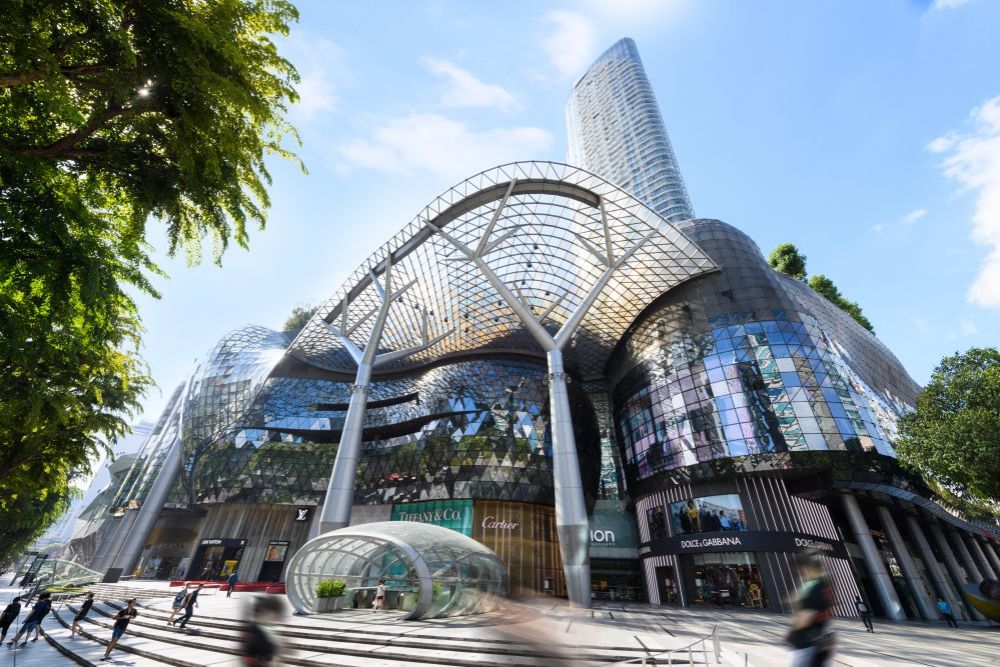
The Orchard Residences has a shopping size of 663,000 sqft with 175 residential units. The condo’s quantum is currently 30.65% higher than the average district PSF of $2,335. It has garnered an appreciation increase of 20.38% from $2,797 average PSF since its launch to $3,367 average current PSF. Its current rental (average PSF pm) of $5.75 is 24.70% more than the current average district rental of $4.33.
Its competitors include Scotts Square and Twentyone Angullia Park.
Analysis: If you had read the analysis paragraph on Park Place Residences (#12), you would understand the potential impact that freehold neighbours have on an integrated development.
Similarly, Orchard Residences is surrounded by a string of freehold condos. Yes, its current quantum is still a good $300+ PSF lower than its two competitors listed here. But if you factor in its 20.38% appreciation climb over a period of 12 years (considering its 99-year leasehold) to where it is today, you’d probably be as surprised as we were.
Perhaps the biggest reason for this is that the luxurious Orchard Residences sits atop not just one of the most exclusive malls in Singapore in Ion Orchard, but also atop an extremely central MRT station in Orchard MRT.
Still, its 99-year leasehold will eventually come back to haunt its residents from the quantum sphere – but not before it’s time is almost up.
2 – The Centris (District 22)
| Project Name | Launch | TOP | Current Price (Average PSF) | Current Rental(Average PSF PM) |
| The Centris | Jan 2006 | 2009 | $1,093 | $3.02 |
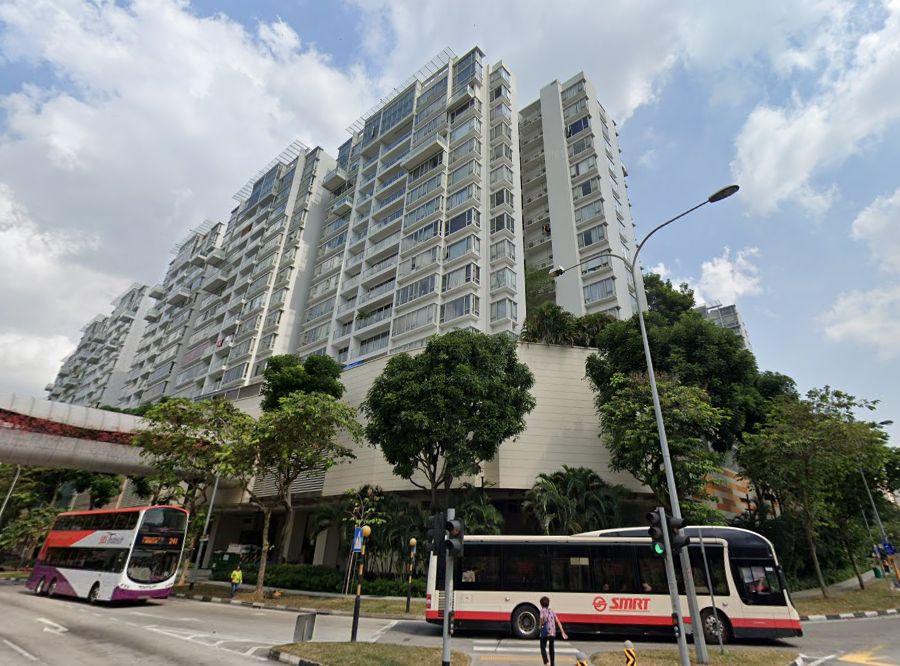
The Centris has a shopping size of 750,000 sqft with 610 residential units. The condo’s quantum is currently 9.24% higher than the average district PSF of $992. It has garnered a jaw-dropping appreciation increase of 99.82% from $547 average PSF since its launch to $1,093 average current PSF. Its current rental (average PSF pm) of $3.02 is 12.25% more than the current average district rental of $2.65.
It doesn’t have any main competitors.
Analysis: For those who have lived or patronised the west most of their lives, there is little doubt that Jurong Point would be a very familiar sight for you.
One of the very first integrated developments in Singapore, The Centris currently (and has for the past 10 years) sits atop this convenient communal hub that is Jurong Point. Not just that, the next-door Jurong Medical Center proves extremely useful for the aged residents living here, further adding to its valuation.
Surprisingly, there were no condominiums that surfaced in the area after its launch in January 2006. And as we know, no competition equals solid premium with generally good appreciation.
‘Generally good appreciation’ here would of course be rephrased as ‘incredibly wonderful appreciation’.
Says who?
Says the residents who have sold their units here for nearly double the launch price.
Still, the condo is nearly 10 years old (and of course Jurong Point is much older) and with potential newer malls and developments popping up in the Boon Lay area, its average 99.82% appreciation increase might just signal the peak of The Centris’ powers.
1 – Compass Heights (District 19)
| Project Name | Launch | TOP | Current Price (Average PSF) | Current Rental(Average PSF PM) |
| Compass Heights | Feb 2001 | 2002 | $814 | $2.33 |
| The Luxurie | Sep 2011 | 2015 | $1,102 | $2.99 |
| La Fiesta | Jan 2013 | 2016 | $1,280 | $2.96 |
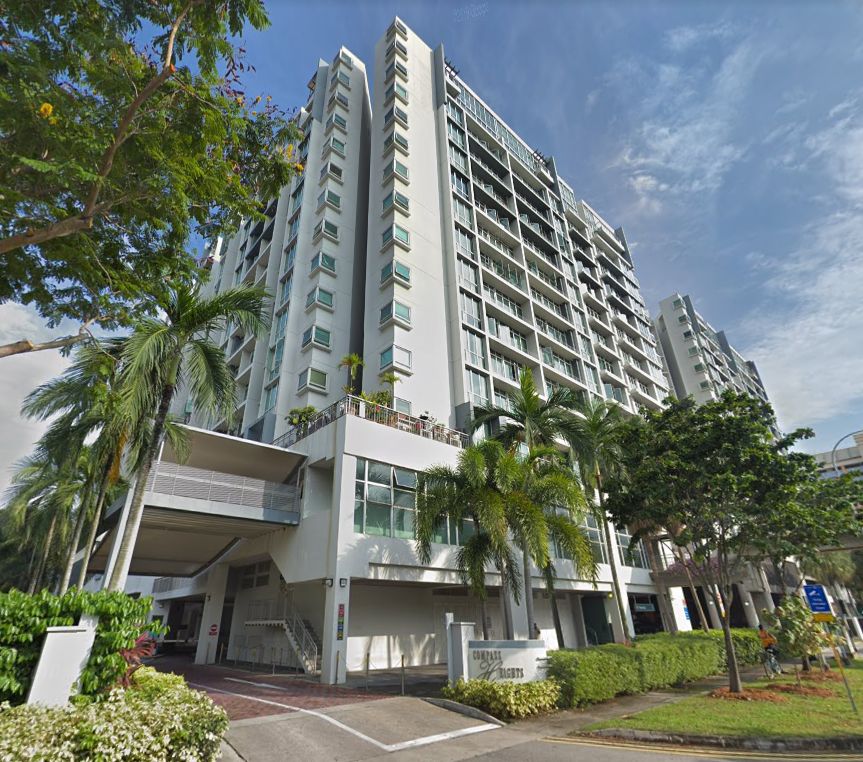
And finally, Compass Heights has a shopping size of 269,098 sqft with 536 residential units. The condo is the only other project from The Poiz Residences in this list to have its quantum (-58.35%) below the current average district PSF of $1,289. It has garnered an unbelievable appreciation increase of 137.32% from $343 average PSF since its launch to $814 average current psf. Its current rental (average PSF pm) of $2.51 is also -7.73% less than the current average district rental of $2.33.
Its competitors include The Luxurie and La Fiesta.
Analysis: Based on its current quantum marked at a massive -58.35% below the district’s average psf despite its status as an integrated development, you know that there is something slightly different about this project.
In fact, this isn’t just any integrated development. Compass Height is actually Singapore’s very first integrated development.
Having stood above Compass One (formerly fondly known as Compass Point) for the past 17 years, it has become a familiar sight to residents of Sengkang.
More than that, it doesn’t seem to be slowing down on its quantum appreciation climb anytime soon.
The truth is, Compass Heights belongs to an era where condo prices were not as crazy as they are now – and perhaps one of the biggest reasons for its massive appreciation (despite its age) is the way the development’s quantum naturally matches that of modern-day integrated development market rates.
While we highly doubt that we will ever see a 137% appreciation increase in a new integrated development ever again, it is really a miracle to behold.
More importantly, it serves as a lesson to all of us that new real-estate innovations will also have the potential to reap incredible rewards many years down the road.
Integrated Developments: General Trends
Having individually analysed these 14 integrated developments, we’ve also decided to throw in some general trends that we have observed throughout.
- Firstly, a lack of neighbouring competition results in massive demand for that particular integrated development.
| Project Name | Launch Price | Current Price | Increased PSF Value | Appreciation Percentage |
| The Centris | $547 | $1,093 | +$546 | 99.82% |
| Bedok Residences | $1,347 | $1,435 | +$88 | 6.53% |
| North Park Residences | $1,353 | $1,576 | +$223 | 16.48% |
| South Beach Residences | $3,164 | $3,335 | +$171 | 5.40% |
If you were to observe the integrated developments with no surrounding competition (as compiled), you’d observe positive appreciation statistics all round. The Centris and North Park Residences being the appreciation leaders here.
We also know that people were queuing overnight for units at Bedok Residences at launch and that South Beach Residences’s quantum still saw a marked numeral increase despite its hefty figure as part of this demand.
- Secondly, high-end luxury integrated developments have a 100% rate of appreciating positively thus far.
| Project Name | Launch Price | Current Price | Increased PSF Value | Appreciation Percentage | Age of Condo |
| Marina One Residences | $2,246 | $2,575 | +$329 | 14.65% | 2 years |
| The Orchard Residences | $2,797 | $3,367 | +$570 | 20.38% | 9 years |
| South Beach Residences | $3,164 | $3,335 | +$171 | 5.40% | 3 years |
| Wallich Residence | $3,468 | $3,594 | +$126 | 3.63% | 2 years |
One thing that these developments have in common apart from their ‘luxury allure’ is their ‘centrality’. Combined, they fetch a hefty resale quantum and bring with them promises of solid appreciation.
- Thirdly, integrated developments naturally fetch a higher quantum and rental yield than neighbouring condos in the same district – and the outliers represent good value.
| Project Name | Average PSF | District Average PSF | PSF Percentage Difference |
| Compass Heights | $814 | $1,289 | -58.35% |
| The Poiz Residences | $1,388 | $1,415 | -1.95% |
This one’s a no-brainer, but the reason we’re putting the outliers in is to actually highlight a valuable investment insight.
Of course an outlier that has a lower PSF than its district usually has a ‘flaw’ hence the lower demand or the lower pricings by the developer. If you are able to overlook this flaw however, you have the ability to purchase an integrated development unit at a much ‘affordable’ and ‘well-valued’ quantum.
To extrapolate, let’s look at the case of Compass Heights. The condo’s incredible 20 year lifespan is the most likely reason for its much lower average PSF. If you are able to look past this factor (and provided there is a resale unit), you’ll be experiencing the joys of living in an integrated development at nearly half the district’s average PSF!
Let’s now look at a more modern example in The Poiz Residences.
We observe its rough PSF similarity to the district’s average and how it has suffered a -3.88% appreciation since its launch. Part of this would be due to the massive (noisy) construction in the neighbourhood.
Another possible reason is that its retail/commercial space is only 50,000 sqft large and with so many neighbourhood shops (and condos) around, the demand isn’t that high for the development.
IF you were able to look outside of these ‘flaws’ and went for a unit here however, you’d technically still be getting that 50,000 retail space (which by the way includes a FairPrice and Starbucks of its own), direct access to the MRT and not to mention access to Singapore’s largest city fringe integrated development.
All this, while paying less than the district’s average quantum!
- Lastly, the oldest and newest condos have linear appreciation trends. The elders appreciate more. For the younglings, the opposite.
| Project Name | Launch Date | Appreciation Statistic |
| Woodleigh Residences | Nov 2018 | -8.87% |
| Park Place Residences | March 2017 | -2.99% |
| The Poiz Residences | Nov 2015 | -3.88% |
| The Orchard Residences | March 2007 | 20.38% |
| The Centris | Jan 2006 | 99.82% |
| Compass Heights | Feb 2001 | 137.32% |
Yes, South Beach was launched in September 2018, but it had already top-ed 2 years earlier and developers were holding on to ensure sales only when the market was ripe, hence we’re omitting it from the table.
In brief, the data shows the oldest integrated developments appreciating the best with the newest integrated developments seemingly struggling to appreciate positively.
It goes without saying that the pioneers naturally did well due to their initial market novelty factor as Singapore’s ‘first and only integrated developments’ back in the day. Factor in the gradual rise of condominium market quantum through the years and it is no wonder their solid appreciation.
As for the new integrated developments however, one common theme that seems to resonate is the presence of strong nearby condo competition (be it in tenure or adjacency) to each development – a factor that is naturally pulling down their appreciation statistics (we’ll discuss this point in greater detail in a bit).
So how do we pick the right integrated development project?
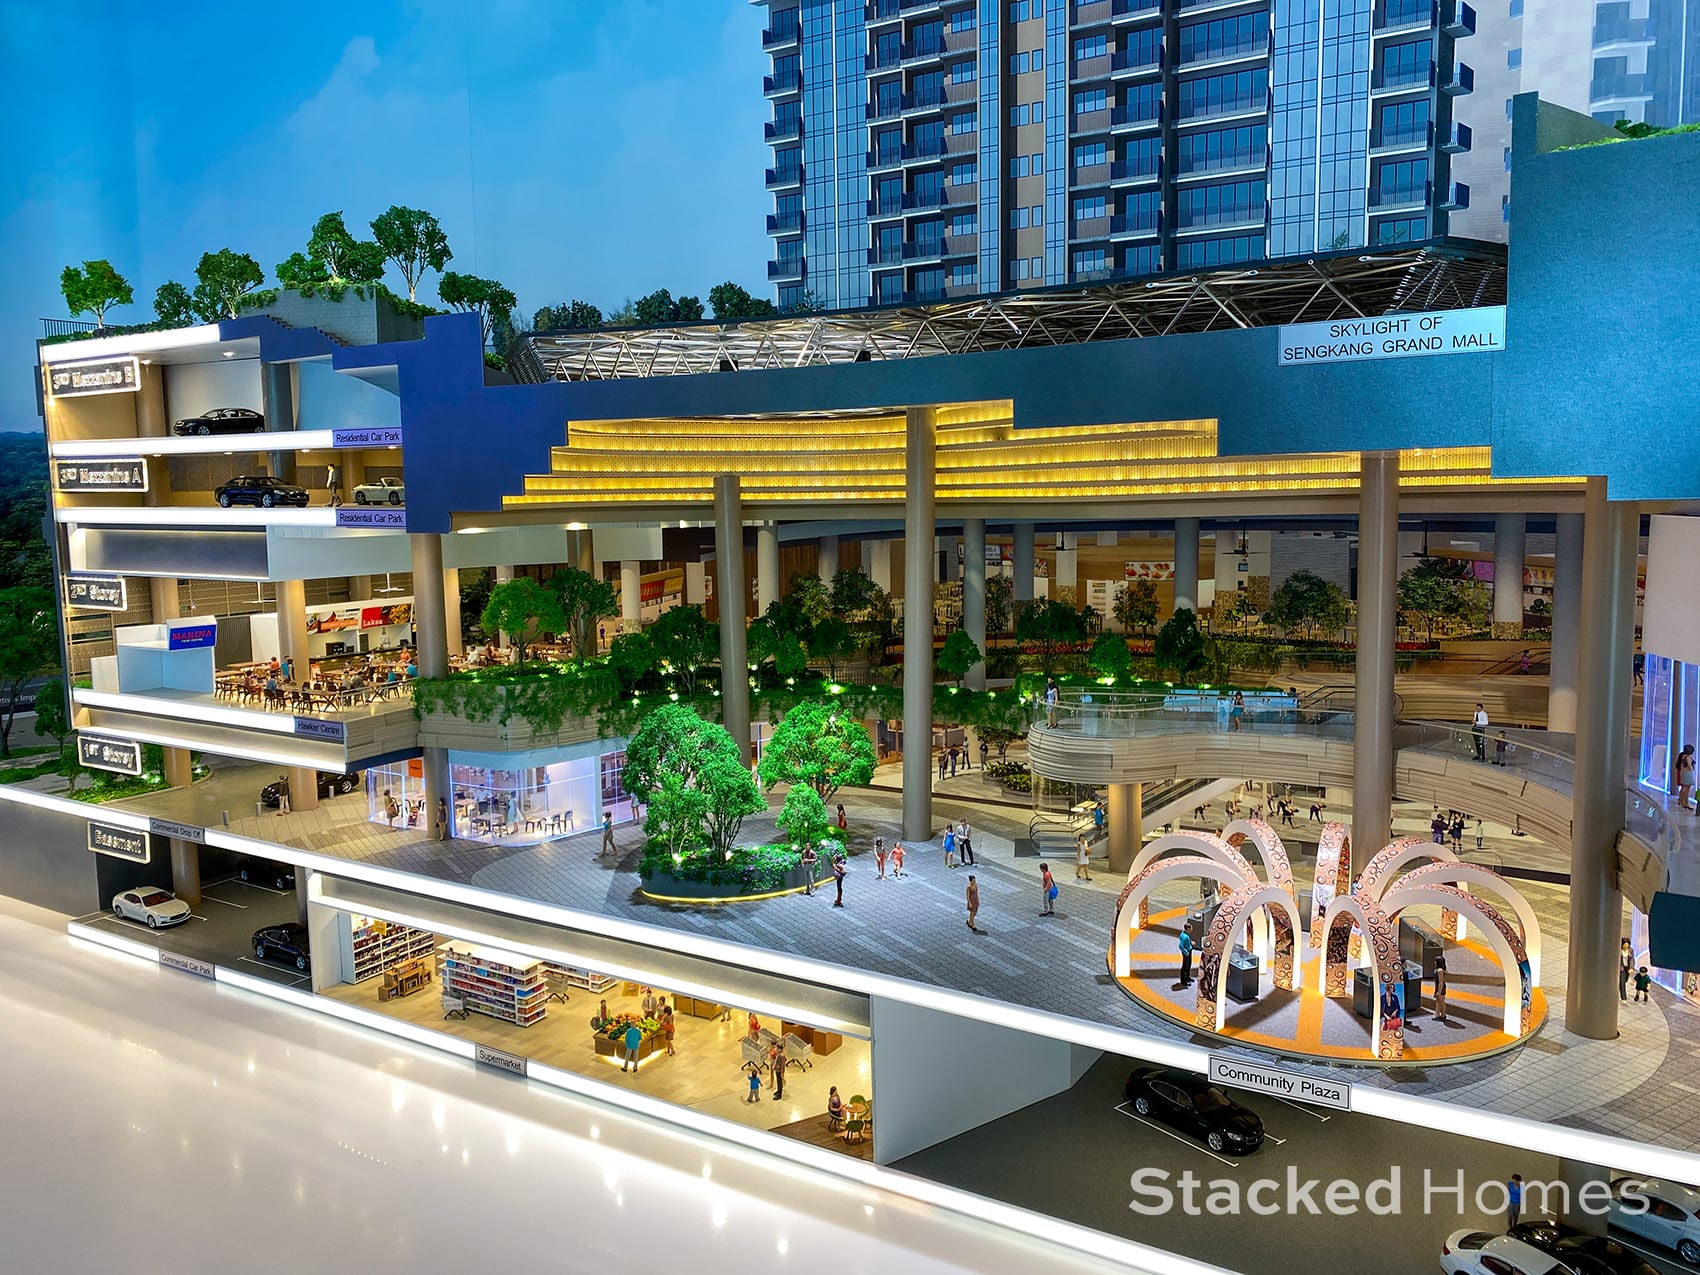
Truthfully, it depends on a number of factors at face value. For now, let’s look at the two main ones:
Reason for purchase
This can be further narrowed down into ‘Long-term Homeowner’ or ‘Short-term Homeowner/Investor’.
For Long-term Homeowners: It is important to observe the quantum difference that this particular integrated development unit has when compared to the average district quantum.
You’d also have to ask yourself what your most valued amenities are (eg, proximity to school, transport, groceries etc.).
If you feel that the quantum difference is reasonable for that added convenience, that’s half the battle won. From there, you can then go on to inspect more focused aspects like unit size/layout, facility offerings and noise levels to ensure that this is the right home for you.
For Short-term Homeowners/Investors: For those who see themselves switching homes often, understanding the condo’s potential appreciation statistics (we’ll compile the factors for you in a bit) is extremely important in ensuring resale profits.
It is also relatively important for investors to understand the relative rental yield of units in said development. Generally, integrated development units in the CBD or next to massive working hubs tend to fetch very good rental rates.
Appreciation potential:
Based on the general trends and individual analysis, an integrated development’s appreciation potential boils down to these main factors:
- Competition from Neighbours
Perhaps the biggest appreciation determiner is the presence of neighbouring condo competition. This can be broken down into:
Freehold Condo Competition: Once a 99-year leasehold goes past a certain mark, it naturally depreciates – more so when it is surrounded by freehold developments. The best way to avoid being hit is to buy early, and not sell too late.
Adjacent Condo Competition: Adjacent condos can benefit from same ease-of-access as the original integrated development. This results in more competitive pricings and possible loss of appreciation. Good for long-term homeowners, not so much for short-term homeowners/investors.
Abundant free land: A double edged sword, numerous surrounding free land could result in new condo developments – which can shift demand/uptake, thus resulting in appreciation loss.
On the other hand, new useful amenity developments popping up in these areas would undoubtedly boost appreciation.
As such, it is extremely important to check land availability/use from the integrated development’s surroundings beforehand.
- Location
Central-city integrated developments will naturally appreciate in general barring an economic crash or freak condo mishaps.
Increased Development Effort: Firstly, developers who purchase land in the CBD are paying substantially more. Naturally, more work would be put into condo quality and offerings to ensure good uptake, developer renown and most importantly an ability to command a higher quantum. The increased condo quality and offerings therefore stabilises the condo’s quantum over the years, paving the way for easier appreciation.
Solid proximity to work hot-spots (CBD): Secondly, a condo in areas like these will naturally result in constant rental demand. Constant rental demand undoubtedly adds to unit demand – especially if the rental demands are way above the district average. This sets the way once again for a stabilised quantum and gradual appreciation through the years as demand grows.
Our Essential Integrated Developments Guide: Final Word

In conclusion, these are just some of the main factors we’ve managed to sifted out based on the data at hand. It is crucial to understand that alongside these main bodies are a million smaller factors that could also impact the development’s appreciation potential on different scales.
Logically speaking, the best solution when determining if an integrated development would be a good fit for you while considering its appreciation potential is to apply these general guidelines as much as possible.
More than that, it is important to keep an open mind and ear to other possible factors/reasons that would contribute to your chosen development’s appreciation trend and therefore reduce buyer’s risk as much as possible.
Should you require any advice on whether your chosen condominium will appreciate in the near future, feel free to drop us a query at stories@stackedhomes.com. As always, we’d love to hear your opinions and get in touch!
Thanks again for reading, and till next time!
At Stacked, we like to look beyond the headlines and surface-level numbers, and focus on how things play out in the real world.
If you’d like to discuss how this applies to your own circumstances, you can reach out for a one-to-one consultation here.
And if you simply have a question or want to share a thought, feel free to write to us at stories@stackedhomes.com — we read every message.
Frequently asked questions
What are integrated developments and why are they popular in Singapore?
How does proximity to MRT stations affect the value of integrated developments?
Why do some integrated developments experience a decline in appreciation, like Woodleigh Residences?
What makes South Beach Residences stand out among other integrated developments?
How does the location of Bedok Residences contribute to its high demand and appreciation?
Reuben Dhanaraj
Reuben is a digital nomad gone rogue. An avid traveler, photographer and public speaker, he now resides in Singapore where he has since found a new passion in generating creative and enriching content for Stacked. Outside of work, you’ll find him either relaxing in nature or retreated to his cozy man-cave in quiet contemplation.Need help with a property decision?
Speak to our team →Read next from Property Trends
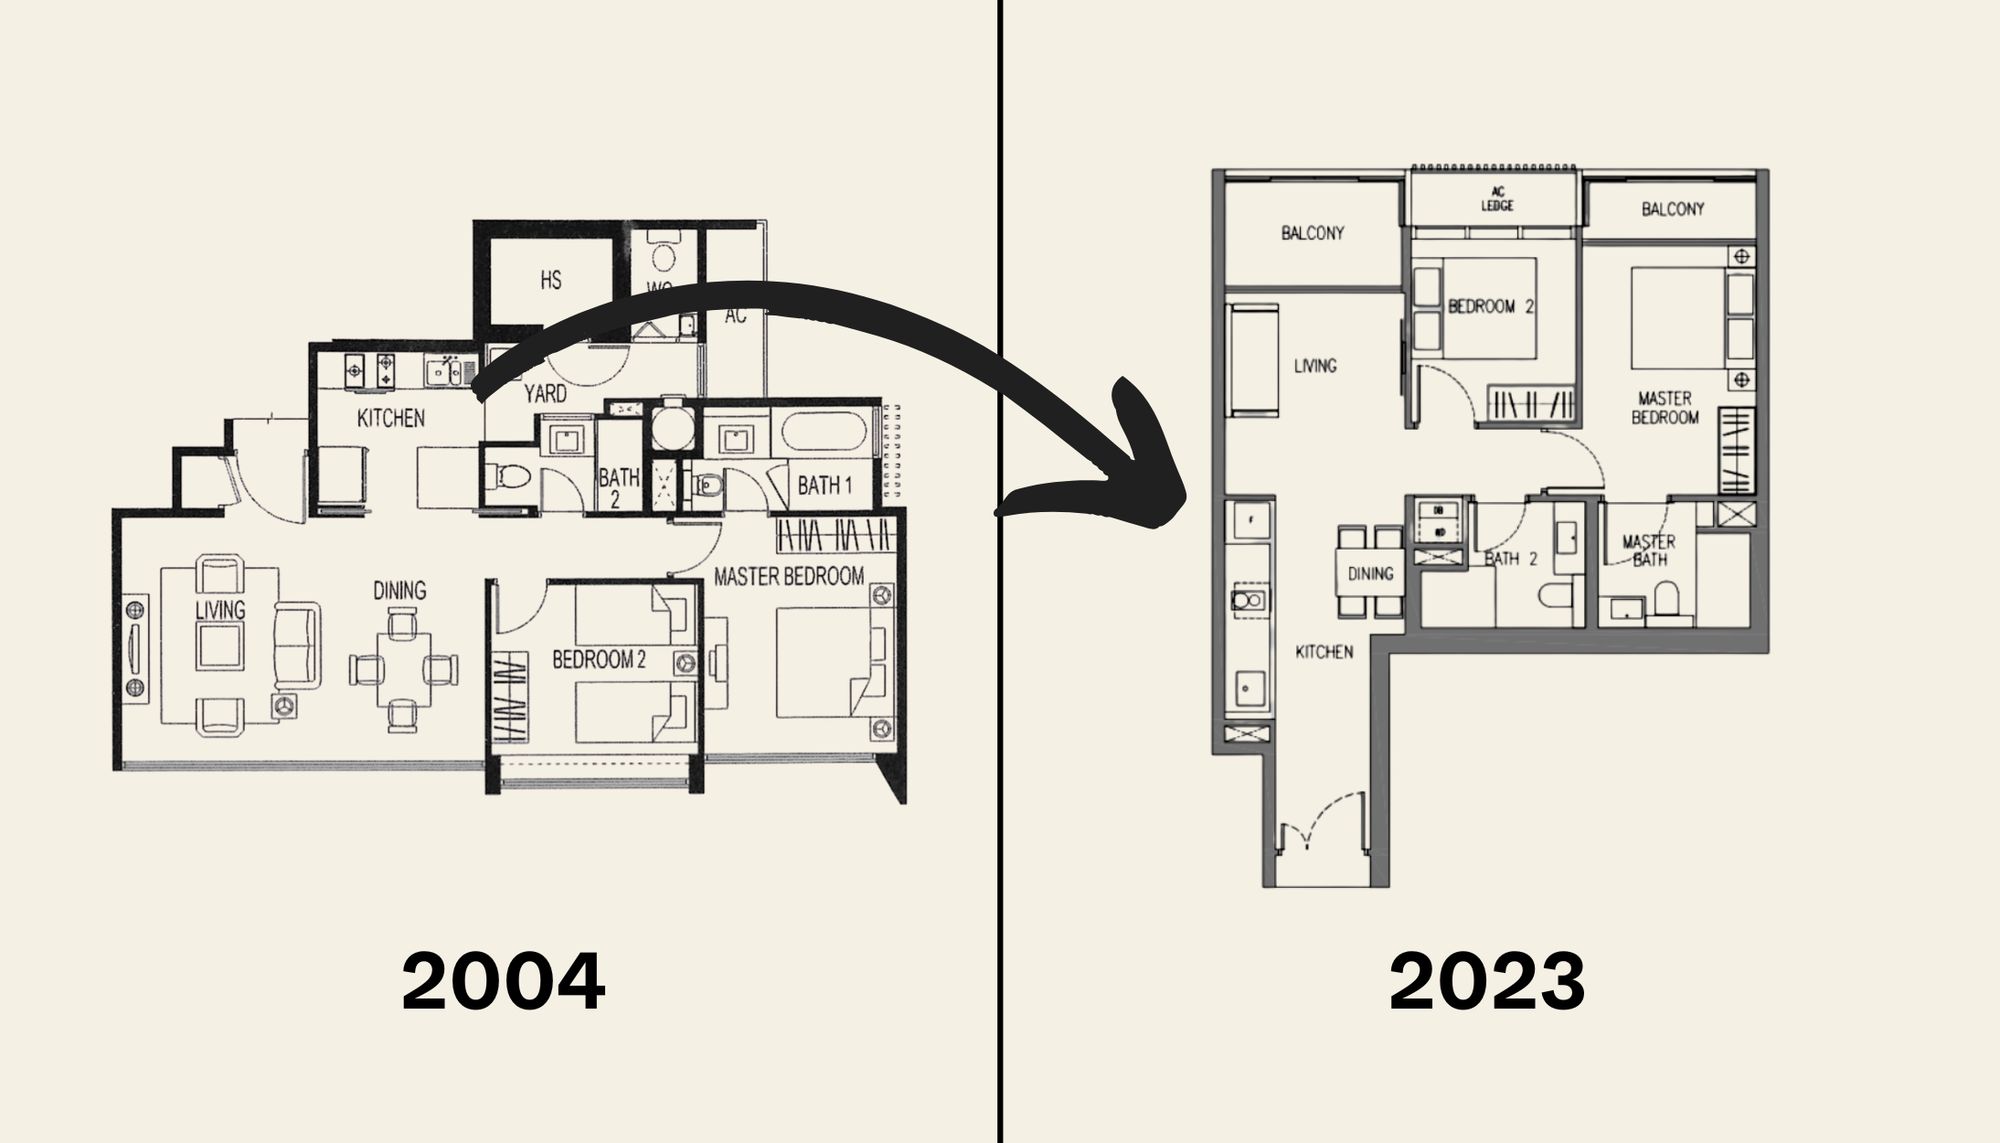
Property Trends The Room That Changed the Most in Singapore Homes: What Happened to Our Kitchens?
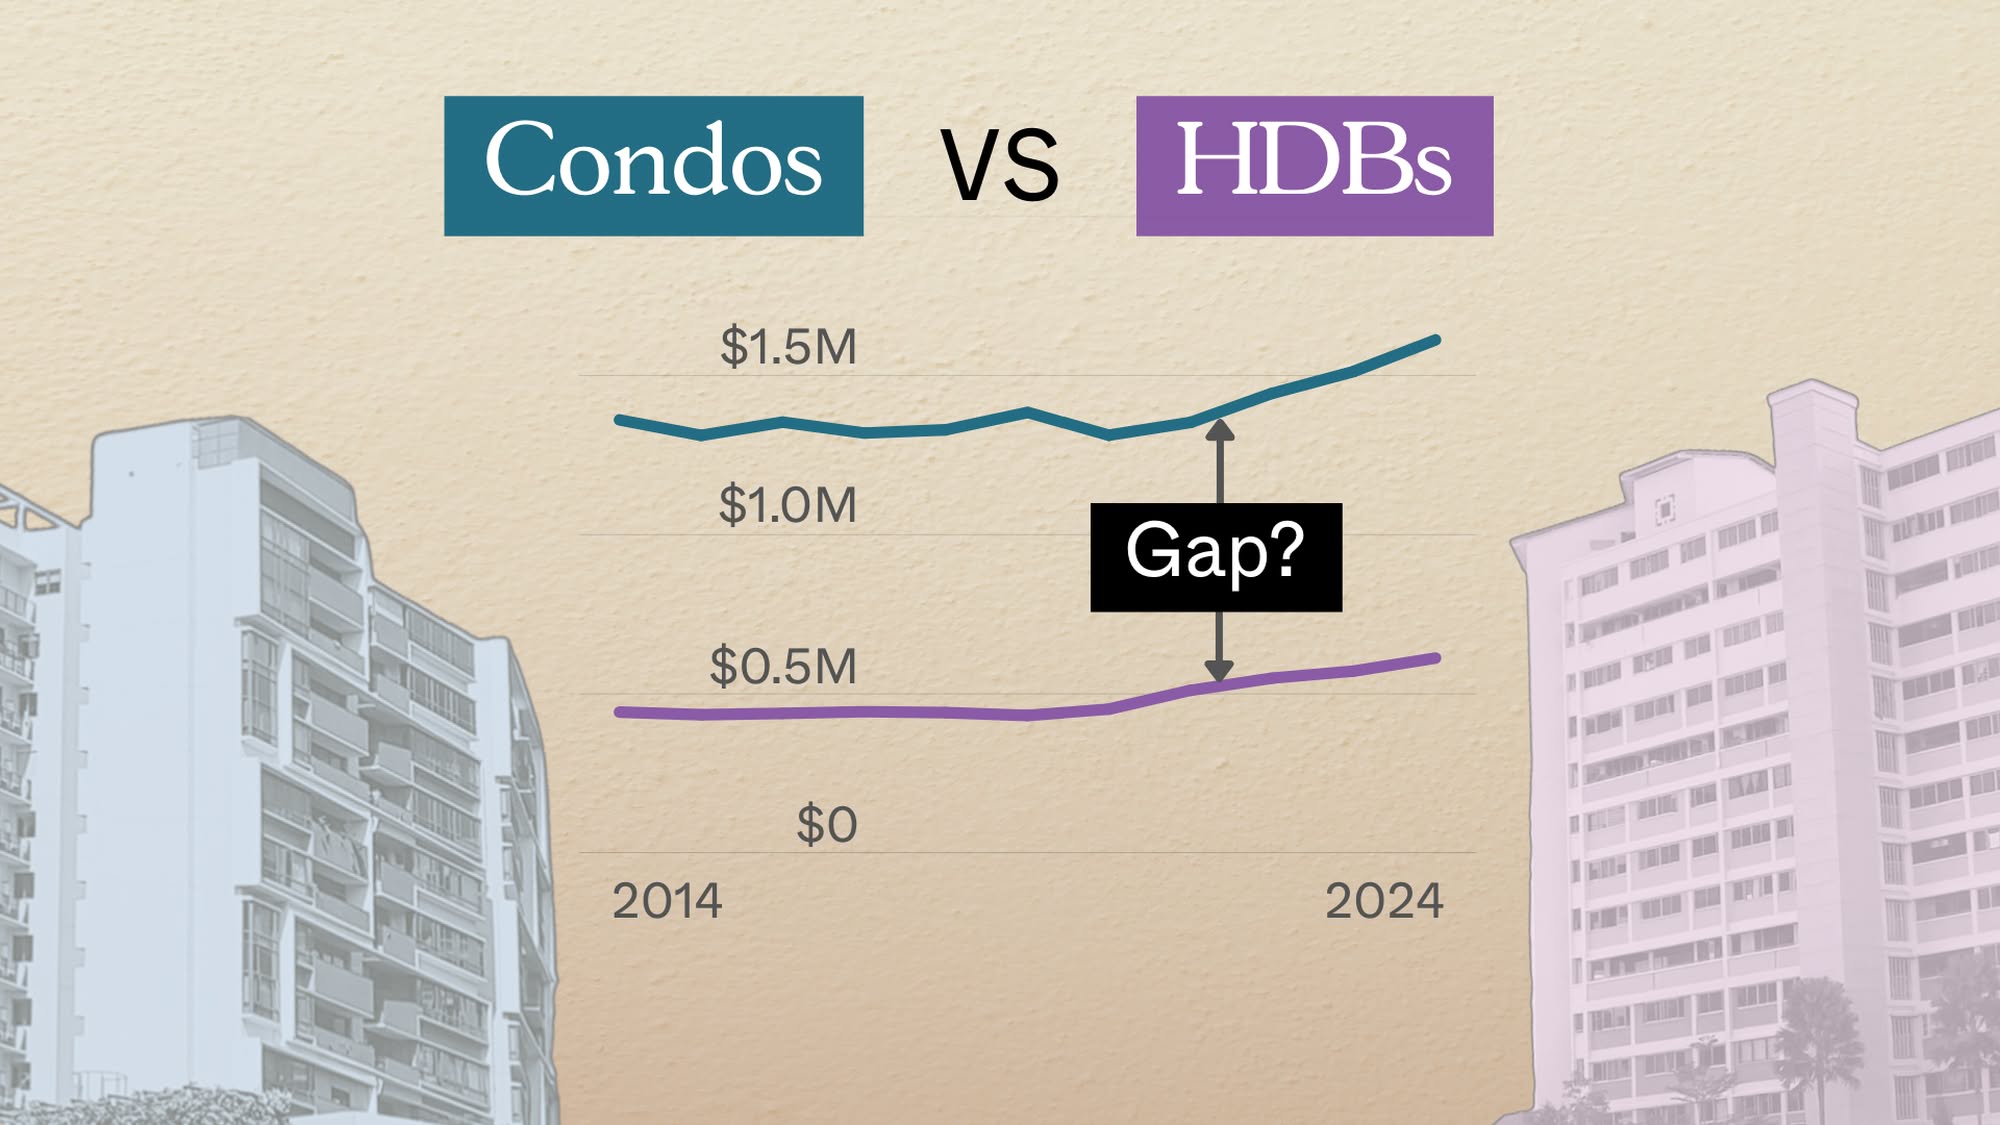
Property Trends Condo vs HDB: The Estates With the Smallest (and Widest) Price Gaps

Property Trends Why Upgrading From An HDB Is Harder (And Riskier) Than It Was Since Covid
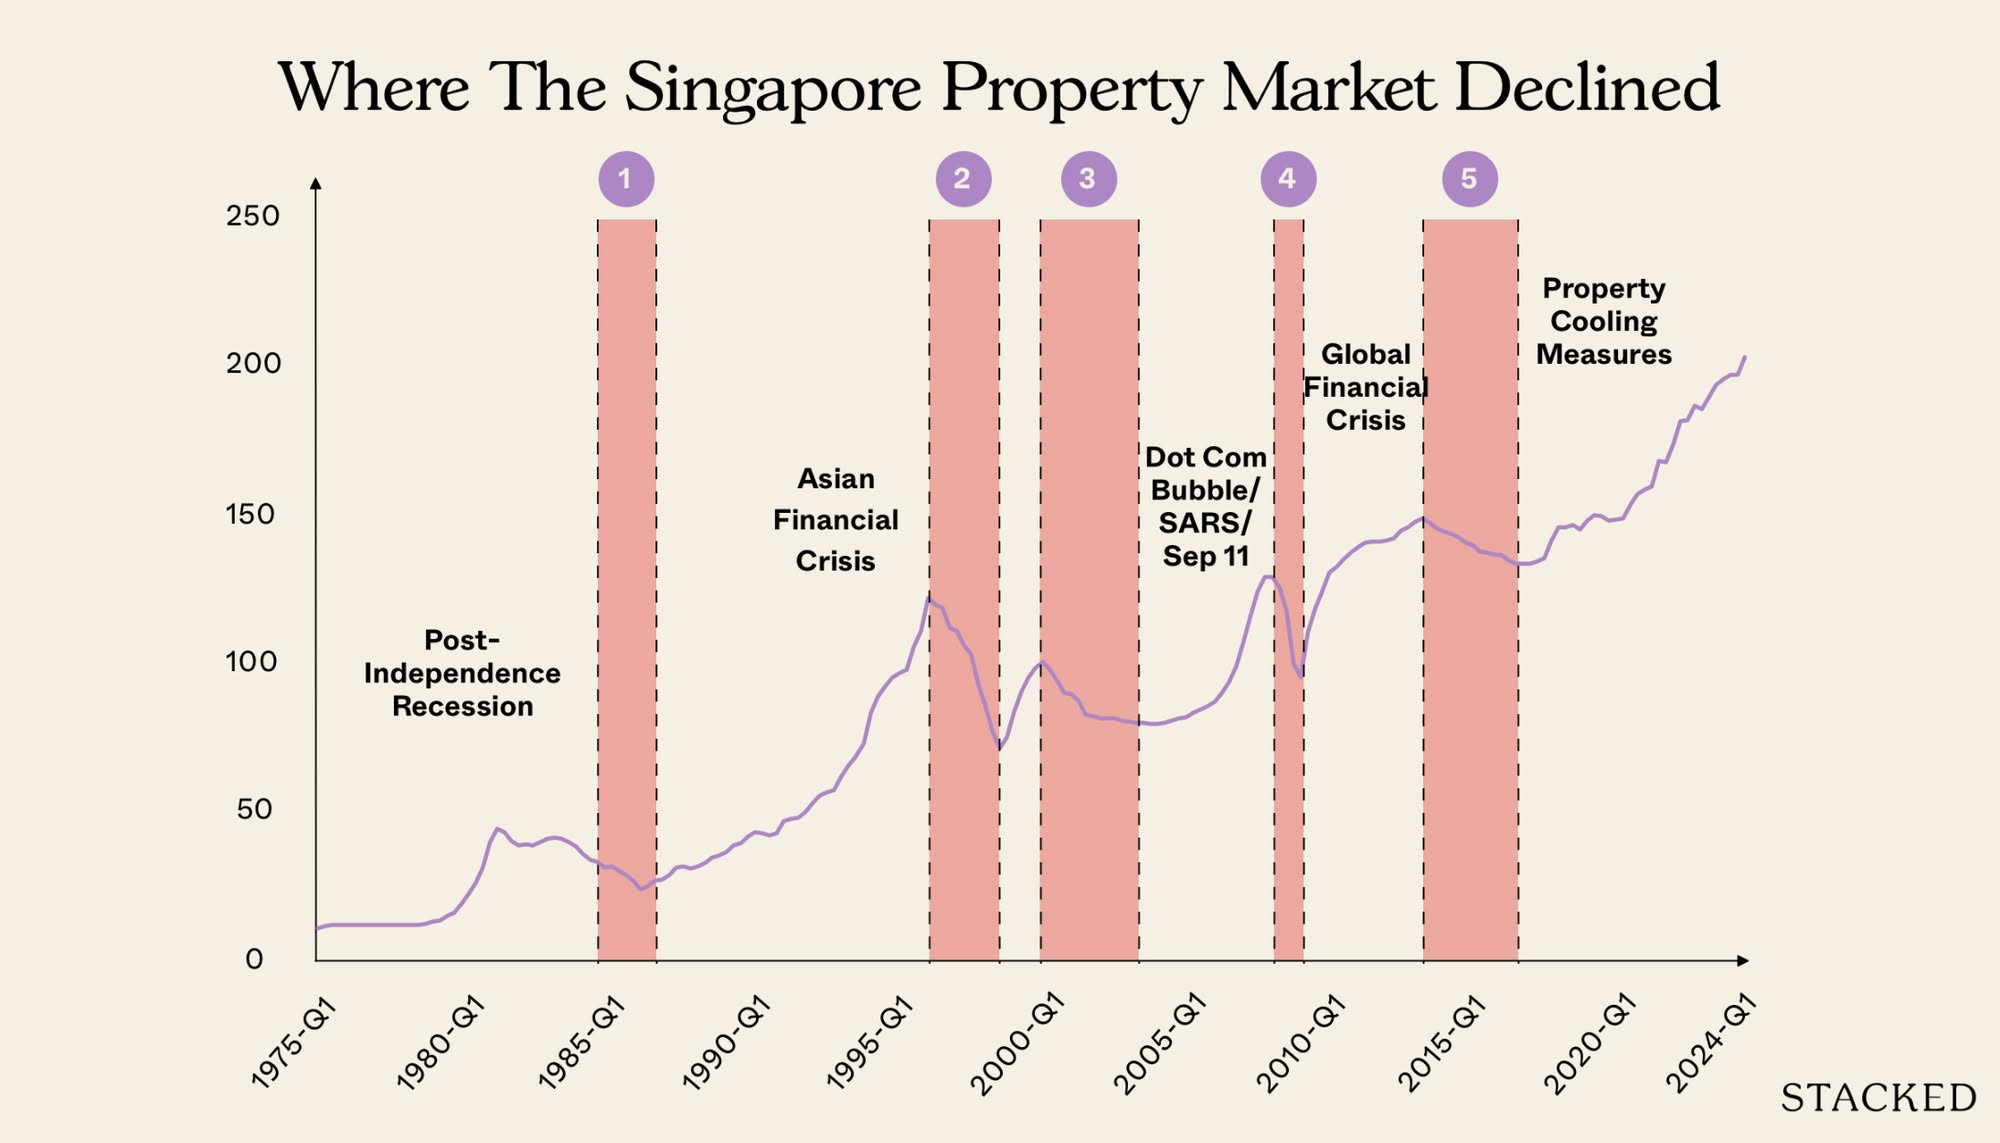
Property Trends Should You Wait For The Property Market To Dip? Here’s What Past Price Crashes In Singapore Show
Latest Posts
On The Market A 40-Year-Old Prime District 10 Condo Is Back On The Market — As Ultra-Luxury Prices In Singapore Hit New Highs
Pro This Singapore Condo Has Bigger Units Near The MRT — But Timing Decided Who Made Money

Editor's Pick Happy Chinese New Year from Stacked




1 Comments