We Ranked Every District By Their Cluster Housing vs Landed Price Gap – Here’s What We Found
July 26, 2020
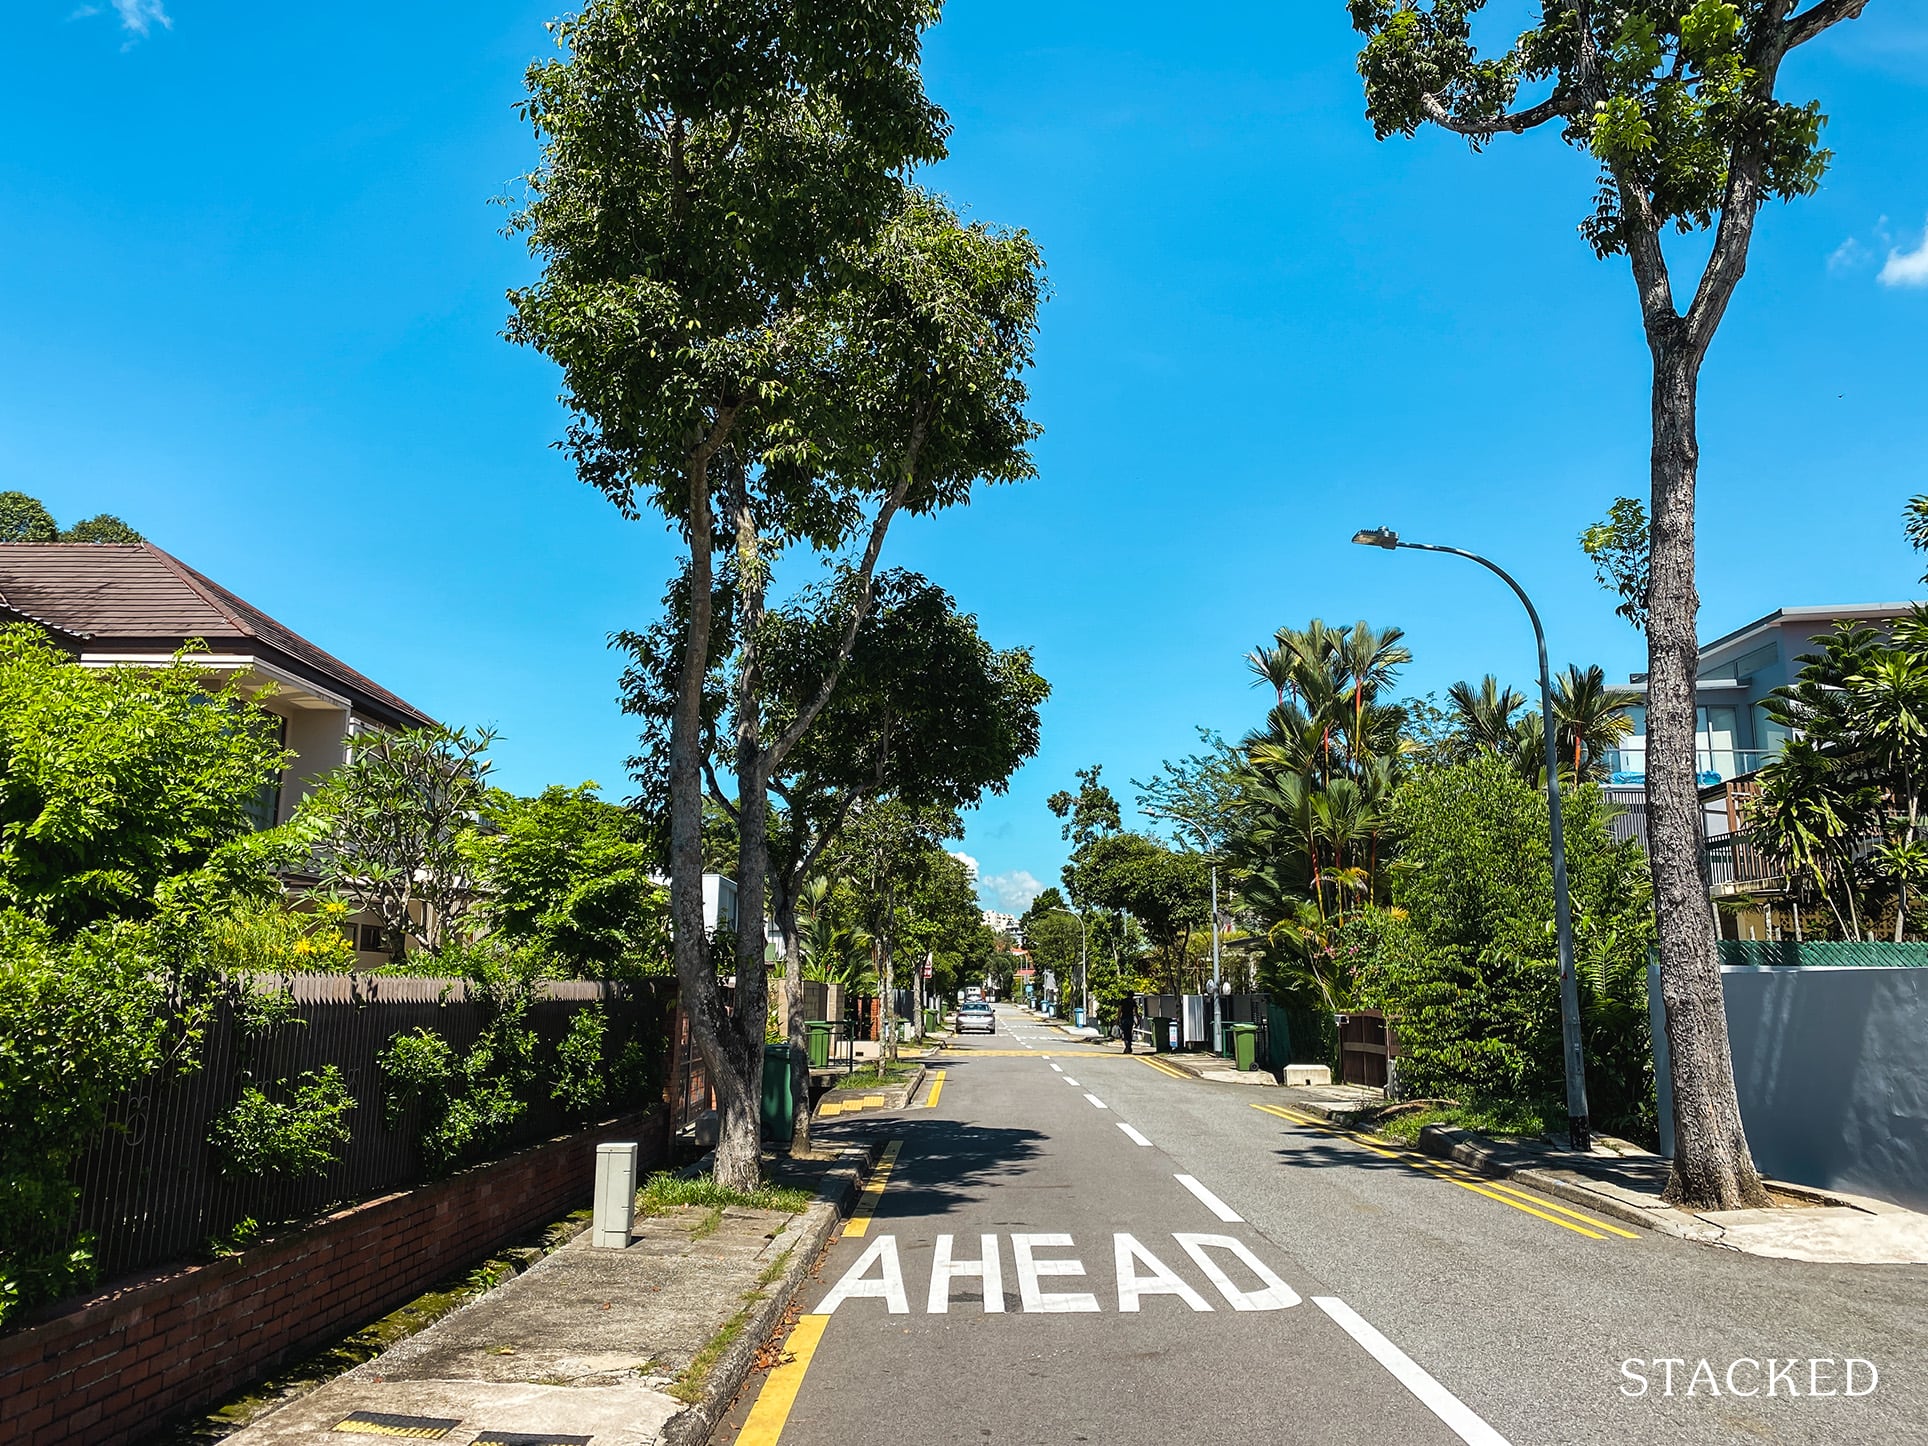
I recently sat down with some of our writers to piece together an article on the elusive Cluster Housing sector. In that article, we analysed a jaw-dropping 25 years of Cluster Housing Price Trends amongst a number of rather intriguing pointers.
Safe to say, the piece received some incredibly positive responses from many of you ( – to Basant, Leon and Shawny, thank you for taking the time to pen your thoughts and queries down!).
After some further thought, I realised that we could in fact go deeper into the numbers – and much like our previous average district psf article where we listed out all of the top appreciating districts in Singapore, I thought hey, why not do one for Cluster Houses as well?
Considering that most people in the market for Cluster Houses would probably also have half an eye on Landed Houses, we’ve decided to work on a little ‘two-in-one’ article where we look at the price gaps between these two housing types across all our Singaporean districts (wherever possible).
There isn’t really much else to say, except that the figures we’ve collated today do give some rather interesting (first) insights for a number of us going forward!
Just before we begin however…
A few pointers to note based on how the numbers were lined up:
- Firstly, we omitted Districts 1, 2, 3, 6, 7, 8, 12, 24 and 25 on the precursor that there are either limited or no cluster/landed developments in these 9 regions, hence our inability to rank them fairly.
(Cluster homes are, after all, a rare and exclusive housing type in Singapore)
- Secondly, the average PSF figures are based on the average PSF values of all the cluster and landed housing residential units across the 19 districts in the past 5 years (July 2016 – July 2020).
- Thirdly, we’ve chosen to take out any strata residentials which are part of bigger private residential projects as they aren’t technically classified as cluster homes (eg. D’Leedon, Thomson Three etc.).
- And finally, the profit and loss transaction numbers near the tail-end of the piece (Spoiler alert!) were taken throughout the lifetime of all the cluster housing developments involved.
District Rankings (List)
#19 – District 13 (Potong Pasir/Macpherson)
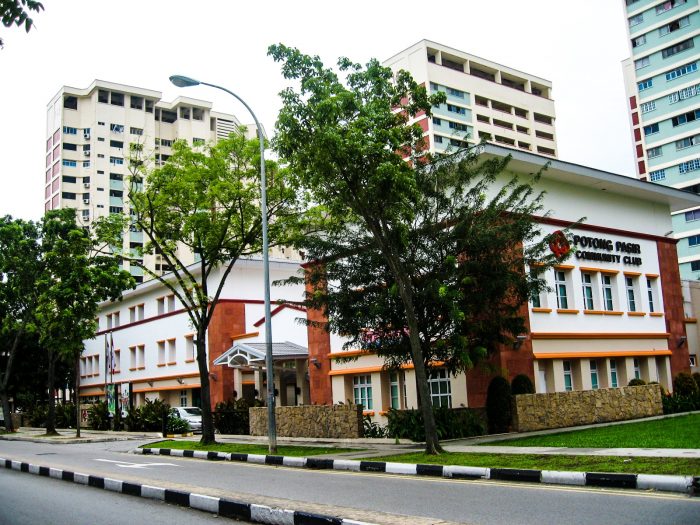
In this district, landed housing prices ($880 psf) are not too far off from those of cluster housing ($678 psf) at a price gap of $201 psf.
Cluster homes here have had 94 profitable and 24 loss making transactions so far. This is at an average profit of $430,538 and an average loss of -$309,375.
Note: PSF-values should always be taken as a singular metric of comparison. At the end of the day, would-be buyers should always look at total quantum values of units to ascertain the actual costs of their units, and to see if these homes actually fit their budgets.
#18 – District 19 (Hougang/Punggol/Serangoon Gardens)
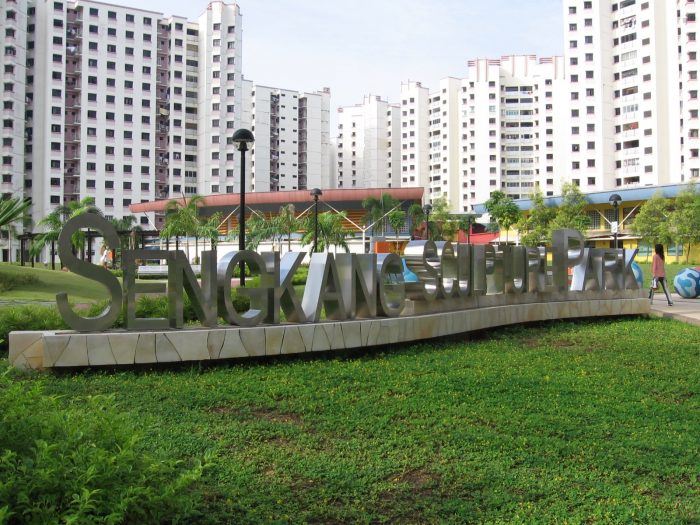
This district, in particular, has a knack for rapid expansion – especially with all the new BTO flats popping up in the region, often overshadowing that of the private residential sector.
Here, landed housing prices ($911 psf) and cluster housing prices ($645 psf) differ by a price gap of $266 psf.
Cluster homes here have had 254 profitable and 43 loss making transactions so far. This is at an average profit of $394,831 and an average loss of -$295,786.
#17 – District 17 (Changi/Loyang)
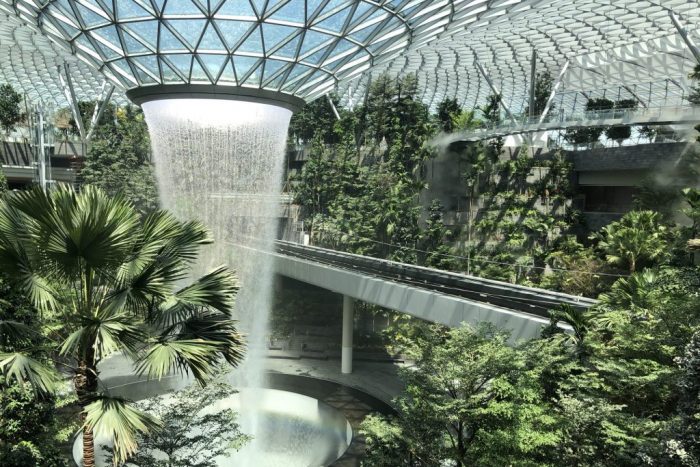
District 17, located on the eastern tip of Singapore, is known for being home to Singapore’s key commercial aviation industry and some (really) tasty local delights.
Here, landed housing prices ($888 psf) and cluster housing prices ($590 psf) differ by a price gap of $298 psf.
Cluster homes here have had 18 profitable and 16 loss making transactions so far. This is at an average profit of $324,463 and an average loss of -$158,137.
#16 – District 10 (Ardmore/Bukit Timah/Holland/Tanglin)
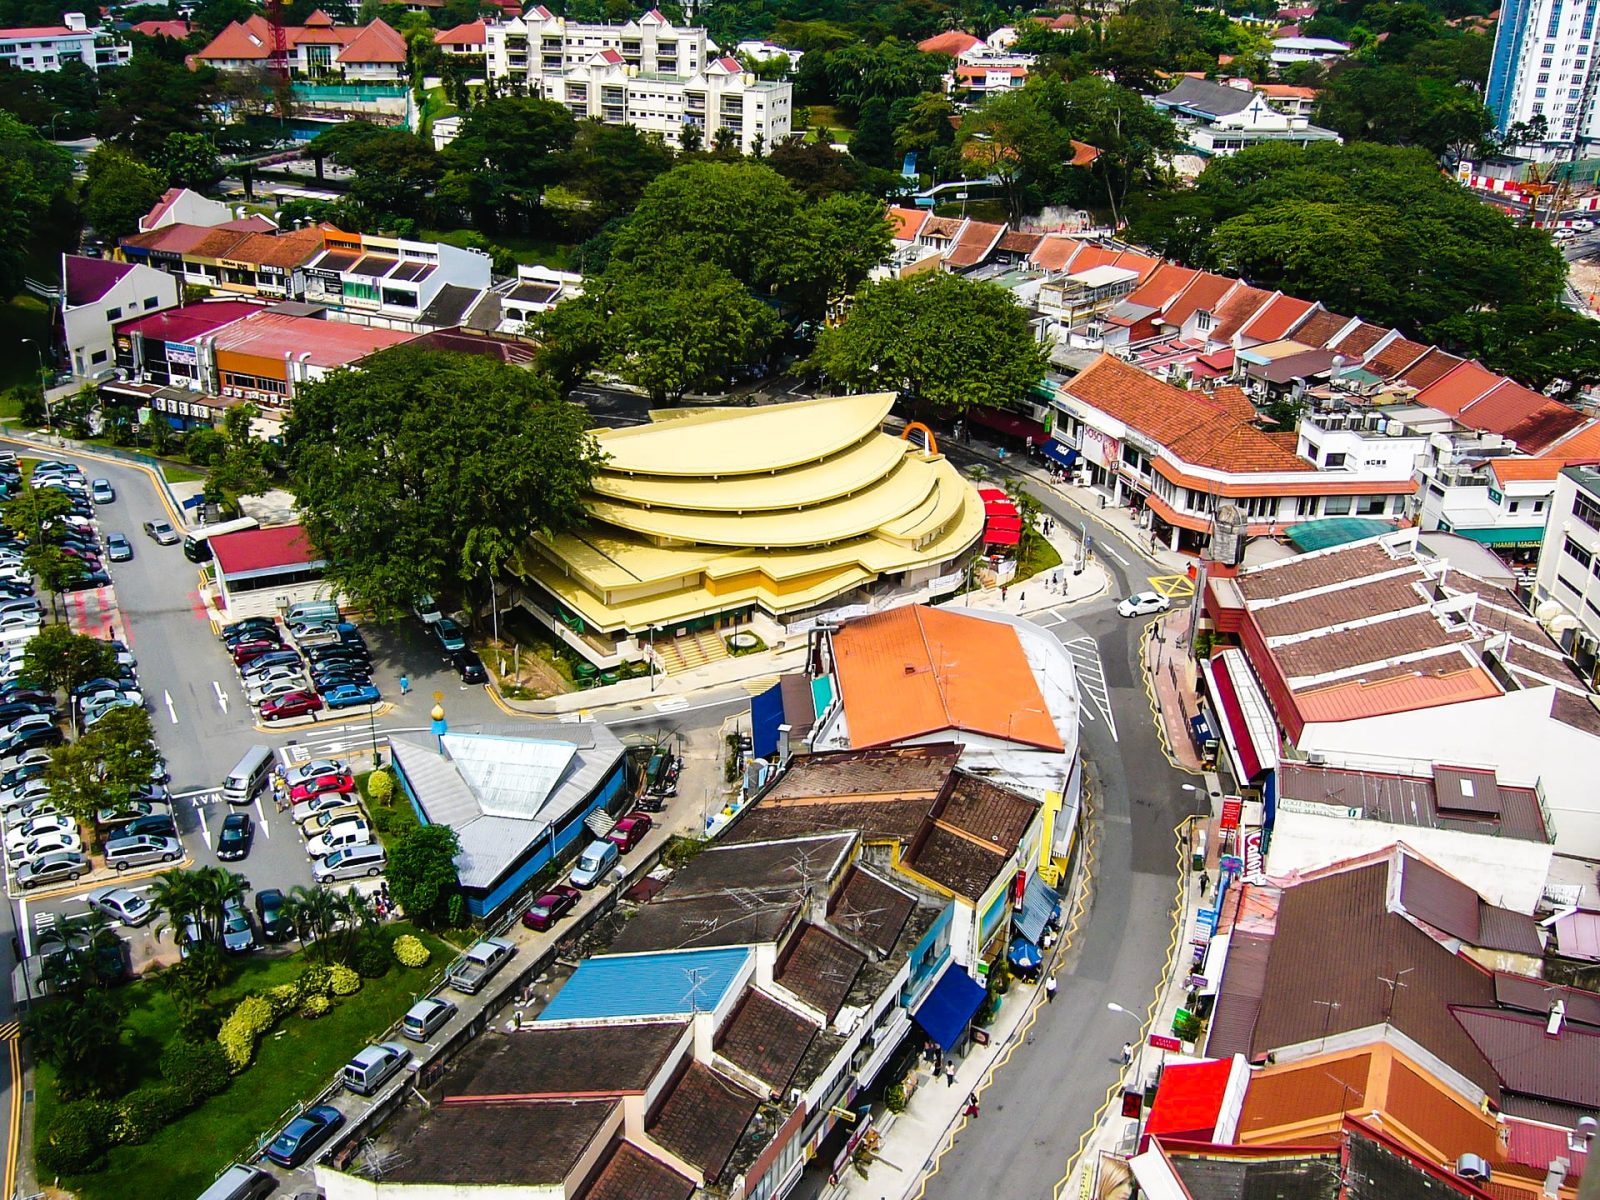
District 10 is home to some popular highlights in Singapore – namely the picturesque Bukit Timah Hill, and the unique bars/local delights of Holland Village.
(Here’s a fun fact, this district is home to Singapore’s most expensive cluster development – Bishopsgate Residences, with an astounding average psf price of $3,899psf!)
In District 10, ‘pricier-than-usual’ landed housing prices ($1,447 psf) and ‘just-as-pricey’ cluster housing prices ($1,134 psf) differ by a price gap of $313 psf.
Cluster homes here have had 190 profitable and 57 loss making transactions so far. This is at an average profit of $768,166 and an average loss of -$444,520.
#15 – District 23 (Hillview/Dairy Farm/Bukit Panjang/Choa Chu Kang)
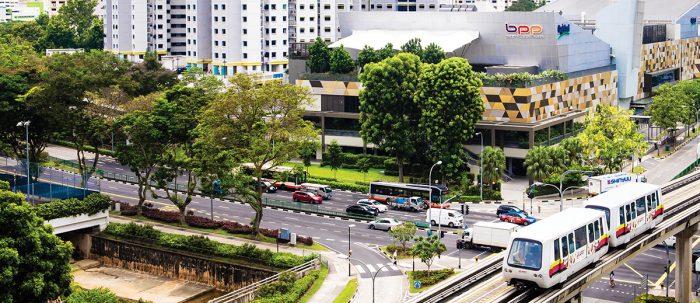
Apart from the abundance of greenery, there are some rather interesting mall and culinary offerings (ie. SpringLeaf Prata @ the Rail Mall), as well as a decent number of primary/secondary educational institutes in the vicinity.
Here, landed housing prices ($1,069 psf) and cluster housing prices ($733 psf) differ by a price gap of $336 psf.
Cluster homes here have had 18 profitable and 12 loss making transactions so far. This is at an average profit of $403,159 and an average loss of -$293,896.
#14 – District 20 (Bishan/Ang Mo Kio)
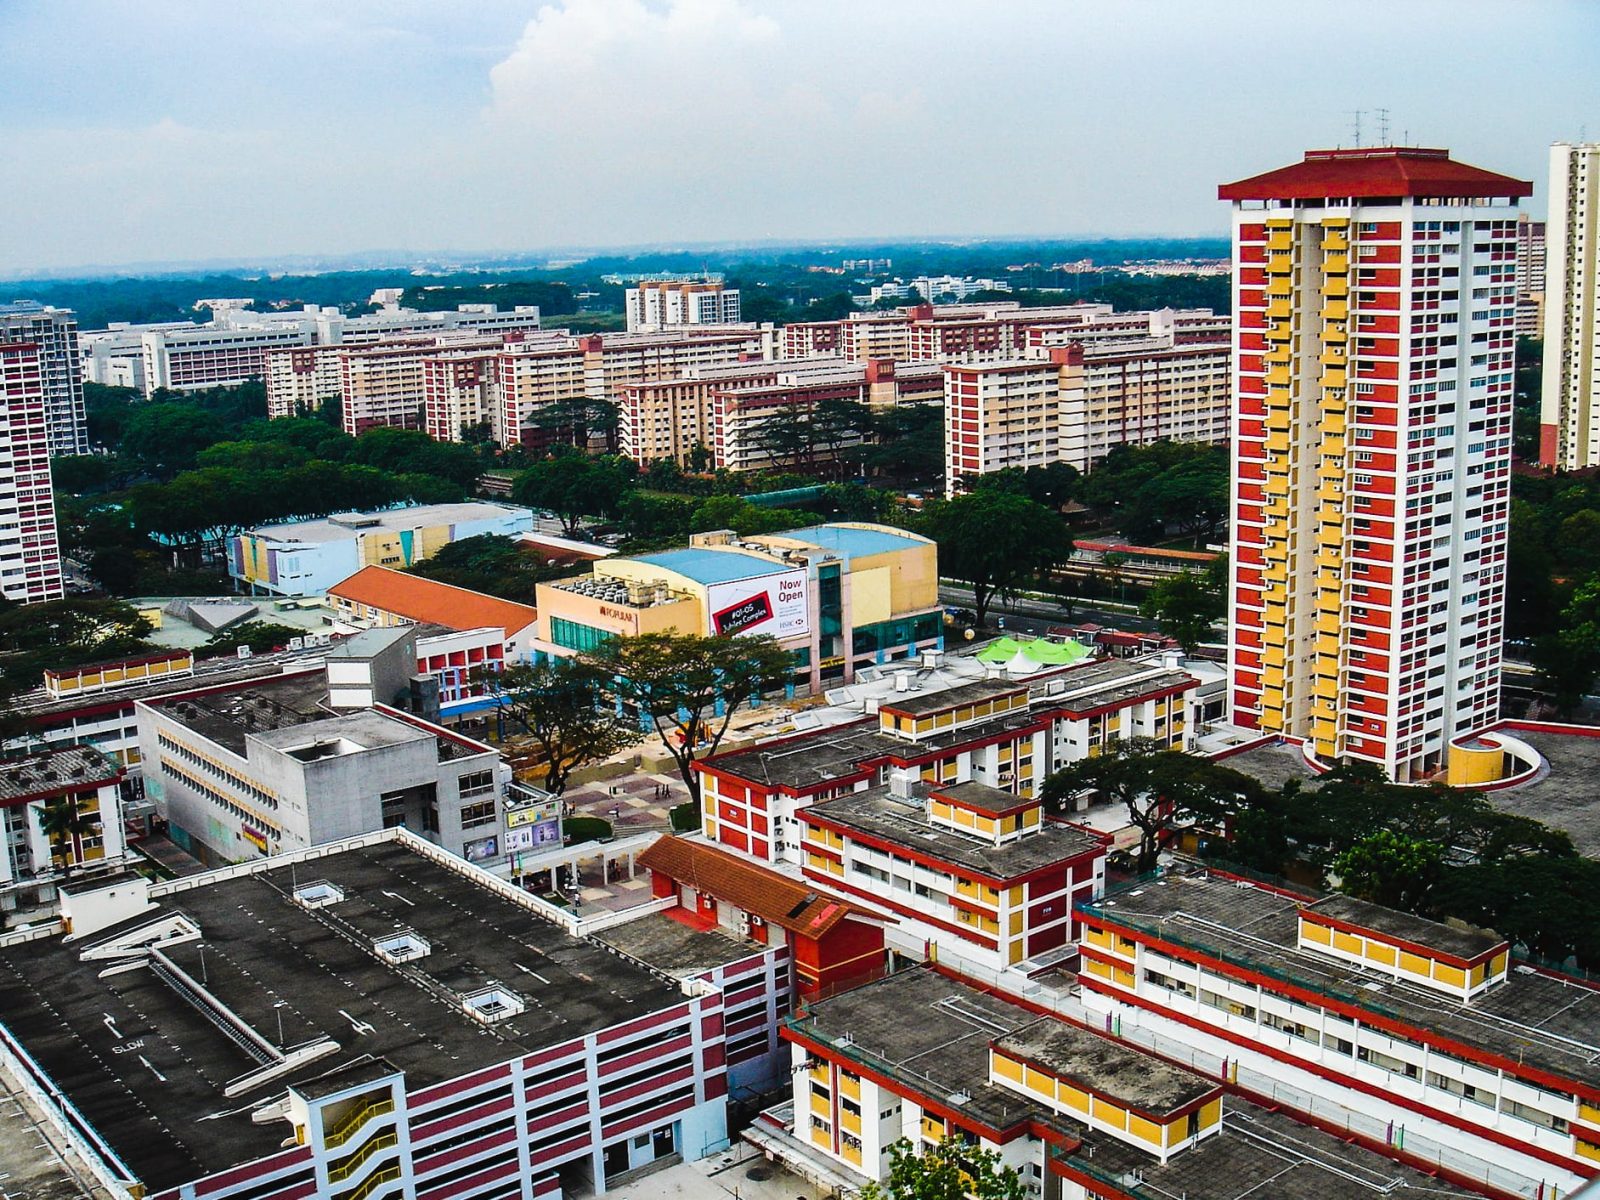
Digressing for a bit, District 20 is one of the few districts in the OCR with highly promising appreciation potential – thanks in part to the already massively utilised central Ang Mo Kio/Bishan MRT station and bus interchange, and the impending Thomson-East Line/Cross Island Line (which will add 2 new MRT stations to Ang Mo Kio)
In District 20, landed housing prices ($1,143 psf) and cluster housing prices ($786 psf) differ by a price gap of $357 psf.
Cluster homes here have had 169 profitable and 45 loss making transactions so far. This is at an average profit of $396,048 and an average loss of -$354,061.
#13 – District 27 (Yishun/Sembawang)
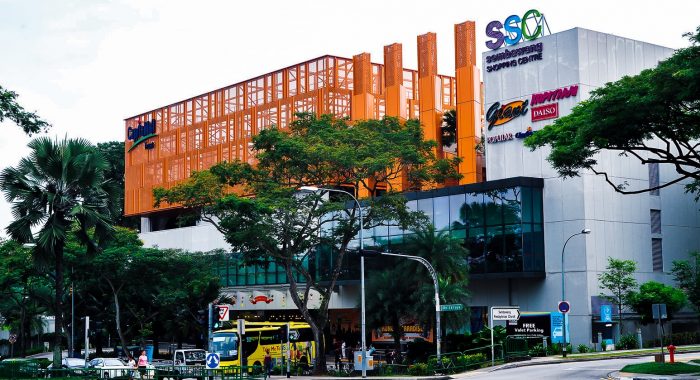
Apart from the occasional crazy (but admittedly entertaining) stories we hear from this part of town, District 27 boasts convenient public transport and a variety of malls, neighbourhood shops and educational institutes that range from well sought-after Primary Schools to top-notched Junior Colleges.
In this district, landed housing prices ($940 psf) and cluster housing prices ($564 psf) differ by a price gap of $376 psf.
Cluster homes here have had 329 profitable and 23 loss making transactions so far. This is at an average profit of $411,786 and an average loss of -$184,639.
#12 – District 5 (Pasir Panjang/Hong Leong Garden/Clementi New Town)
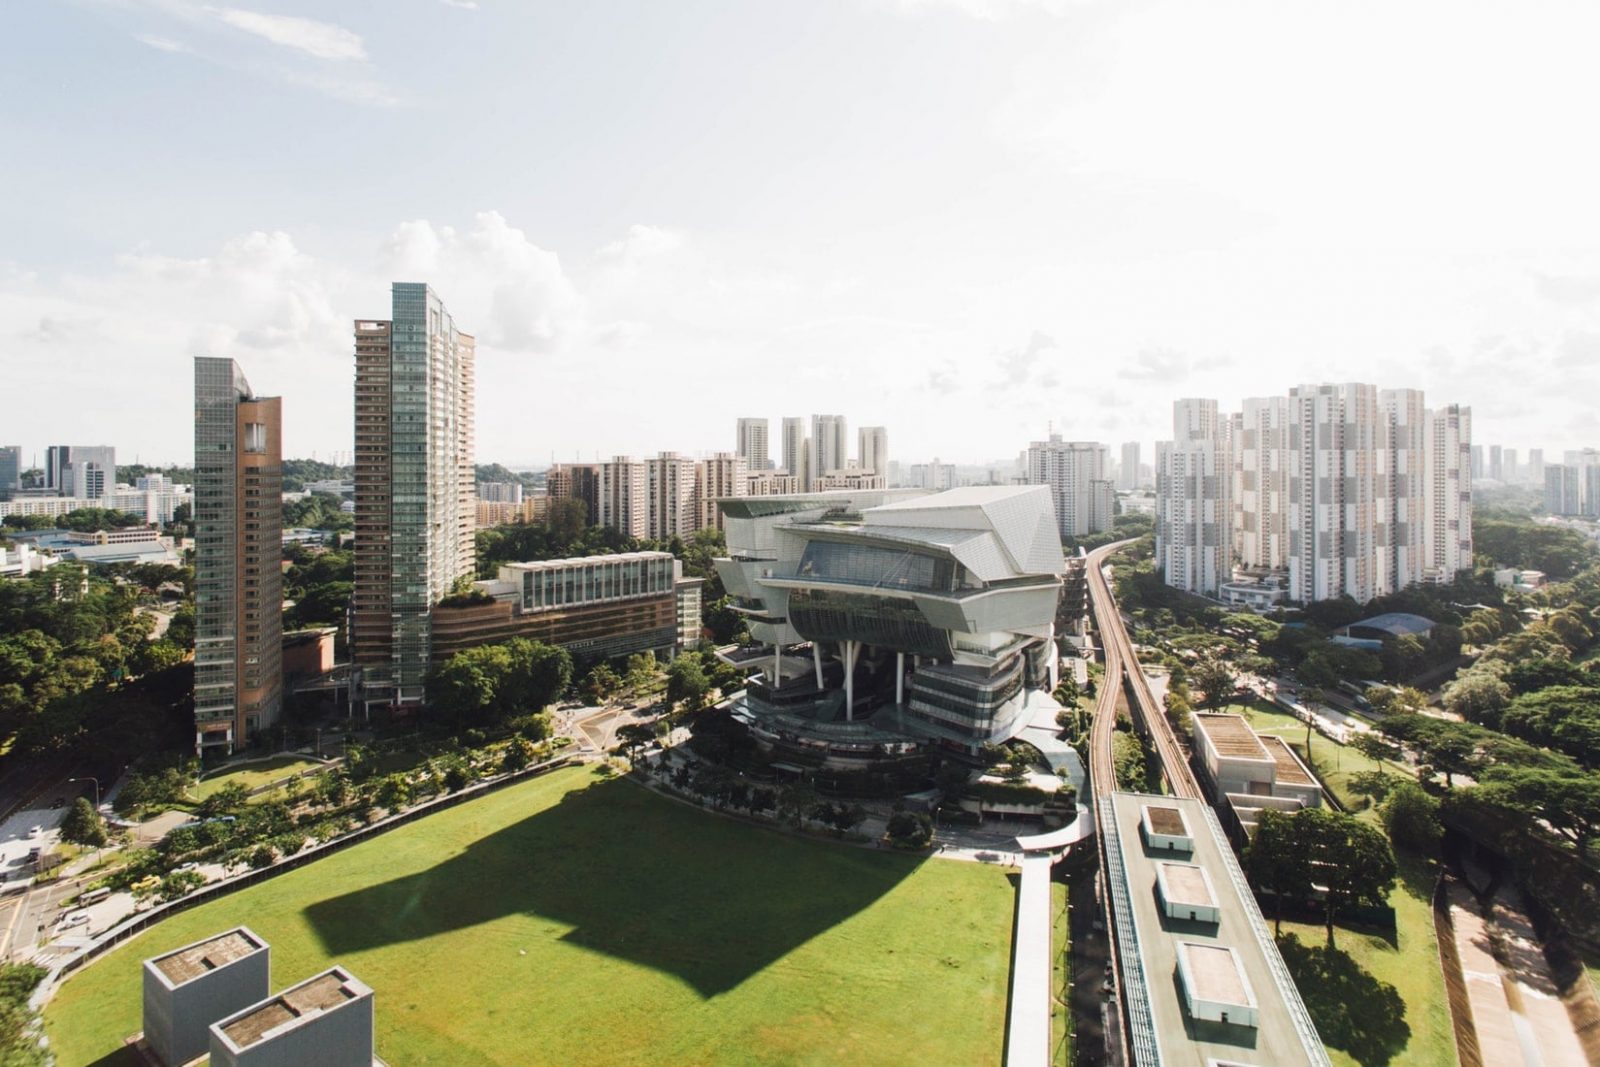
District 5 is another district known for its abundance of renowned educational institutes – including Nan Hua Primary School, Nan Hua High School, NUS High School, Singapore Polytechnic and the National University of Singapore
Here, landed housing prices ($1,121 psf) and cluster housing prices ($732 psf) differ by a price gap of $389 psf.
Cluster homes here have had 88 profitable and 33 loss making transactions so far. This is at an average profit of $399,303 and an average loss of -$245,759.
#11 – District 22 (Jurong/Boon Lay/Tuas)
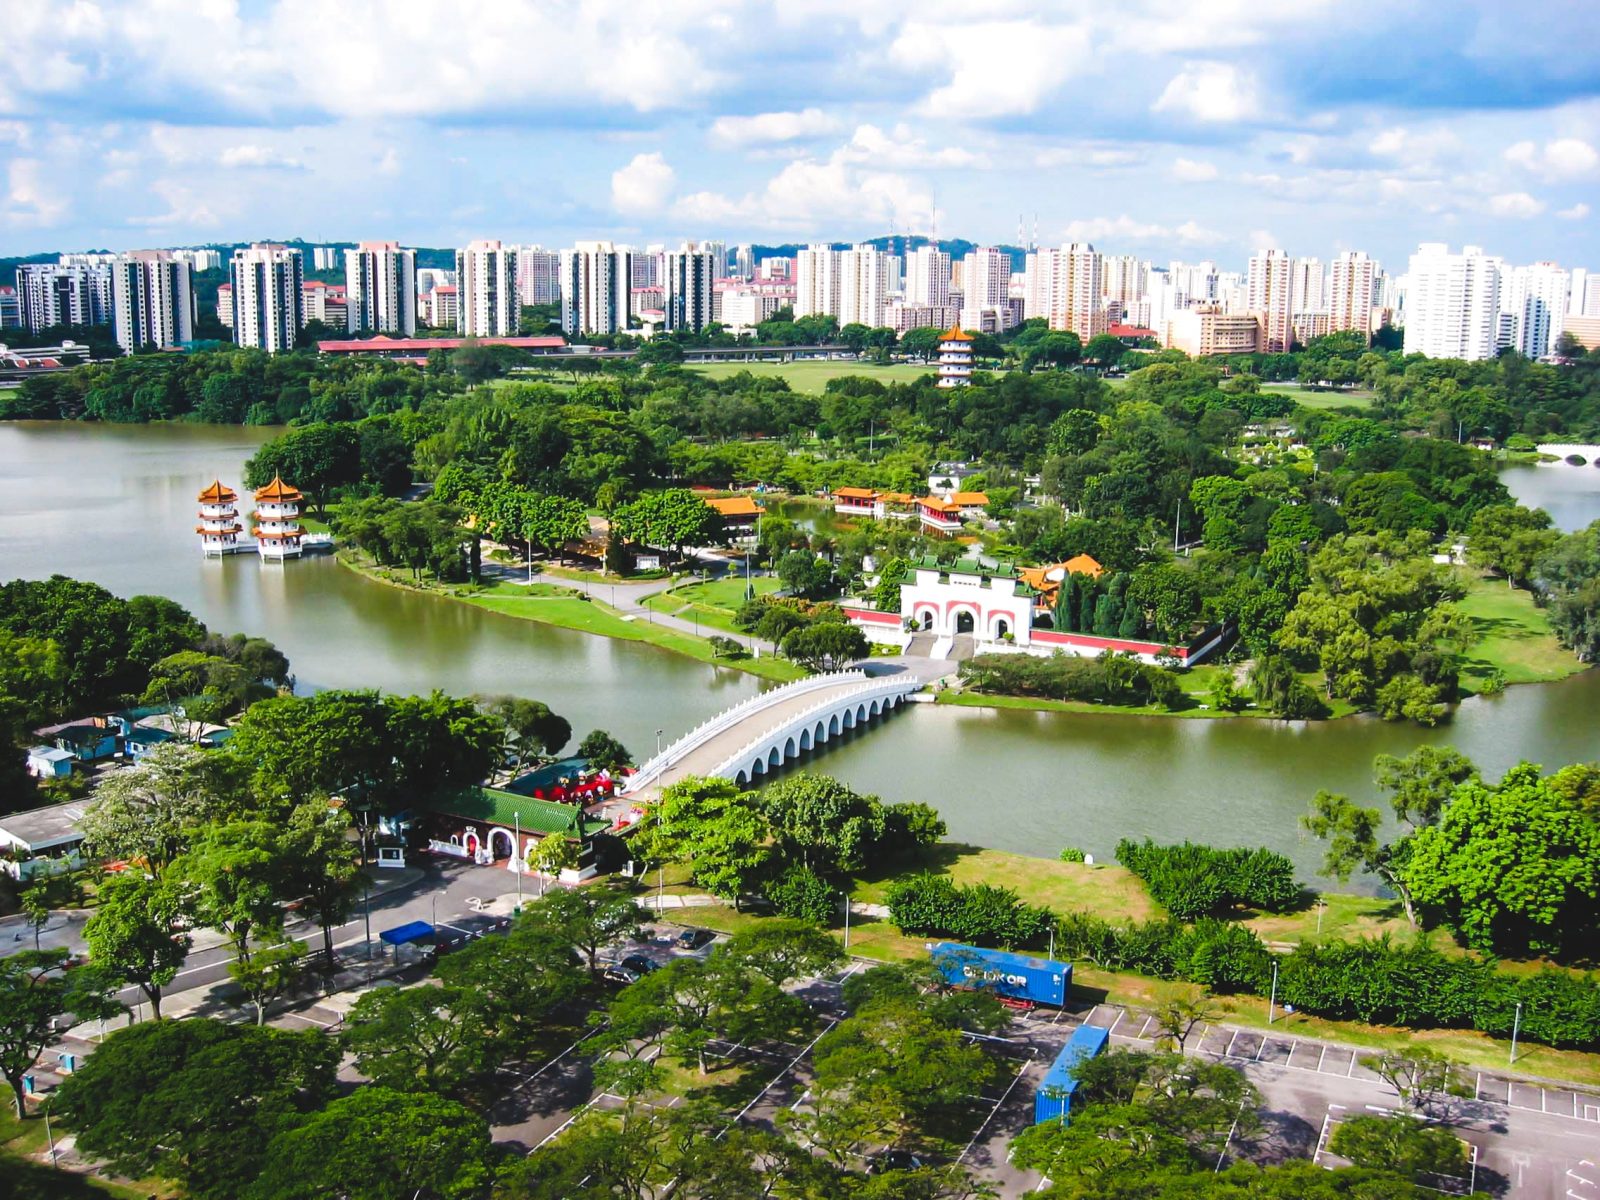
With an entire plethora of upgrades (Jurong Regional Line, Innovation District and Mega Tuas Port) set to rock this district, we’ll definitely be expecting a pickup in housing activity here in the near future.
In the midst of all this activity however, cluster-home hunters might be crestfallen to note that there’s only 1 cluster development in District 22 – The Woods, with an average price of just $372 psf.
Between that and landed housing prices ($763 psf) here, we observe a a price gap of $391 psf.
The one cluster home here has had 2 profitable and 11 loss making transactions so far. This is at an average profit of $35,000 and an average loss of -$280,545.
Property TrendsCluster House: All You Need To Know + 25 years of Price Trends
by Reuben Dhanaraj#10 – District 16 (Bedok/Upper East Coast/Eastwood/Kew Drive)
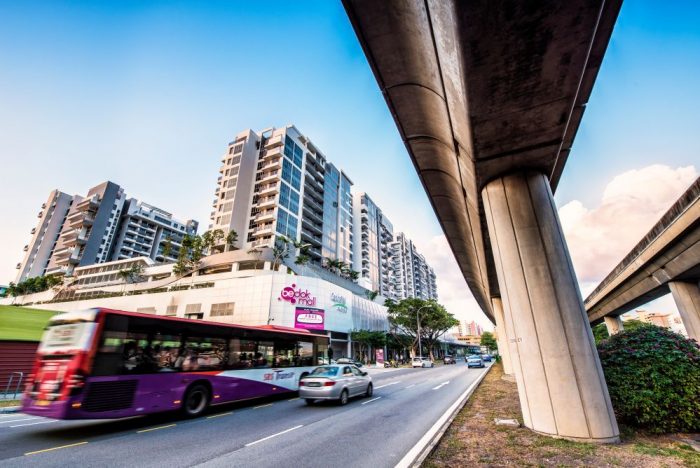
In our previous district-ranking article, we saw that District 16 ranked as the lowest appreciating district over a span of 5 years (Dec 15 to Dec 19) at -7.57%.
Here, landed housing prices ($1,072 psf) and cluster housing prices ($677 psf) differ by a price gap of $395 psf.
Cluster homes here have had 336 profitable and 110 loss making transactions so far. This is at an average profit of $396,799 and an average loss of -$259,960.
#9 – District 18 (Tampines/Simei/Pasir Ris)
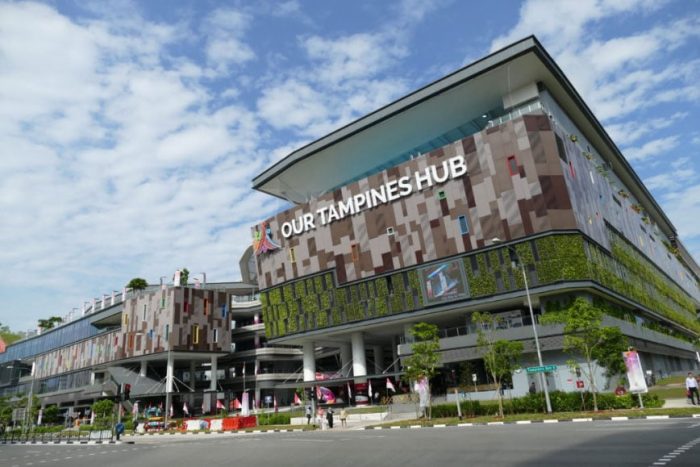
Despite District 18’s extended distance from the city, this region features an incredible variety of amenities and entertainment options, thanks to the entire Downtown East and Tampines cluster of heartland malls.
Similarly to District 22, this district features just 1 cluster development – D’Elias, also, with a relatively low average price of just $389 psf.
Between that and landed housing prices ($806 psf) here, there is a price gap of $417 psf.
The one cluster home here has had 15 profitable and no loss making transactions so far. This is at an average profit of $244,133.
(For those interested, Tampines will soon be home to Singapore’s largest upcoming condominium project – Treasure @ Tampines. Stay tuned for our review on that in the very near future!)
#8 – District 26 (Upper Thomson/Springleaf)
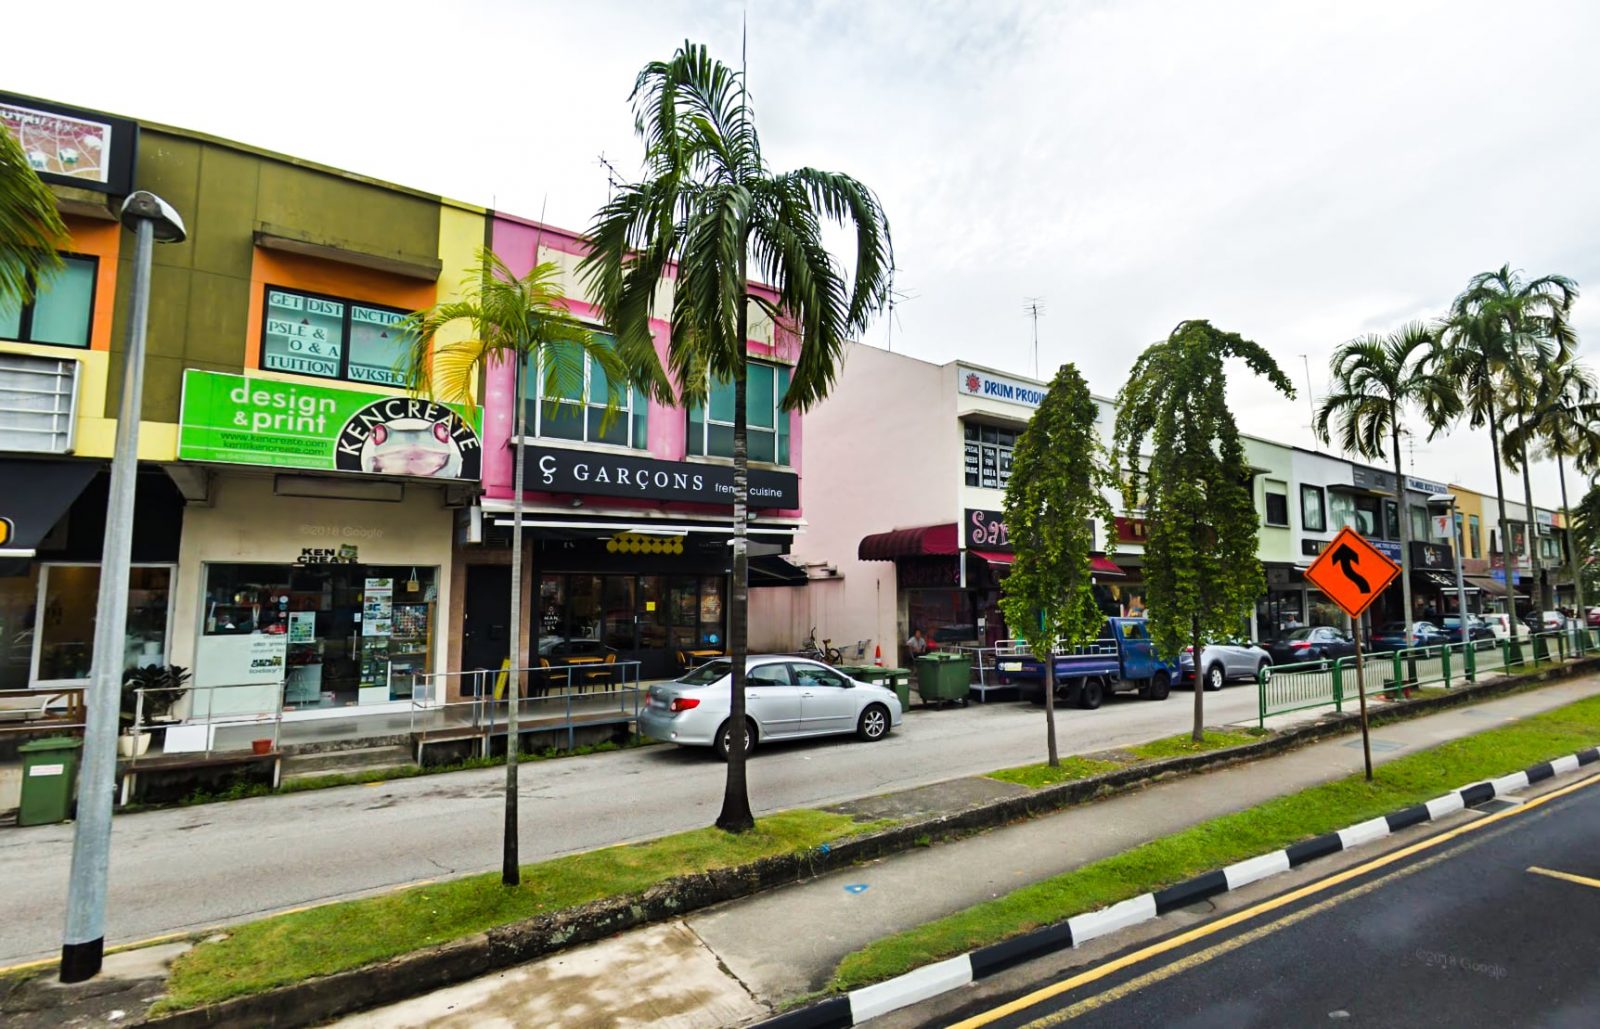
Suited in a large expanse of green (which probably explains the number of camps here), District 26 offers itself as a peaceful respite from the hustle and bustle of the city with its numerous quaint shophouses and enclaved eateries.
Here, landed housing prices ($1,023 psf) and cluster housing prices ($605 psf) differ by a price gap of $418 psf.
More from Stacked
Promenade Peak Pricing Breakdown: How It Compares to Nearby Resale and New Launch Condos
Promenade Peak enters the market at a time when the price gap between the city fringe and prime locations continues…
Cluster homes here have had 64 profitable and 18 loss making transactions so far. This is at an average profit of $423,292 and an average loss of -$184,364.
#7 – District 11 (Watten Estate/Novena/Thomson)
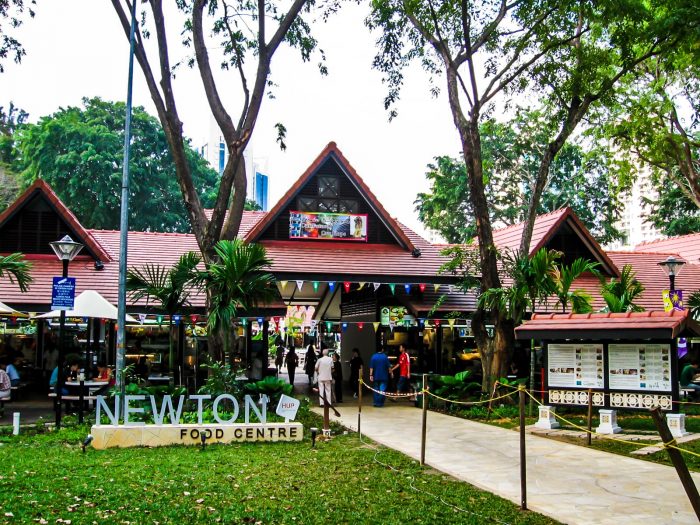
Many of you may already know District 11 for its diversity (and quality) of hospitals/medical services in the area.
In this district, landed housing prices ($1,361 psf) and cluster housing prices ($924 psf) differ by a price gap of $437 psf.
Cluster homes here have had 304 profitable and 62 loss making transactions so far. This is at an average profit of $802,637 and an average loss of -$392,668.
#6 – District 28 (Seletar/Yio Chu Kang)
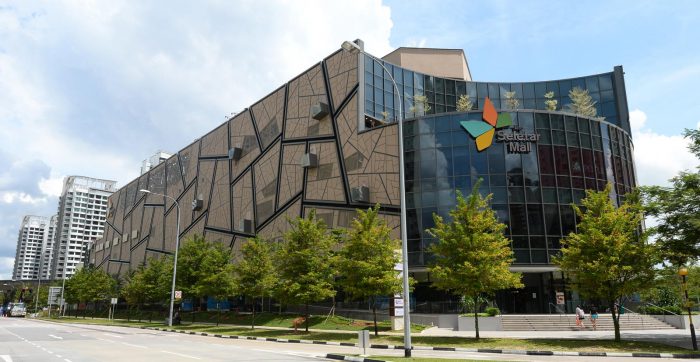
Selatar and Yio Chu Kang offer a unique contrast to each other.
On one hand, the biggest highlight of Seletar is the serenity it offers – from lush spaces and numerous nature offerings (including the entire Upper/Lower Seletar Reservoir area), to the numerous country clubs in the area.
Yio Chu Kang, on the other hand, offers itself as a distinct comparison with its convenient bus interchange, public sports facility megahub and numerous primary/secondary schools in the area.
Here, landed housing prices ($1,151 psf) and cluster housing prices ($712 psf) differ by a price gap of $439 psf.
Cluster homes here have had 95 profitable and 27 loss making transactions so far. This is at an average profit of $358,466 and an average loss of -$146,177.
#5 – District 15 (Katong/Joo Chiat/Amber Road)
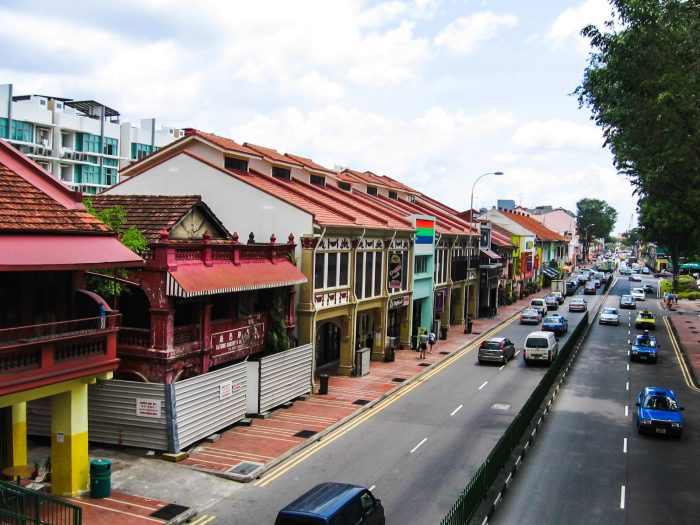
Nestled by the edge of the sea, District 15 is home to a diverse amount of freehold developments.
This region is also a hotspot for those looking to escape the ‘cluttered’ feeling that is present in all of Singapore’s other RCR districts thanks to its proximity to the refreshing East Coast Park.
In this district, landed housing prices ($1,275 psf) and cluster housing prices ($801 psf) differ by a price gap of $474 psf.
Cluster homes here have had 69 profitable and 19 loss making transactions so far. This is at an average profit of $616,209 and an average loss of -$301,298.
#4 – District 14 (Geylang/Eunos)
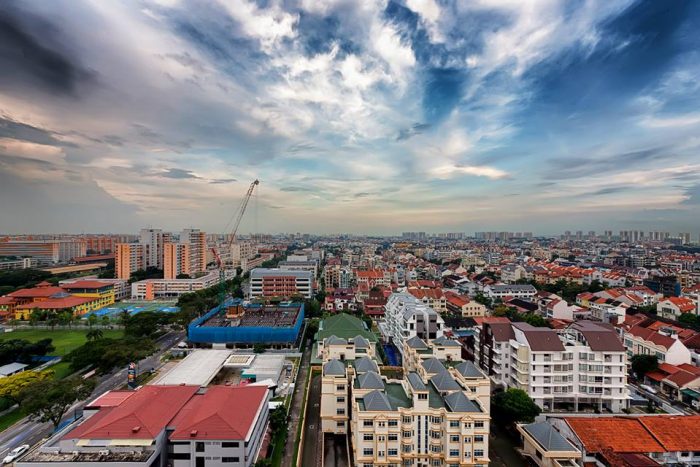
One of Singapore’s most popular city-fringe regions, District 14 is an area filled with good food, amenities and familiar heritage precincts.
Not to mention, the area is also a relatively close drive to the East Coast Beach area, and there is much significance to the centrality of Paya Lebar MRT pertaining to the area’s solid rental demand.
In District 14, landed housing prices ($1,082 psf) and cluster housing prices ($594 psf) differ by a price gap of $488 psf.
Cluster homes here have had 21 profitable and 10 loss making transactions so far. This is at an average profit of $606,651 and an average loss of -$203,646.
#3 – District 21 (Upper Bukit Timah/Clementi Park/Ulu Pandan)

Those who’ve followed my articles for sometime, you know what’s coming!
For my fellow former/existing Ngee Ann Polytechnic students, you’ll find the presence of the Beauty World Centre and food district, as well as the familiar charms of Bukit Timah Plaza to ring a familiar and heartwarming bell.
Here, landed housing prices ($1,249 psf) and cluster housing prices ($689 psf) differ by a price gap of $560 psf.
Cluster homes here have had 109 profitable and 19 loss making transactions so far. This is at an average profit of $545,877 and an average loss of -$248,941.
#2 – District 4 (Telok Blangah/Harbourfront/Sentosa)
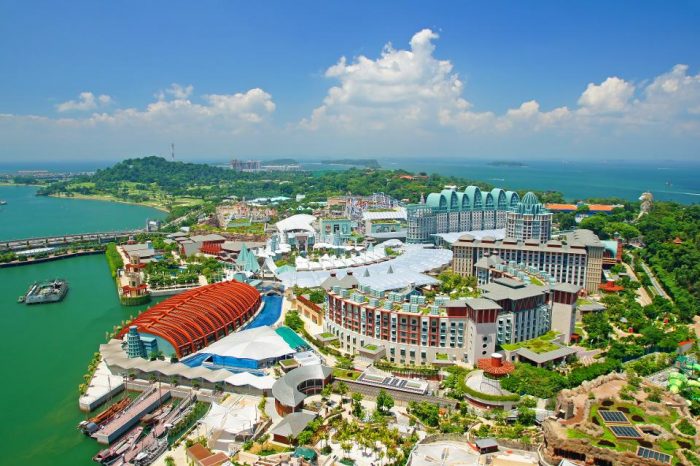
Sitting on the south-west edge of the CBD, District 4 boasts a host of prominent features – from the convenient/efficient transportation networks and the abundance of FnB/entertainment options, to the luxurious waterfront landed residences of Sentosa Cove.
(They might not have amassed incredible appreciation stats over the years, but there’s no denying the beauty of some of the landed homes there)
Here, landed housing prices ($1,552 psf) and cluster housing prices ($707 psf) differ by a price gap of $845 psf.
Cluster homes here have had 10 profitable and 1 loss making transactions so far. This is at an average profit of $933,048 and an average loss of -$40,000.
And now, the moment that you’ve been waiting for!
#1 – District 9 (Orchard/Cairnhill/River Valley)
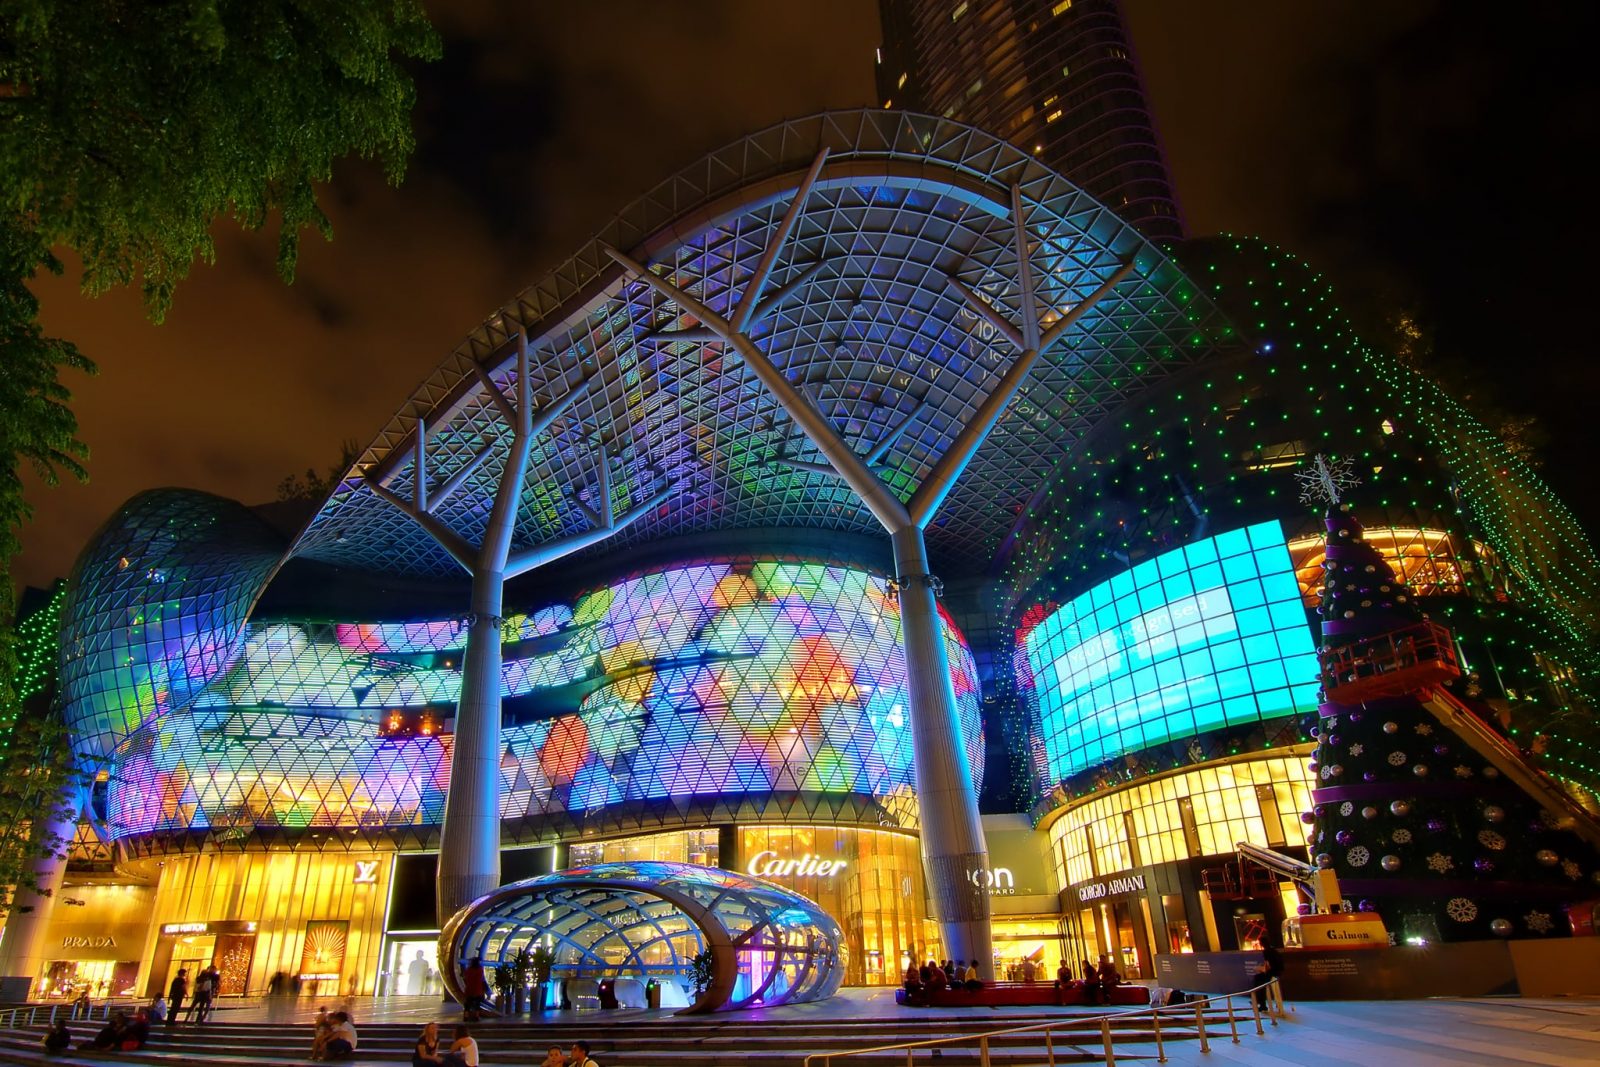
Compared to all the other districts (with District 10 following behind in close second), both landed and cluster housing pricings here are the most expensive in Singapore.
District 9, a region known for its lavish hotels, all-out luxurious lifestyle and an extensive range of freehold developments.
Not to mention, a district that is home to the intense shopping scene of Orchard Road with incredible proximity to key landmarks like the CBD.
The price gap between the average landed housing price ($2,500 psf) and the average cluster housing price ($1,232 psf) is at $1,268 psf.
Cluster homes here have had 3 profitable and 2 loss making transactions so far. This is at an average profit of $2,145,000 and an average loss of -$545,000.
…But it isn’t over yet.
Bonus: Top 10 Most/Least Profitable Cluster Developments to Date!
We figured that since we already had the figures with us, why not display some of the biggest winners and losers (numbers-wise) from the cluster-house sector over the years as well!
Here’s what we found:
| Top 10 Most Profitable Cluster Developments (Based solely on profitable sales) | ||
| Residence | TOP | Average Profit (Quantum Value) |
| Sayang Villa | 2000 | $1,020,000 |
| Residence 8 | 2001 | $1,100,000 |
| Teresa 8 | 2008 | $1,109,429 |
| Sungrove | 1998 | $1,110,093 |
| The Greenwood | 2011 | $1,141,885 |
| Gambier Court | 1999 | $1,160,000 |
| Shamrock Villas | 2014 | $1,617,933 |
| Tudor Ten | 1999 | $1,802,683 |
| Trevose 12 | 2003 | $2,054,155 |
| Dublin Lodge | 1987 | $3,130,000 |
Both Dublin Lodge and Gambier Court are situated in the expensive District 9 (Orchard/Cairnhill/River Valley), but Dublin Lodge is situated perhaps in a more ‘favourable location’.
A mere stone’s throw away from the Orchard Road shopping belt, Dublin Lodge is conveniently set nearby 2 MRT stations and in the midst of a cluster of shopping malls. Factors that no doubt contribute handsomely to the hefty past resale transaction value we see here.
(That said, do note that Dublin Lodge has recorded just the one positive transaction so far, so the figures here do not mean that this is a ‘prime development’ by any means!)
As for our ‘biggest losers’, here’s what we found –
| Top 10 Least Profitable Cluster Developments – (Based solely on unprofitable sales) | ||
| Residence | TOP | Average Loss (Quantum Value) |
| Illoura | 2011 | – $635,313 |
| Sungrove | 1998 | – $650,615 |
| Archipelago | 2015 | – $654,000 |
| The Whitley Residences | 2017 | – $667,500 |
| Bellaville | 2011 | – $686,000 |
| Lynwood Eight | 2010 | – $700,000 |
| Shamrock Villas | 2014 | – $720,000 |
| Chancery Hill Villas | 2017 | – $889,000 |
| Tudor Ten | 1999 | – $951,073 |
| Hillsgrove | 2013 | – $1,058,000 |
Some of the more observant ones amongst us might notice that both Tudor Ten and Shamrock Villas also happen to be on the previous Top 10 (Profitable) List.
Going by that alone, it shows just how small the sample size of cluster houses in Singapore really are, and perhaps more importantly, it highlights the fact that one really good appreciating unit in a cluster housing development doesn’t necessarily mean that the rest of the units will follow suit.
This little scenario highlights the impact that secondary factors such as time of sale, unit specificity (ie. type/maintenance) and even seller profile can have on the pricings of units even in similar developments.
For those who are venturing into the resale market for the first time, it is vital to remember that resale unit availabilities are often volatile, and that ‘pre-selecting’ a particular development/region without first sourcing for the available units in that project/district’s vicinity might not always give you what you thought you might have been looking for at the end of the day.
Final Words
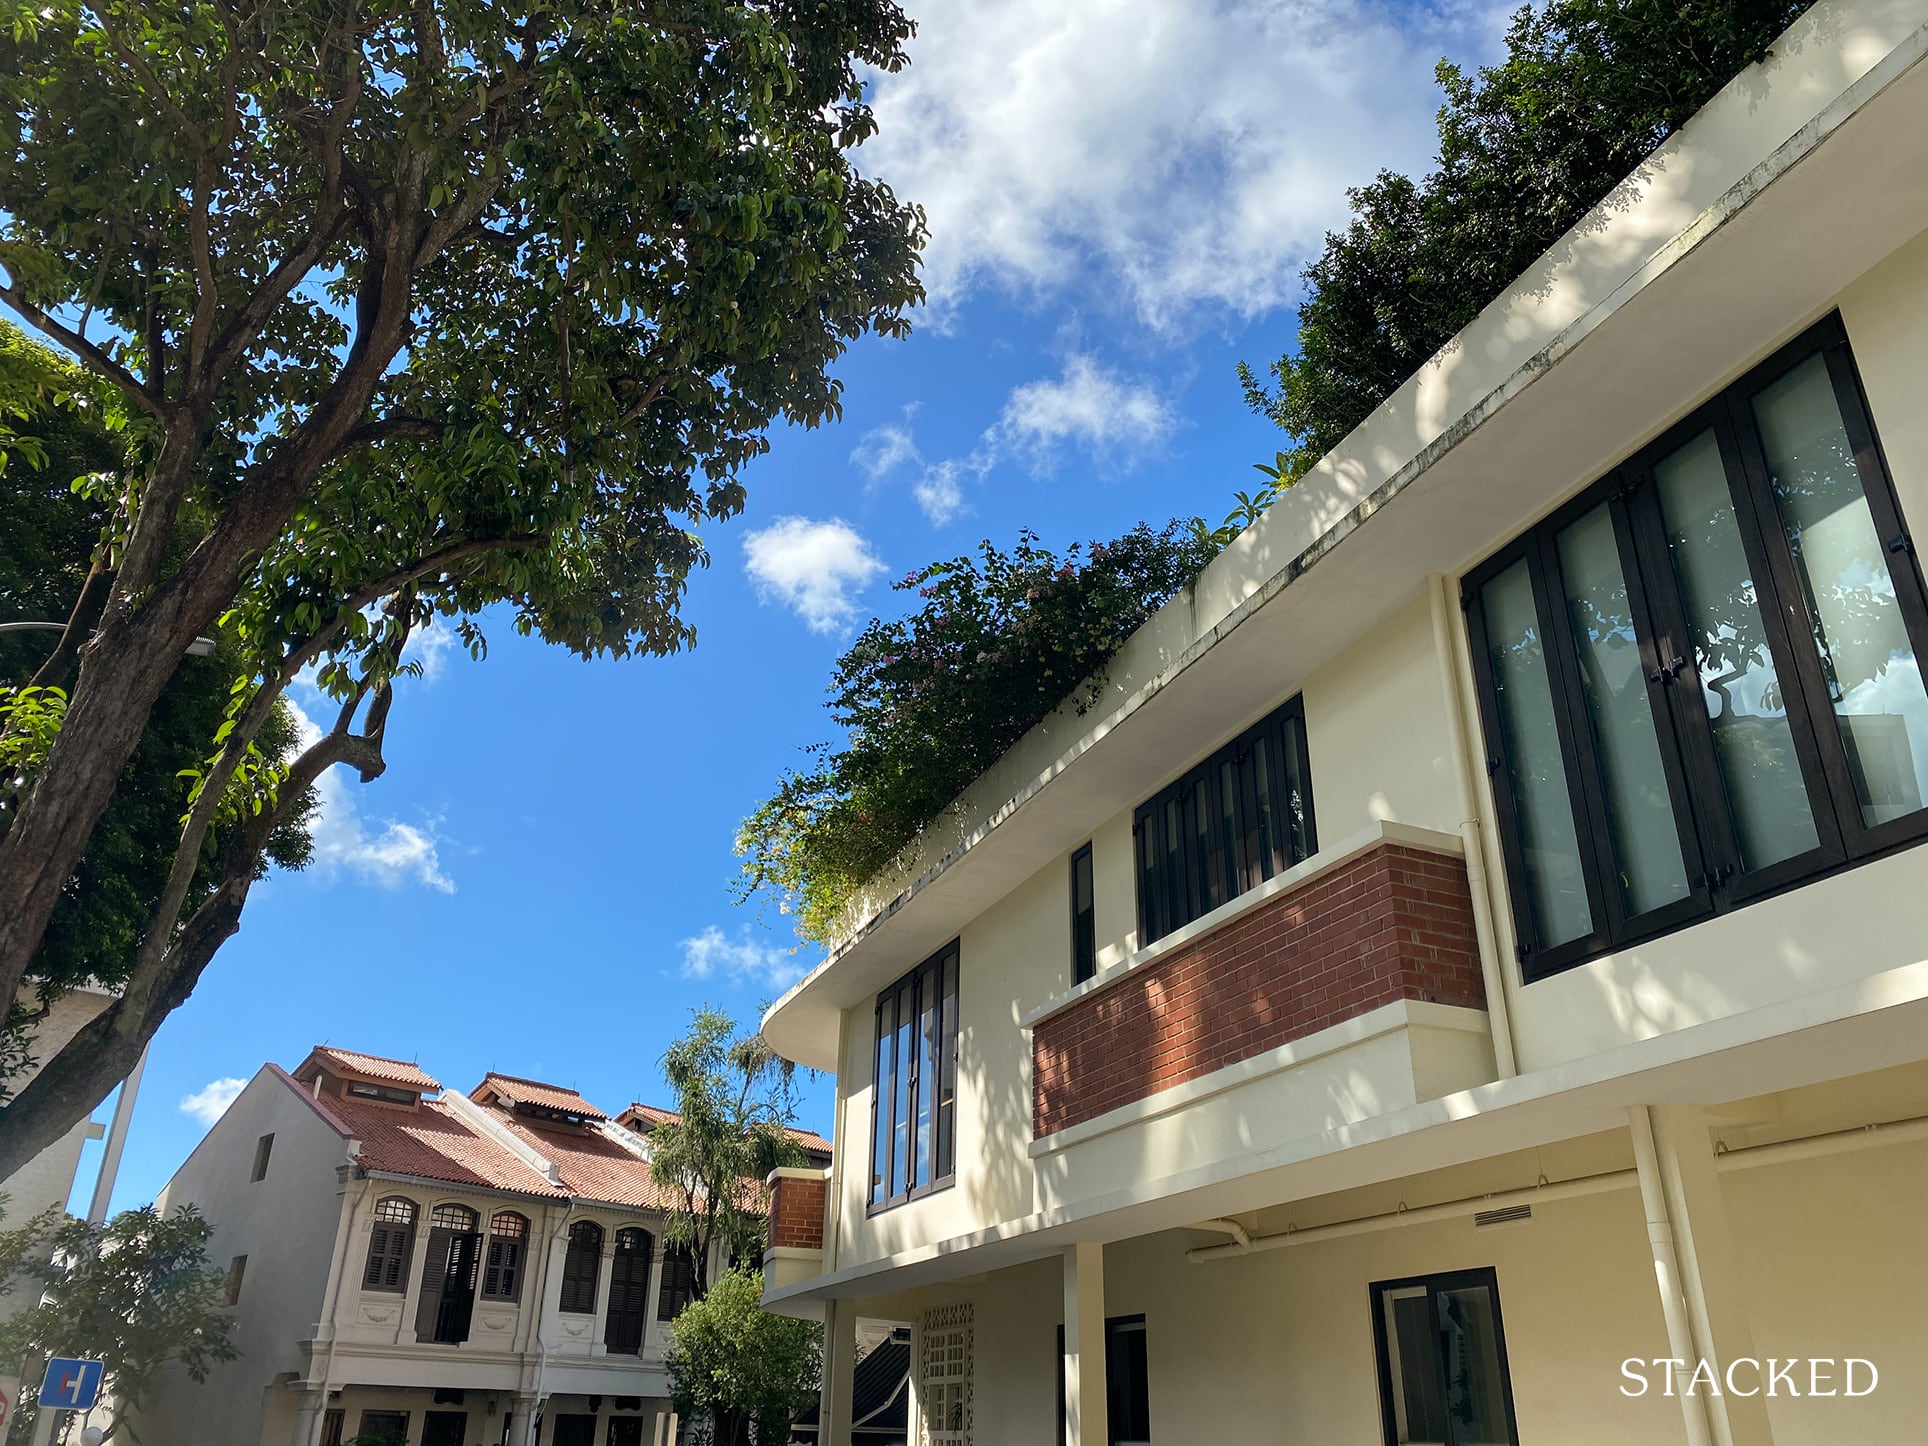
At the end of the day, it’s important to understand that this list hasn’t been formulated to show the districts with the most growth/investment potential.
On the contrary, it is simply a ‘collated affordability list’ for those who would like a first glance at the prices of landed/cluster houses in these districts.
As mentioned earlier, it’s also important to note that both Cluster housing and Landed properties often take up massive unit spaces, so you should also consider the total quantum value of units when looking at these housing types.
…Just because some of the psf values here pale in comparison to many private residentials doesn’t mean that you’ll be walking away with cheaper units as a whole!
As for the landed/cluster housing units that you might come across on your research with ‘affordable’ quantum values, my advice is to avoid jumping at the opportunity immediately.
It doesn’t always mean that you’re walking away with a steal.
Consider and compare the main USPS of the development/district (ie.situated in a relatively quiet location etc.), while evaluating your needs/wants – which might/might not include an efficient home-to-work commute, necessary (neighbouring) amenity requirements and centrality.
It is also important to carry out some further research into resale appreciation and rental yield/rentability potential of your potential housing type/development/unit.
For example, in our previous article where we analysed the last 25 years of cluster housing price trends, we ascertained that cluster houses don’t usually do too well in the way of resale appreciation (as compared to private condos), but tend to have a very profitable rental yield.
Should you have any further queries or requests on further cluster/landed housing-related articles going forward, do feel free to drop us an email at stories@stackedhomes.com.
Till then, stay safe and I’ll see you in the next one!
At Stacked, we like to look beyond the headlines and surface-level numbers, and focus on how things play out in the real world.
If you’d like to discuss how this applies to your own circumstances, you can reach out for a one-to-one consultation here.
And if you simply have a question or want to share a thought, feel free to write to us at stories@stackedhomes.com — we read every message.
Frequently asked questions
Which districts in Singapore have the smallest price gap between cluster and landed houses?
How do the profitability rates of cluster housing transactions vary across districts?
What is the typical price difference between cluster and landed houses in Singapore's districts?
Are there districts where cluster housing prices are close to landed housing prices?
Which districts have the most expensive cluster housing prices?
What factors influence the price gaps between cluster and landed houses in different districts?
Reuben Dhanaraj
Reuben is a digital nomad gone rogue. An avid traveler, photographer and public speaker, he now resides in Singapore where he has since found a new passion in generating creative and enriching content for Stacked. Outside of work, you’ll find him either relaxing in nature or retreated to his cozy man-cave in quiet contemplation.Need help with a property decision?
Speak to our team →Read next from Property Investment Insights
Property Investment Insights This Singapore Condo Has Bigger Units Near The MRT — But Timing Decided Who Made Money

Property Investment Insights We Compared Lease Decay Across HDB Towns — The Differences Are Significant

Property Investment Insights This Singapore Condo Skipped 1-Bedders And Focused On Space — Here’s What Happened 8 Years Later
Property Investment Insights Why Buyers in the Same Condo Ended Up With Very Different Results
Latest Posts
Editor's Pick Happy Chinese New Year from Stacked

Singapore Property News Nearly 1,000 New Homes Were Sold Last Month — What Does It Say About the 2026 New Launch Market?

Editor's Pick How I’d Invest $12 Million On Property If I Won The 2026 Toto Hongbao Draw


4 Comments
another great article on cluster housing ! keep it coming!
i guess CH has more of own-stay demand by buyers, rather than investment (like condos). hence the price is more price elastic.
Thanks for the great article. Good summary i can view everything in a page.