Are Cluster Landed Homes Still Profitable? Here’s How They’ve Performed Over 10 Years
Get The Property Insights Serious Buyers Read First: Join 50,000+ readers who rely on our weekly breakdowns of Singapore’s property market.
A seasoned content strategist with over 17 years in the real estate and financial journalism sectors, Ryan has built a reputation for transforming complex industry jargon into accessible knowledge. With a track record of writing and editing for leading financial platforms and publications, Ryan's expertise has been recognised across various media outlets. His role as a former content editor for 99.co and a co-host for CNA 938's Open House programme underscores his commitment to providing valuable insights into the property market.
Cluster homes are in that weird spot between landed housing and condos. On the one hand, they’re landed; on the other hand, you still have an MCST, and common facilities. But next to walk-up apartments, this may be one of the least studied and understood housing segments: besides being relatively few in number, they tend to have small unit counts with more volatile pricing. This week, we took a look at how these rare properties have been performing:
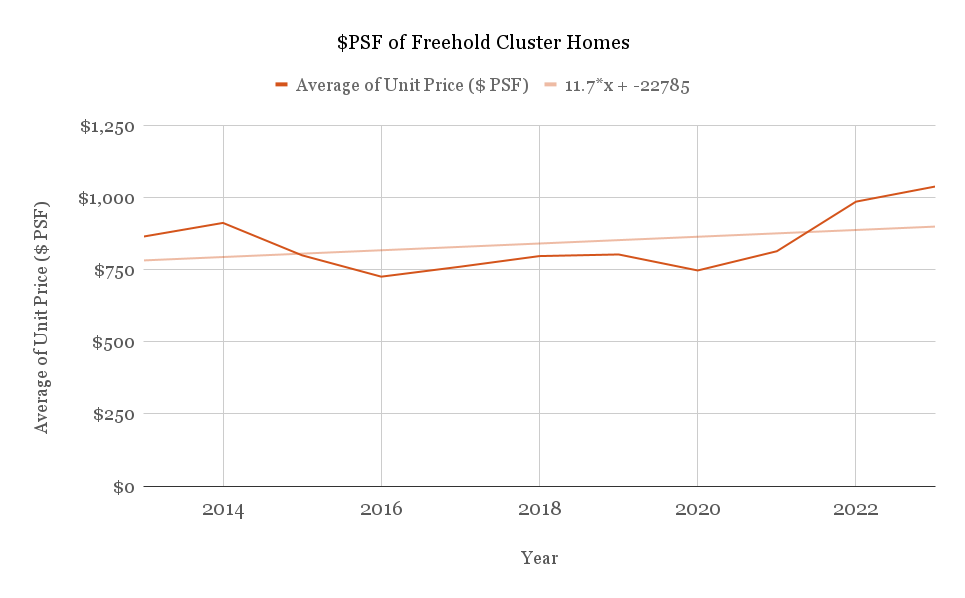
Average price growth for cluster housing (freehold)
| Year | Average of Unit Price ($ PSF) | Change |
| 2013 | $865 | |
| 2014 | $912 | 5.4% |
| 2015 | $799 | -12.3% |
| 2016 | $726 | -9.2% |
| 2017 | $760 | 4.8% |
| 2018 | $797 | 4.8% |
| 2019 | $802 | 0.7% |
| 2020 | $747 | -6.9% |
| 2021 | $814 | 8.9% |
| 2022 | $985 | 21.1% |
| 2023 | $1,038 | 5.3% |
| Avg Change | 2.26% | |
From 2013 to the present, freehold cluster homes have seen an average gain of 2.26 per cent. As we mentioned above, however, these units are not common, and 1,760 transactions over 10 years is a very low number.
Nonetheless, let’s contrast this against leasehold cluster homes:
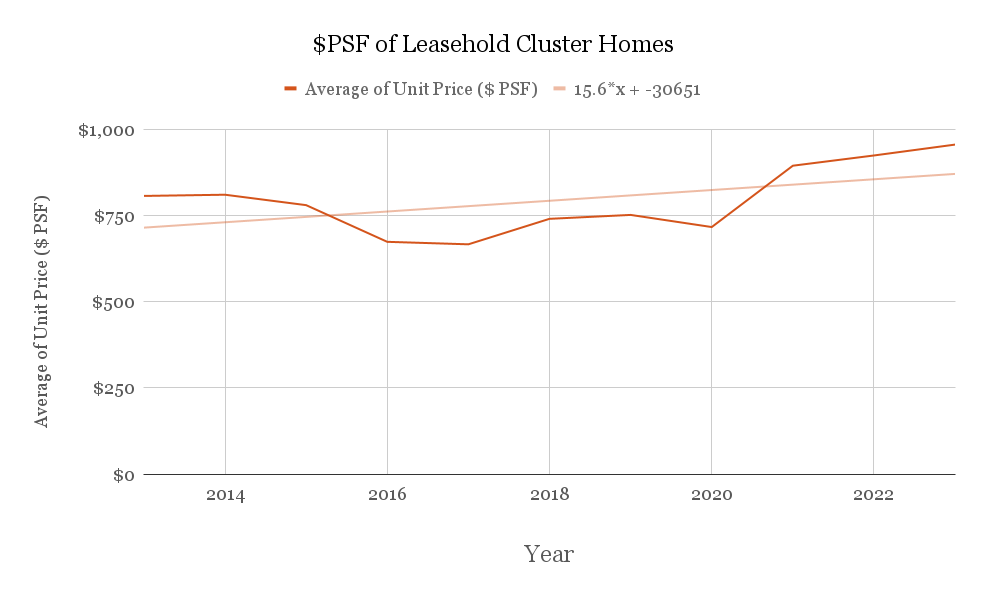
Average price growth for cluster housing (leasehold)
| Year | Average of Unit Price ($ PSF) | Change |
| 2013 | $807 | |
| 2014 | $810 | 0.4% |
| 2015 | $780 | -3.7% |
| 2016 | $674 | -13.6% |
| 2017 | $666 | -1.1% |
| 2018 | $740 | 11.1% |
| 2019 | $752 | 1.5% |
| 2020 | $716 | -4.7% |
| 2021 | $894 | 24.8% |
| 2022 | $924 | 3.3% |
| 2023 | $956 | 3.4% |
| Avg Change | 2.15% | |
The average performance is slightly inferior to freehold counterparts, coming in at an average of close to 2.15 per cent. However, we’re still working with low transaction volumes, with just 1,582 transactions over the past decade.
While freehold cluster homes performed slightly better on average, there could be other factors that aren’t visible here.
When leasehold properties are down to 60 years or fewer, banks often lower the maximum loan amount; the loan-to-value (LTV) ratio may be reduced to 55 per cent from 75 per cent, resulting in a much higher cash outlay. This could drive prices down, especially since landed homes tend to be bigger and fetch a higher quantum.
Some realtors have also opined that older leasehold landed properties are harder to sell. Most landed property buyers are looking for intergenerational assets, rather than something with 60 or fewer years on the lease. Evidence for this is anecdotal though, and the sentiment for such homes may be different as compared to true landed homes. After all, the appeal of a cluster home is the bigger space and landed living at a more affordable (and less maintenance) price.
Now let’s look at average annualised returns:
| Project | Tenure | Avg Annualised (%) | Avg Holding Period (Yr) | Average Profit ($) | Avg Profit (%) | No. of Tnx |
| CHATEAU LA SALLE | Freehold | 33.6% | 0.3 | $300,000 | 9.1% | 1 |
| ASTON RESIDENCE | 946 yrs from 01/01/1938 | 21.3% | 2.7 | $816,667 | 39.2% | 3 |
| HILLSGROVE | 999 yrs from 02/12/1878 | 13.6% | 3.6 | $1,385,000 | 56.5% | 2 |
| DUNSFOLD 18 | Freehold | 13.1% | 2.9 | $1,200,000 | 42.9% | 1 |
| THE HILLOFT | 999 yrs from 12/10/1885 | 10.1% | 2.3 | $730,000 | 24.7% | 1 |
| MARLENE VILLE | Freehold | 9.0% | 4.1 | $807,963 | 40.1% | 3 |
| HORIZON GREEN | 99 yrs from 23/06/1995 | 8.6% | 4.2 | $699,320 | 39.2% | 4 |
| THE SILVER SPURZ | Freehold | 8.0% | 4.6 | $818,500 | 44.8% | 2 |
| SURIN VILLAS | Freehold | 7.5% | 5.6 | $1,200,000 | 50.0% | 1 |
| LE ROYCE @ LEITH PARK | Freehold | 7.2% | 5.7 | $900,000 | 48.6% | 1 |
| SOLARIS RESIDENCES | Freehold | 7.0% | 6.1 | $1,050,000 | 51.2% | 1 |
| AFFINITY AT SERANGOON | 99 yrs from 18/05/2018 | 6.7% | 4.3 | $759,990 | 33.1% | 3 |
| CABANA | 103 yrs from 23/04/2009 | 6.6% | 5.2 | $620,298 | 33.5% | 7 |
| KENT RIDGE HILL RESIDENCES | 99 yrs from 10/11/2018 | 6.6% | 2.8 | $569,380 | 19.6% | 1 |
| PARKWOOD COLLECTION | 99 yrs from 22/09/2017 | 6.6% | 3.1 | $727,000 | 21.9% | 1 |
| BELGRAVIA GREEN | Freehold | 6.4% | 3.7 | $752,801 | 24.0% | 7 |
| MONTCLAIR @ WHITLEY | Freehold | 6.0% | 4.8 | $932,667 | 33.6% | 3 |
| PALM TREE NINES | Freehold | 6.0% | 6.5 | $690,000 | 45.7% | 1 |
| GOODMAN CREST | Freehold | 6.0% | 4.3 | $1,062,500 | 29.4% | 2 |
| SHAMROCK VILLAS | Freehold | 5.8% | 3.7 | $880,000 | 23.2% | 1 |
| THE WOODS | 99 yrs from 09/03/2010 | 5.7% | 3.0 | $350,000 | 17.9% | 1 |
| NAMLY COURT | Freehold | 5.6% | 3.6 | $850,000 | 24.7% | 2 |
| WHITLEY VILLAS | Freehold | 5.5% | 4.8 | $900,000 | 29.0% | 1 |
| WATERCOVE | Freehold | 5.3% | 4.2 | $669,254 | 26.5% | 7 |
| THE SHAUGHNESSY | 99 yrs from 19/03/2001 | 5.1% | 5.5 | $407,568 | 27.6% | 19 |
| THE TOP RESIDENCE | 999 yrs from 14/07/1884 | 5.1% | 3.9 | $450,000 | 21.4% | 1 |
| CHARLTON RESIDENCES | Freehold | 5.0% | 3.8 | $570,000 | 20.4% | 1 |
| ESTRIVILLAS | Freehold | 4.9% | 5.0 | $920,000 | 27.2% | 1 |
| RIVERFRONT RESIDENCES | 99 yrs from 31/05/2018 | 4.9% | 3.2 | $415,000 | 16.5% | 1 |
| BOTANIC @ CLUNY PARK | Freehold | 4.8% | 5.9 | $2,100,000 | 32.1% | 2 |
| SUMMER GARDENS | 99 yrs from 23/06/1995 | 4.7% | 5.8 | $343,333 | 18.3% | 3 |
| BINJAI CREST | 99 yrs from 13/12/1996 | 4.6% | 5.4 | $452,953 | 22.6% | 9 |
| TRANQUILIA @ KISMIS | Freehold | 4.5% | 5.7 | $980,000 | 28.8% | 1 |
| KEW GATE | 99 yrs from 03/02/1994 | 4.4% | 5.4 | $360,600 | 28.4% | 5 |
| LEGEND @ JANSEN | 999 yrs from 01/09/1876 | 4.2% | 5.0 | $444,333 | 23.7% | 3 |
| CASA FIDELIO | Freehold | 4.1% | 3.9 | $320,000 | 17.0% | 1 |
| ELITE RESIDENCES | Freehold | 4.1% | 4.6 | $521,700 | 20.2% | 1 |
| CHESTNUT RESIDENCES | 999 yrs from 25/09/1882 | 4.1% | 4.5 | $450,000 | 19.6% | 1 |
| SPRINGHILL | 99 yrs from 07/01/2002 | 4.0% | 5.3 | $299,280 | 22.2% | 29 |
| JANSEN 8 | Freehold | 4.0% | 5.1 | $476,000 | 20.2% | 3 |
| THE SPRINGFIELD | 99 yrs from 22/06/1995 | 3.9% | 6.3 | $337,833 | 22.5% | 12 |
| INFINIUM | Freehold | 3.7% | 4.1 | $507,403 | 17.1% | 4 |
| D’ELIAS | 999 yrs from 22/03/1881 | 3.7% | 3.9 | $273,000 | 15.2% | 1 |
| BELGRAVIA ACE | Freehold | 3.6% | 2.1 | $341,000 | 7.7% | 1 |
| THE GARDENS AT GERALD | 999 yrs from 01/01/1879 | 3.6% | 4.0 | $289,500 | 15.2% | 2 |
| TRUSSVILLE | Freehold | 3.6% | 4.3 | $282,000 | 16.4% | 1 |
| FORTUNE VIEW | Freehold | 3.6% | 5.0 | $266,250 | 16.8% | 4 |
| MILFORD VILLAS | Freehold | 3.6% | 7.9 | $625,000 | 33.7% | 2 |
| D’ KENARIS | 999 yrs from 01/01/1879 | 3.5% | 7.7 | $600,000 | 30.8% | 1 |
| ONE SURIN | Freehold | 3.5% | 5.3 | $497,424 | 19.2% | 8 |
| THE GREENWOOD | 103 yrs from 02/06/2008 | 3.5% | 4.8 | $530,000 | 18.0% | 1 |
| WATER VILLAS | Freehold | 3.3% | 5.5 | $370,000 | 16.1% | 2 |
| THE MORRIS RESIDENCES | Freehold | 3.3% | 4.9 | $493,333 | 17.7% | 3 |
| HILLCREST VILLA | 99 yrs from 03/08/2006 | 3.2% | 5.0 | $468,273 | 16.2% | 22 |
| DUBLIN LODGE | Freehold | 3.2% | 9.3 | $1,700,000 | 34.0% | 1 |
| RIDGEWOOD | 999 yrs from 06/07/1885 | 3.2% | 5.8 | $962,500 | 27.9% | 2 |
| LOTUS VILLE | Freehold | 3.1% | 5.9 | $573,028 | 18.9% | 4 |
| HIGH PARK RESIDENCES | 99 yrs from 05/11/2014 | 3.0% | 5.9 | $420,000 | 20.7% | 5 |
| PALM GROVE REGENCY | 999 yrs from 02/12/1878 | 2.8% | 4.0 | $231,667 | 10.6% | 3 |
| SUNCOTTAGES | 999 yrs from 09/01/1883 | 2.8% | 4.8 | $10,000 | 2.3% | 2 |
| MEDALLION | Freehold | 2.8% | 4.9 | $320,000 | 14.7% | 1 |
| THE TENERIFFE | 99 yrs from 07/09/1996 | 2.8% | 5.6 | $374,808 | 14.7% | 11 |
| RIVERTREES RESIDENCES | 99 yrs from 28/08/2013 | 2.7% | 5.9 | $215,433 | 13.0% | 3 |
| THE AMBIENCE | 999 yrs from 01/05/1874 | 2.6% | 4.4 | $235,000 | 12.0% | 2 |
| WATTEN RESIDENCES | Freehold | 2.6% | 4.3 | $410,000 | 11.9% | 5 |
| HORIZON GARDENS | 99 yrs from 23/06/1995 | 2.6% | 7.2 | $444,000 | 23.9% | 3 |
| KINGSFORD WATERBAY | 99 yrs from 03/03/2014 | 2.5% | 4.5 | $254,950 | 14.1% | 4 |
| THOMSON THREE | 99 yrs from 07/11/2012 | 2.5% | 5.5 | $425,000 | 15.3% | 2 |
| JEWEL @ CHUAN HOE | 999 yrs from 01/01/1886 | 2.5% | 8.7 | $575,000 | 25.9% | 2 |
| WOLSKEL LODGE | Freehold | 2.5% | 3.7 | $151,000 | 8.0% | 2 |
| PLACE-8 | Freehold | 2.5% | 3.3 | $230,000 | 8.4% | 1 |
| GENTLE REFLECTIONS | Freehold | 2.5% | 6.5 | $550,000 | 17.2% | 1 |
| WATERFRONT @ FABER | 99 yrs from 17/09/2013 | 2.4% | 6.7 | $395,725 | 16.7% | 4 |
| SERANGOON GARDEN VIEW | 999 yrs from 23/01/1879 | 2.4% | 3.6 | $162,000 | 8.8% | 1 |
| RESIDENCE 8 | Freehold | 2.3% | 5.9 | $700,000 | 14.6% | 1 |
| FERNHILL COTTAGE | Freehold | 2.3% | 3.3 | $220,000 | 7.8% | 1 |
| EIGHT RIVERSUITES | 99 yrs from 11/07/2011 | 2.2% | 5.7 | $195,429 | 12.8% | 7 |
| BARKER VILLE | Freehold | 2.2% | 6.7 | $450,000 | 15.5% | 1 |
| ECO | 99 yrs from 14/05/2012 | 2.1% | 6.6 | $418,000 | 13.7% | 5 |
| D’MANOR | 99 yrs from 14/03/1997 | 2.1% | 5.0 | $172,833 | 9.9% | 6 |
| JC VILLE | Freehold | 2.1% | 7.0 | $317,500 | 15.4% | 2 |
| ATELIER VILLAS | Freehold | 2.0% | 5.6 | $293,633 | 15.1% | 6 |
| CHARLTON VILLAS | Freehold | 2.0% | 3.4 | $150,000 | 6.8% | 1 |
| THOMSON IMPRESSIONS | 99 yrs from 12/01/2015 | 1.9% | 2.9 | $175,000 | 7.1% | 2 |
| CHARLTON 18 | Freehold | 1.9% | 4.2 | $234,875 | 8.2% | 4 |
| VENTURA HEIGHTS | Freehold | 1.9% | 5.2 | $51,667 | 4.2% | 3 |
| SOMMERVILLE REGENCY | Freehold | 1.8% | 7.2 | $269,444 | 12.9% | 2 |
| LANGE 28 | 999 yrs from 02/12/1878 | 1.7% | 4.0 | $106,112 | 7.1% | 1 |
| PALACIO | Freehold | 1.6% | 6.8 | $185,211 | 6.4% | 5 |
| BELGRAVIA VILLAS | Freehold | 1.6% | 5.6 | $295,353 | 9.5% | 27 |
| KEW RESIDENCIA | 99 yrs from 03/02/1994 | 1.5% | 7.1 | $182,333 | 12.3% | 3 |
| PLATINA GARDENS | Freehold | 1.4% | 6.5 | $170,000 | 9.6% | 1 |
| GILSTEAD BROOKS | Freehold | 1.4% | 6.5 | $289,000 | 9.6% | 2 |
| TERRA VILLAS | Freehold | 1.4% | 5.4 | $240,000 | 7.8% | 1 |
| VICTORY VILLE | Freehold | 1.4% | 4.3 | $150,000 | 6.0% | 1 |
| URBAN VILLAS | Freehold | 1.3% | 3.4 | $130,000 | 4.6% | 1 |
| ALANA | 103 yrs from 12/08/2013 | 1.3% | 6.2 | $99,625 | 6.1% | 8 |
| THE ARECA | 99 yrs from 08/11/2000 | 1.3% | 6.8 | $244,444 | 15.8% | 2 |
| KOVAN REGENCY | 99 yrs from 24/04/2012 | 1.2% | 9.8 | $443,298 | 13.8% | 2 |
| RIA TOWNHOUSES | Freehold | 1.2% | 3.3 | $88,000 | 3.9% | 1 |
| POETS VILLAS | 99 yrs from 01/04/2010 | 1.1% | 5.4 | $126,000 | 6.3% | 3 |
| SOMMERVILLE RESIDENCES | Freehold | 1.1% | 8.7 | $300,000 | 9.7% | 1 |
| THE CHANCERY RESIDENCE | 99 yrs from 31/01/2004 | 0.9% | 8.0 | $181,400 | 7.5% | 5 |
| HONG KONG PARK | 999 yrs from 07/05/1879 | 0.9% | 4.6 | $200,000 | 9.0% | 2 |
| TERESA 8 | Freehold | 0.8% | 8.3 | $200,000 | 6.9% | 1 |
| CHANCERY HILL VILLAS | Freehold | 0.8% | 4.5 | $165,250 | 4.2% | 4 |
| 8 @ STRATTON | Freehold | 0.7% | 6.1 | $59,000 | 2.3% | 2 |
| ARCHIPELAGO | 99 yrs from 01/06/2011 | 0.7% | 8.0 | $200,000 | 5.7% | 1 |
| KALEIDO | Freehold | 0.7% | 4.1 | $91,103 | 2.8% | 1 |
| MARINE GARDEN | Freehold | 0.6% | 5.5 | $60,000 | 3.3% | 1 |
| ENGLISH VILLAS | Freehold | 0.4% | 8.5 | $100,000 | 3.6% | 1 |
| CHARLTON 27 | Freehold | 0.4% | 6.0 | -$64,657 | -1.3% | 6 |
| CENTURION RESIDENCES | Freehold | 0.4% | 4.7 | $48,008 | 1.9% | 1 |
| GRANDIOSO 8 | Freehold | 0.2% | 10.1 | $90,000 | 2.4% | 1 |
| SEVEN CRESCENT | Freehold | 0.2% | 6.0 | $40,000 | 1.2% | 3 |
| LYNNSVILLE 331 | Freehold | 0.2% | 4.5 | $6,667 | 0.6% | 3 |
| DALLA VALE | Freehold | 0.1% | 4.6 | $207,500 | 12.1% | 4 |
| PALMS @ SIXTH AVENUE | Freehold | 0.1% | 7.7 | $65,263 | 1.4% | 7 |
| WOODHAVEN | 99 yrs from 07/02/2011 | 0.1% | 7.5 | $73,705 | 2.8% | 2 |
| ONE CHILTERN | Freehold | 0.1% | 8.7 | $19,988 | 0.6% | 1 |
| THE FORD @ HOLLAND | Freehold | 0.0% | 8.0 | $3,000 | 0.1% | 1 |
| VERDANA VILLAS | Freehold | 0.0% | 6.9 | -$90,556 | -1.3% | 2 |
| ILLOURA | Freehold | -0.1% | 7.0 | $125,000 | 2.2% | 2 |
| D’LEEDON | 99 yrs from 08/04/2010 | -0.3% | 5.4 | -$1,377,680 | -6.8% | 2 |
| VILLAS LA VUE | Freehold | -0.3% | 9.3 | -$100,000 | -2.7% | 1 |
| ESTE VILLA | Freehold | -0.6% | 3.8 | -$12,500 | -0.4% | 2 |
| WILKINSON 8 | Freehold | -0.6% | 5.0 | -$90,000 | -3.2% | 1 |
| WEST SHORE RESIDENCES | Freehold | -0.7% | 8.0 | -$219,979 | -5.9% | 3 |
| SELETAR VIEW | 999 yrs from 01/01/1879 | -0.7% | 6.2 | -$100,000 | -4.3% | 1 |
| EUHABITAT | 99 yrs from 06/12/2010 | -1.2% | 5.9 | -$644,700 | -14.7% | 2 |
| THE WHITLEY RESIDENCES | Freehold | -1.3% | 8.1 | -$417,956 | -8.0% | 9 |
| ELEVEN @ HOLLAND | 99 yrs from 06/12/2010 | -1.8% | 9.9 | -$750,000 | -16.7% | 1 |
| HILLSTA | 99 yrs from 03/10/2011 | -2.7% | 4.0 | -$271,943 | -8.1% | 3 |
| LYNWOOD EIGHT | Freehold | -3.9% | 4.8 | -$700,000 | -17.5% | 1 |
| GAMBIER COURT | 99 yrs from 03/02/1997 | -4.0% | 3.8 | -$545,000 | -14.3% | 1 |
| THE SEAWIND | Freehold | -4.0% | 7.3 | -$1,308,500 | -25.6% | 1 |
More from Stacked
Why Jervois Mansion Sold 98% During Launch: We Break Down A Successful Project Launch
If you haven’t heard already, Jervois Mansion has now fully sold out, with its show flat completely packed up.
When we look at average annualised returns, we might see some confirmation of realtors’ claims. The top 11 entries, from Chateau La Salle to Solaris Residences, are all freehold, 999-years, or some variation thereof. Conversely, the bottom of the table has more leasehold cluster landed homes, such as Gambier Court, Hillsta, and Eleven @ Holland.
It is, however, tough to generalise further. Notice that many of the projects only have a single transaction, which makes prices volatile: if the previous transaction had special reasons (e.g., an urgent sale, or a buyer picking a final home with no intent of resale), this will significantly skew the price of the transaction that comes right after it.
In addition to this, cluster housing projects can have very unique quirks. Chateau La Salle is a good example of this: this project only has six units, and whilst floor plans are unavailable, the last transaction was for a unit of over 4,800 sq.ft., whilst way back in 2001 there was a record of an 11,923 sq.ft. unit being bought here. Buyers can’t really find this elsewhere.
As another example, Gambier Court is a 23-unit within the Robertson Quay area in District 9. It’s also a freehold project dating back to 1999, which suffers by contrast – it’s often expected that a District 9 condo will be freehold, which may explain the lower profitability of a 25-year-old leasehold unit here.
Next, let’s look at the most and least expensive cluster housing projects to date, by price per square foot
These cluster housing projects were the most expensive:
| Project | Tenure | Average of Unit Price ($ PSF) |
| BISHOPSGATE RESIDENCES | Freehold | $3,908 |
| RIDGEWOOD | 999 yrs from 06/07/1885 | $1,886 |
| NAMLY COURT | Freehold | $1,751 |
| FERNHILL COTTAGE | Freehold | $1,735 |
| KENT RIDGE HILL RESIDENCES | 99 yrs from 10/11/2018 | $1,683 |
| GREENWOOD MEWS | 103 yrs from 03/10/2011 | $1,602 |
| BOTANIC @ CLUNY PARK | Freehold | $1,462 |
| AFFINITY AT SERANGOON | 99 yrs from 18/05/2018 | $1,437 |
| RIVERFRONT RESIDENCES | 99 yrs from 31/05/2018 | $1,427 |
| JC VILLE | Freehold | $1,382 |
Unsurprisingly, freehold cluster homes make up the majority due to their premium pricing.
Bishopsgate Residences is a bit of a shocker with that price tag, but this is a Kajima project – this developer was also involved with Resorts World Sentosa and Marina Bay Financial Centre, hence the exorbitant price tag. The 31-unit project is also close to the cluster of foreign embassies near the Grange Road area, so it may be targeted at the likes of ambassadors and dignitaries, or those who may rent to them.
These cluster housing projects were the cheapest:
| Project | Tenure | Average of Unit Price ($ PSF) |
| NORTHSHORE BUNGALOWS | Freehold | $419 |
| SUNGROVE | 99 yrs from 05/12/1994 | $431 |
| SURIN VILLAS | Freehold | $560 |
| THE WOODS | 99 yrs from 09/03/2010 | $567 |
| THE HILLOFT | 999 yrs from 12/10/1885 | $580 |
| TERESA VILLAS | Freehold | $617 |
| KIARA 10 | Freehold | $629 |
| THE SHAUGHNESSY | 99 yrs from 19/03/2001 | $679 |
| ASTON RESIDENCE | 946 yrs from 01/01/1938 | $680 |
| LYNWOOD EIGHT | Freehold | $682 |
Northshore Bungalows and Sungrove are probably eye-openers for the low price. For Northshore, this is due to its location at Punggol Point back in 1995. This was long before any of the amenities at Punggol today existed. Waterway Point was only finished 21 years after this condo was built, and it was about the same time before there was an LRT stop. So it was launched at very low prices given the poor accessibility and lack of amenities, but you could expect it to rise in the coming years.
For Sun Grove, you can check out this article for a bit more on this West Coast landed area. This is another example of an area that was undesirable in the ‘90s, as there was poor accessibility and amenities. The area is heavily improved today, but it’s still one of the most affordable places to buy a landed property.
There’s no getting around the fact that, when it comes to cluster homes with their small unit counts, performance can be very unpredictable
As such, these projects are better suited for own-stay use. For resale gains, condos tend to be more predictable. Cluster homes are angled at homeowners who like landed living, but cannot handle serious maintenance issues like roofing, repainting the facade, or building their own pool.
For more on the Singapore property market, and how prices are moving in various property segments, follow us on Stacked. If you’d like to get in touch for a more in-depth consultation, you can do so here.
Ryan J. Ong
A seasoned content strategist with over 17 years in the real estate and financial journalism sectors, Ryan has built a reputation for transforming complex industry jargon into accessible knowledge. With a track record of writing and editing for leading financial platforms and publications, Ryan's expertise has been recognised across various media outlets. His role as a former content editor for 99.co and a co-host for CNA 938's Open House programme underscores his commitment to providing valuable insights into the property market.Read next from Property Investment Insights
Property Investment Insights How A Once “Ulu” Condo Launched In 1997 Became A Top Performer
Property Investment Insights This 698-Unit Ang Mo Kio Condo Launched At The Wrong Time — And Still Outperformed Peers
Property Investment Insights These Resale Condos In Singapore Were The Top Performers In 2025 — And Not All Were Obvious Winners

Property Investment Insights How A 944-Unit Mega-Condo In Pasir Ris Ended Up Beating The Market
Latest Posts
On The Market Here Are The Cheapest 4-Room HDB Flats in Central Singapore You Can Still Buy From $490K
Editor's Pick Should We Buy An Old 99-Year Leasehold Condo To Live In: Will It’s Value Fall When The Lease Runs Out?
Editor's Pick I Reviewed A New Launch 4-Bedroom Penthouse At Beauty World

Property Market Commentary When Renting In Singapore Is The Smarter Move — And Buying Can Wait
Editor's Pick Why Singaporean Families Are Looking At This Landed Enclave From Around $4M
Singapore Property News Lentor’s First Condo Is Complete — The Early Profits May Surprise You
Editor's Pick A Wave Of New HDB Resale Supply Is Coming In 2026: Here’s Where To Find Them

Property Advice We Own A $800K 1-Bedder And A $1.1M 3-Bedder: Is It Possible To Upgrade To A 4-Bedder Condo?
On The Market These Are Some Of The Cheapest 5-Room HDB Flats Left In Central Singapore
Singapore Property News $281.2M in Singapore Shophouse Deals in 2H2025 — But That Number Doesn’t Tell the Full Story
Property Market Commentary 5 Key Features Buyers Should Expect in 2026 New Launch Condos
Editor's Pick What “Lucky” Singaporean Homebuyers Used To Get Away With — That You Can’t Today

Singapore Property News CapitaLand–UOL’s $1.5 Billion Hougang Central Bid May Put Future Prices Above $2,500 PSF
Singapore Property News Why New Condo Sales Fell 87% In November (And Why It’s Not a Red Flag)
Editor's Pick We Toured A Quiet Freehold Landed Area Near Reputable Schools — Where Owners Rarely Sell
