2021 Year-End Review Of The Singapore Property Market: Key Numbers And Trends
December 31, 2021
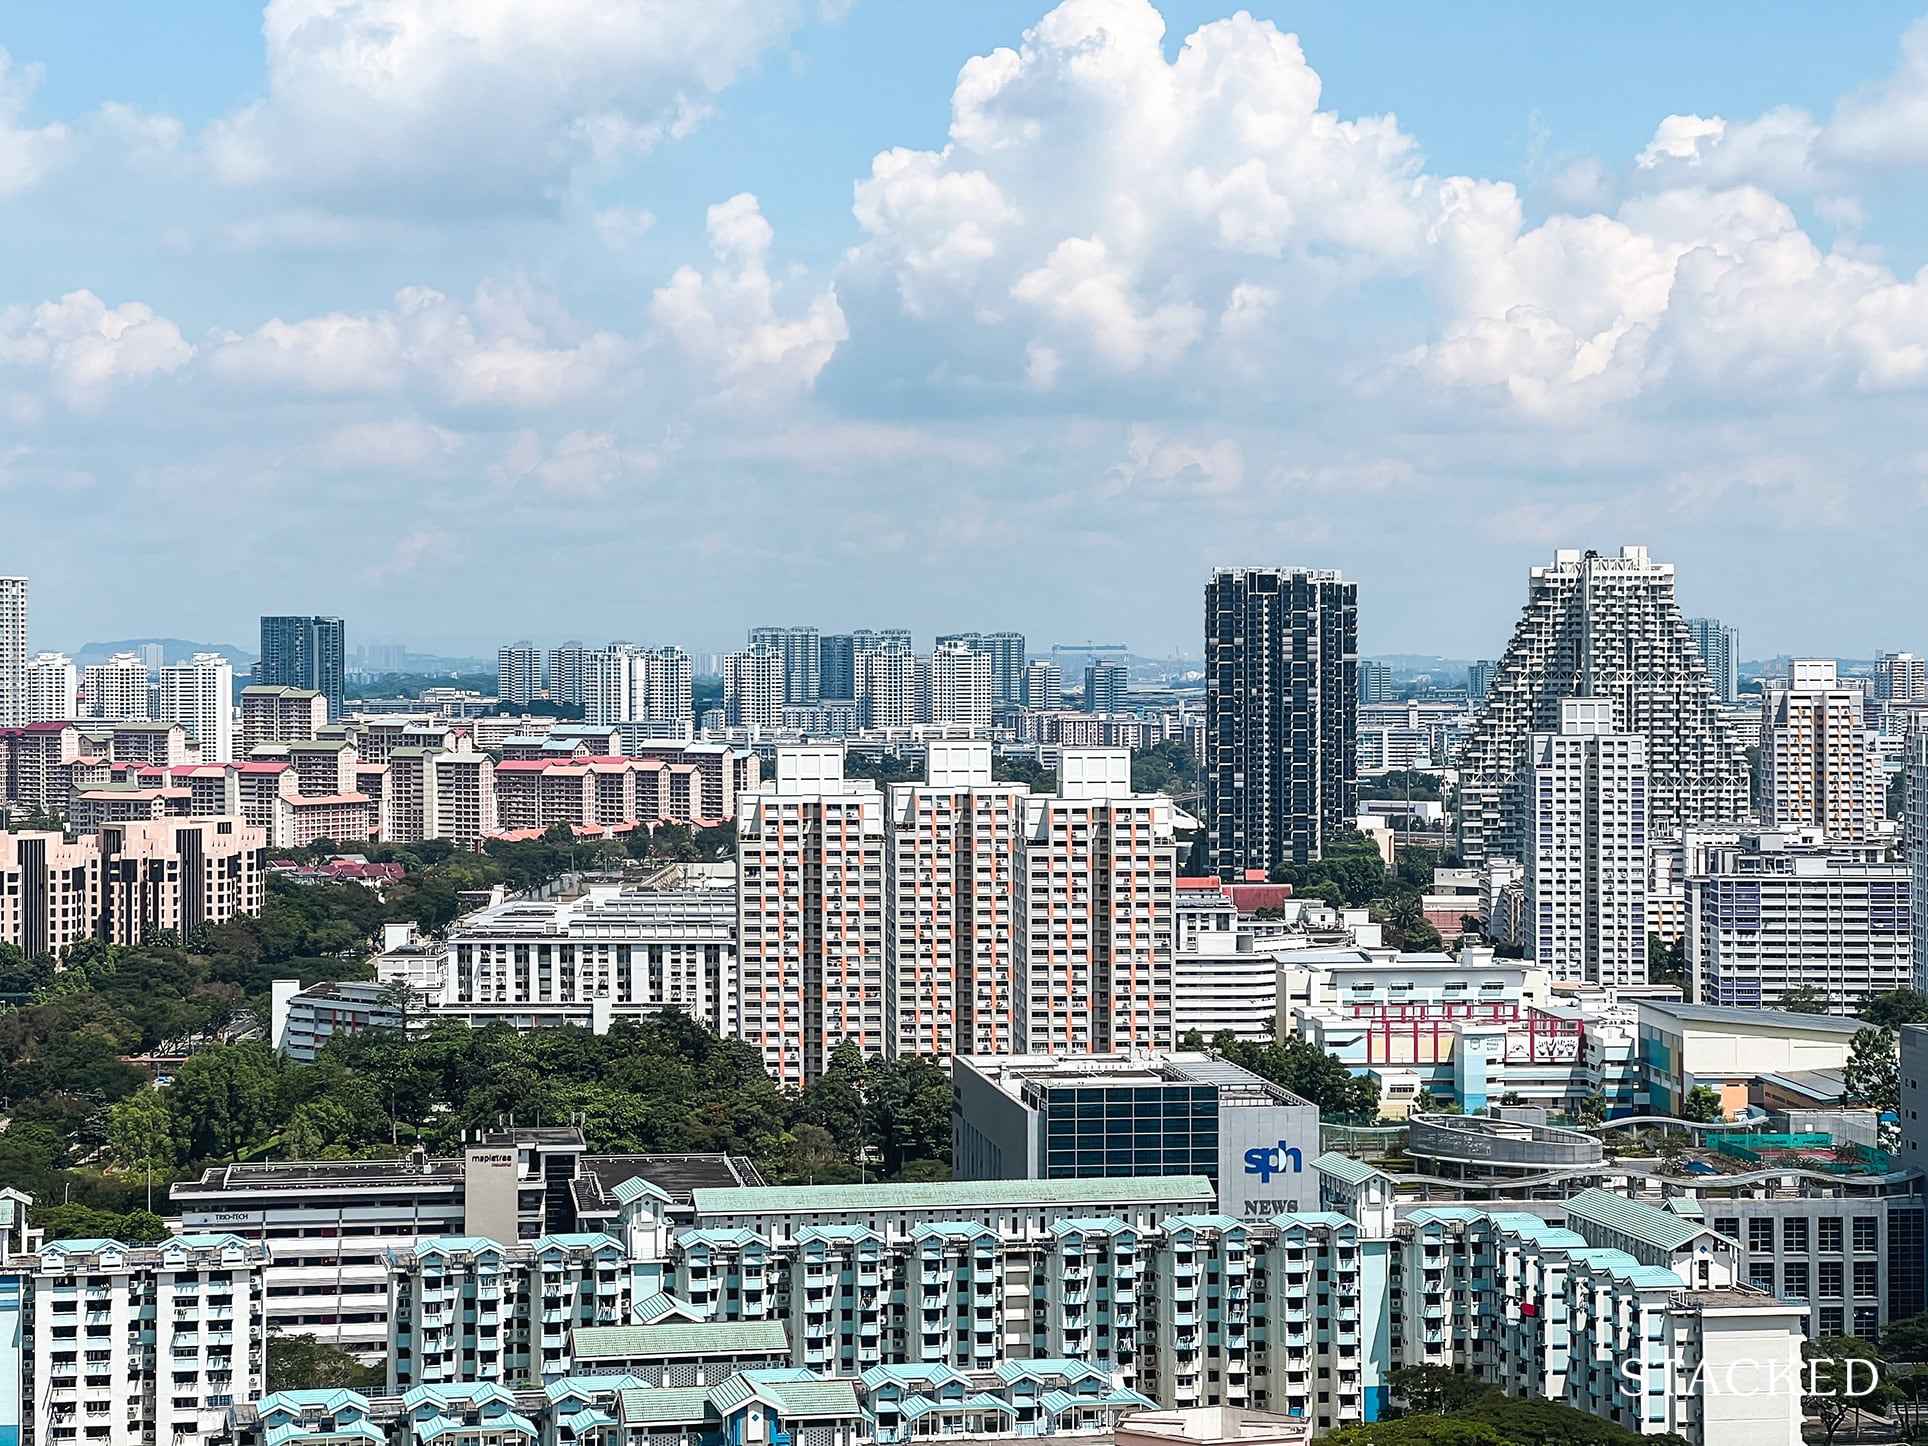
2021 has been an intense year. It’s the first full year of dealing with the pandemic, and it’s crazy to think how we’ve been living with Covid-19 for nearly two years already. There’s great hope that 2022 will see some sense of normalcy return to our lives, as we continue to adjust to the new normal of living.
Lots have happened on the property front too. The year kicked off with the launch of Normanton Park, which has gone on to sell more than 3/4 of its 1,862 units over the course of 2021 – a quite stunning result. Most launches since have done well given the buoyancy of the market, with notable ones like Jervois Mansion selling 98 per cent on launch day, CanningHill Piers moving 77 per cent, and Pasir Ris 8 registering 85 per cent.
Resale HDB prices unsurprisingly was a hot topic throughout the year, as a result of BTO delays and the pandemic conditions driving up the demand. Paying for COV has made an unwelcome comeback in 2021, and the combinations of the seemingly insatiable demand from private, HDB, and landed buyers have led to the recent long-awaited cooling measures to quell the market.
Here’s a year-end look at where the overall market stands at the end of 2021:
* Do note that the numbers derived in this year-end review are from URA Realis as of 31 Dec 2021. The final numbers could change from the official figures when released at end of January 2022 – but it isn’t going to deviate significantly to alter any conclusions here.
Many readers write in because they're unsure what to do next, and don't know who to trust.
If this sounds familiar, we offer structured 1-to-1 consultations where we walk through your finances, goals, and market options objectively.
No obligation. Just clarity.
Learn more here.
Non-landed private properties
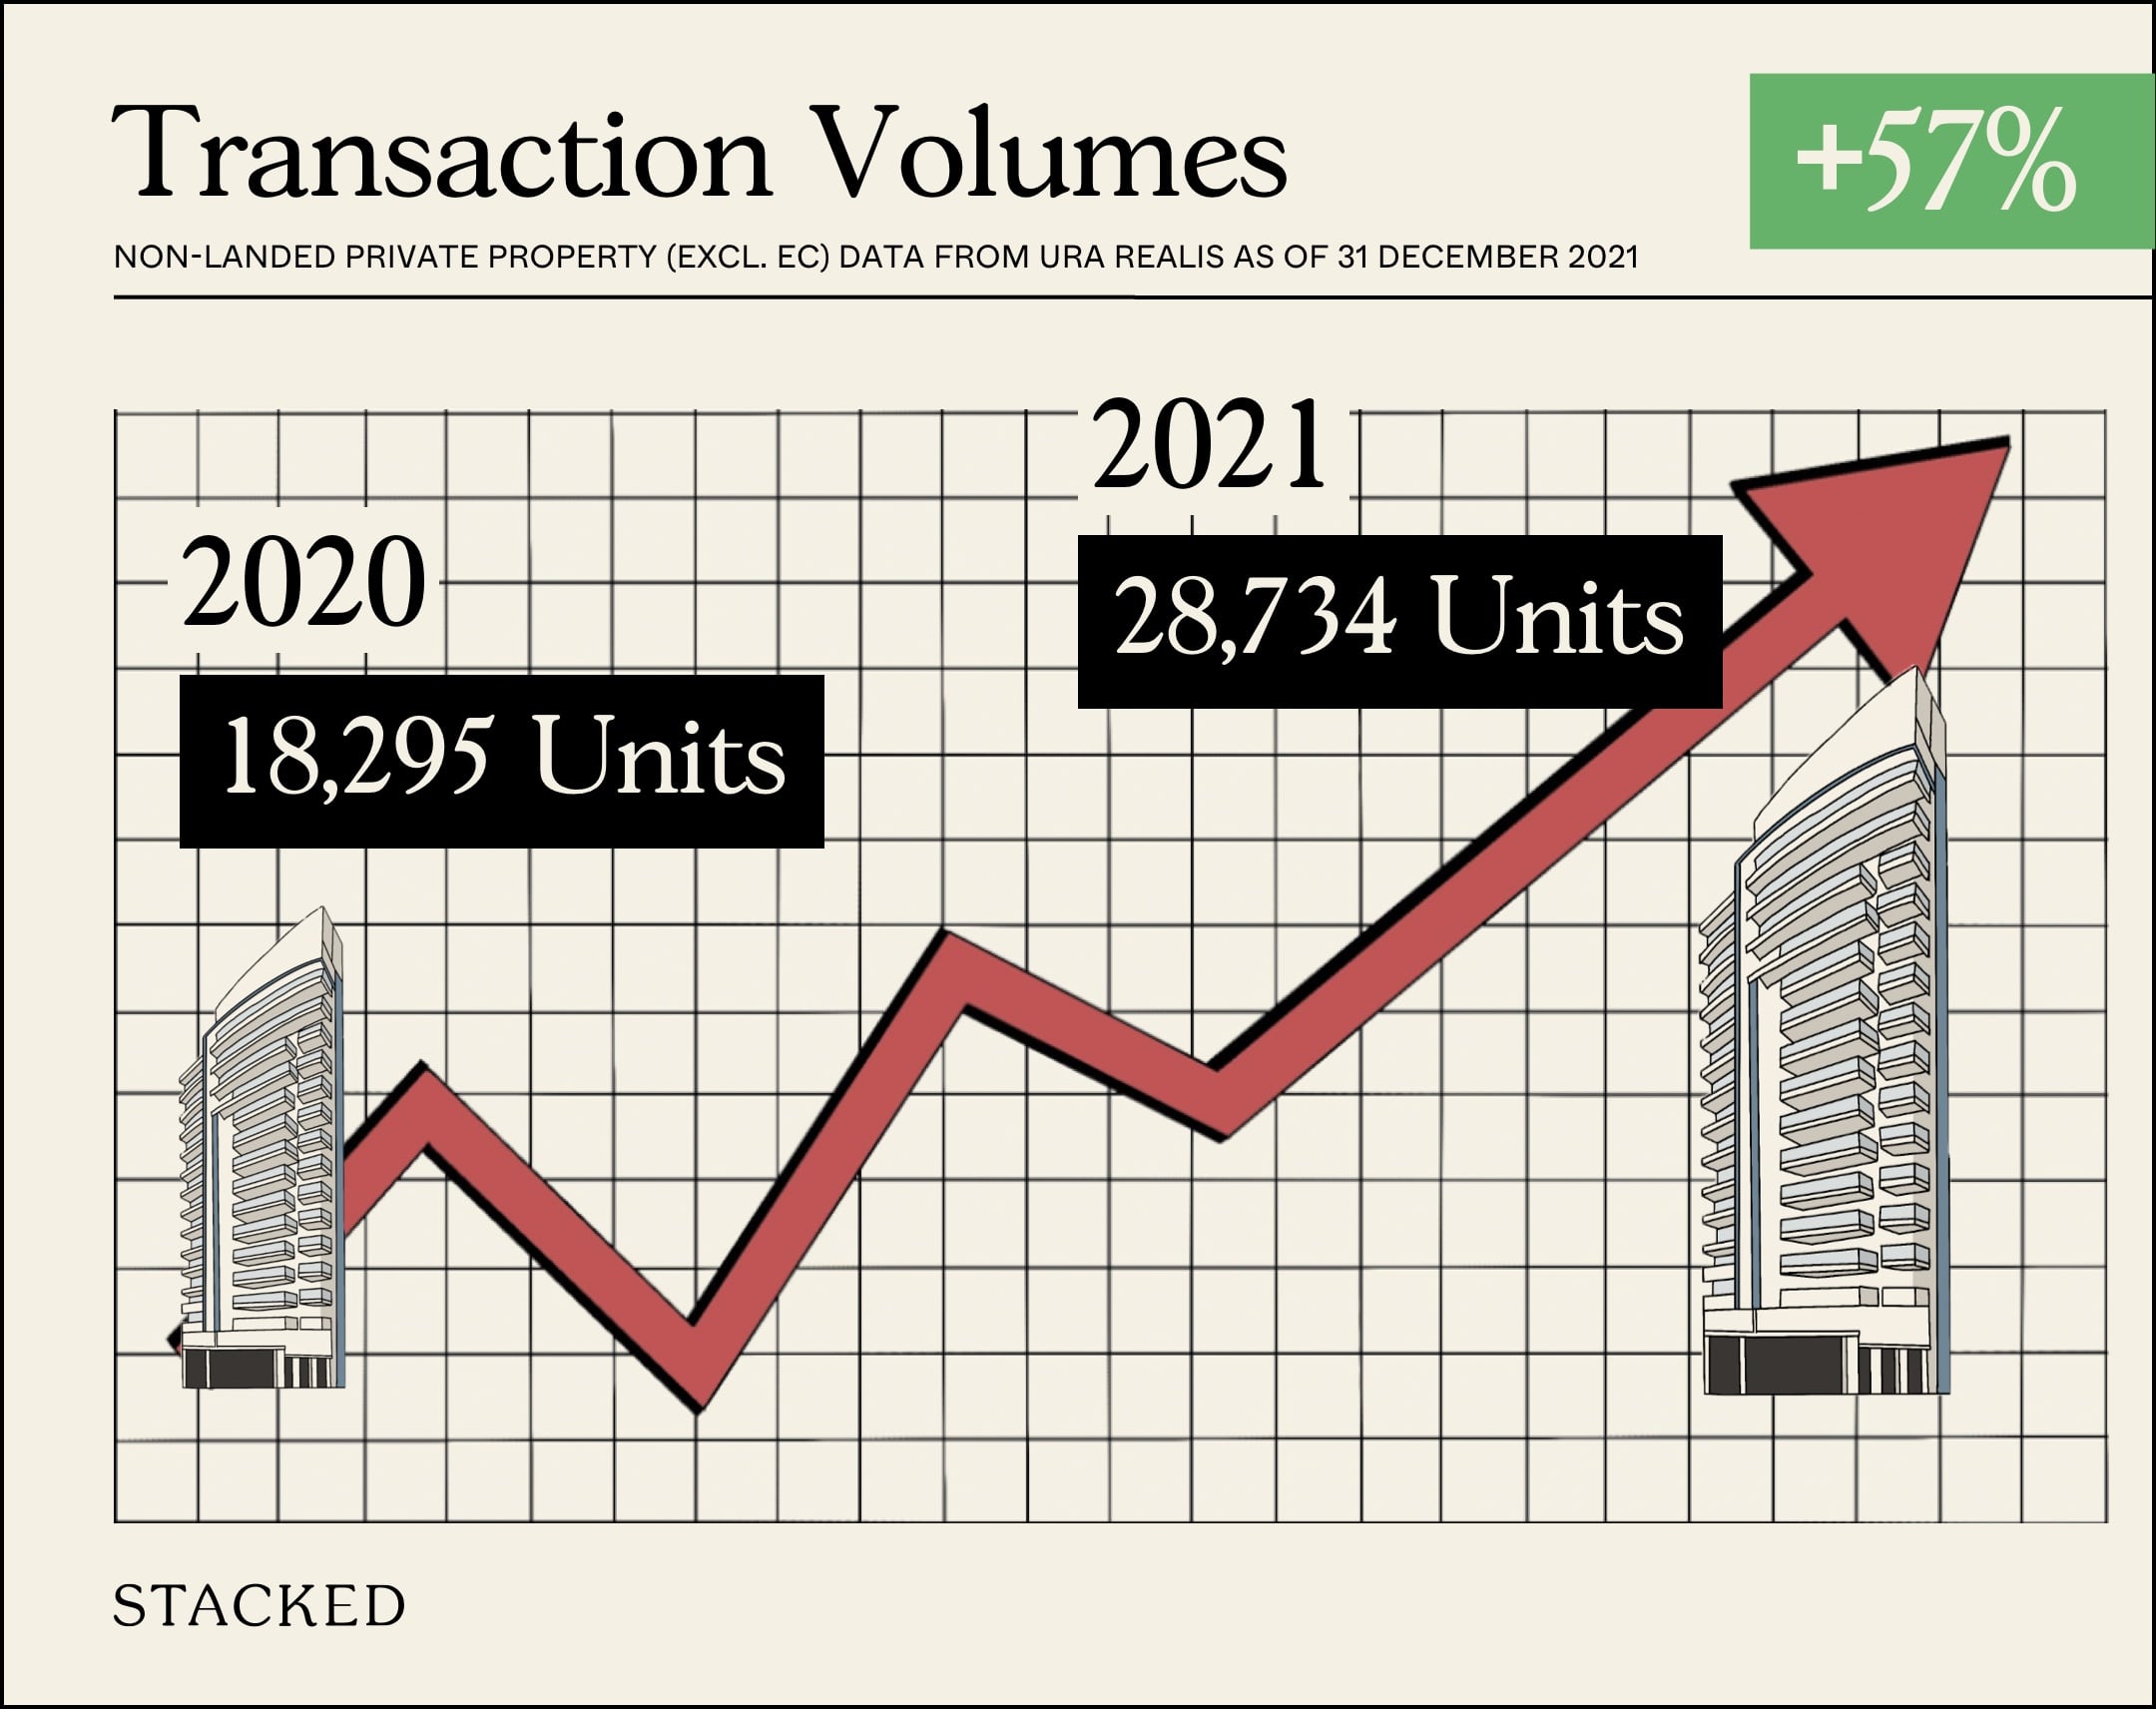
The total transaction volumes for private non-landed properties (excluding ECs) amounted to 28,734 for the whole of 2021 (based on information available as of to 31 December 2021). This is quite a large 57 per cent increase from 2020, when total transaction volume came to 18,295 units (probably hence the cooling measures).
Of the total transactions, 12,574 were new launch properties, while 15,677 were resale properties. Compared to 2020, this is a 34 per cent increase for new launch sales and a 79 per cent increase for resale units. It is quite a remarkable increase – and perhaps goes to show how resale demand has really been impacted by construction delays from the pandemic as well as the attraction of bigger living spaces at home.
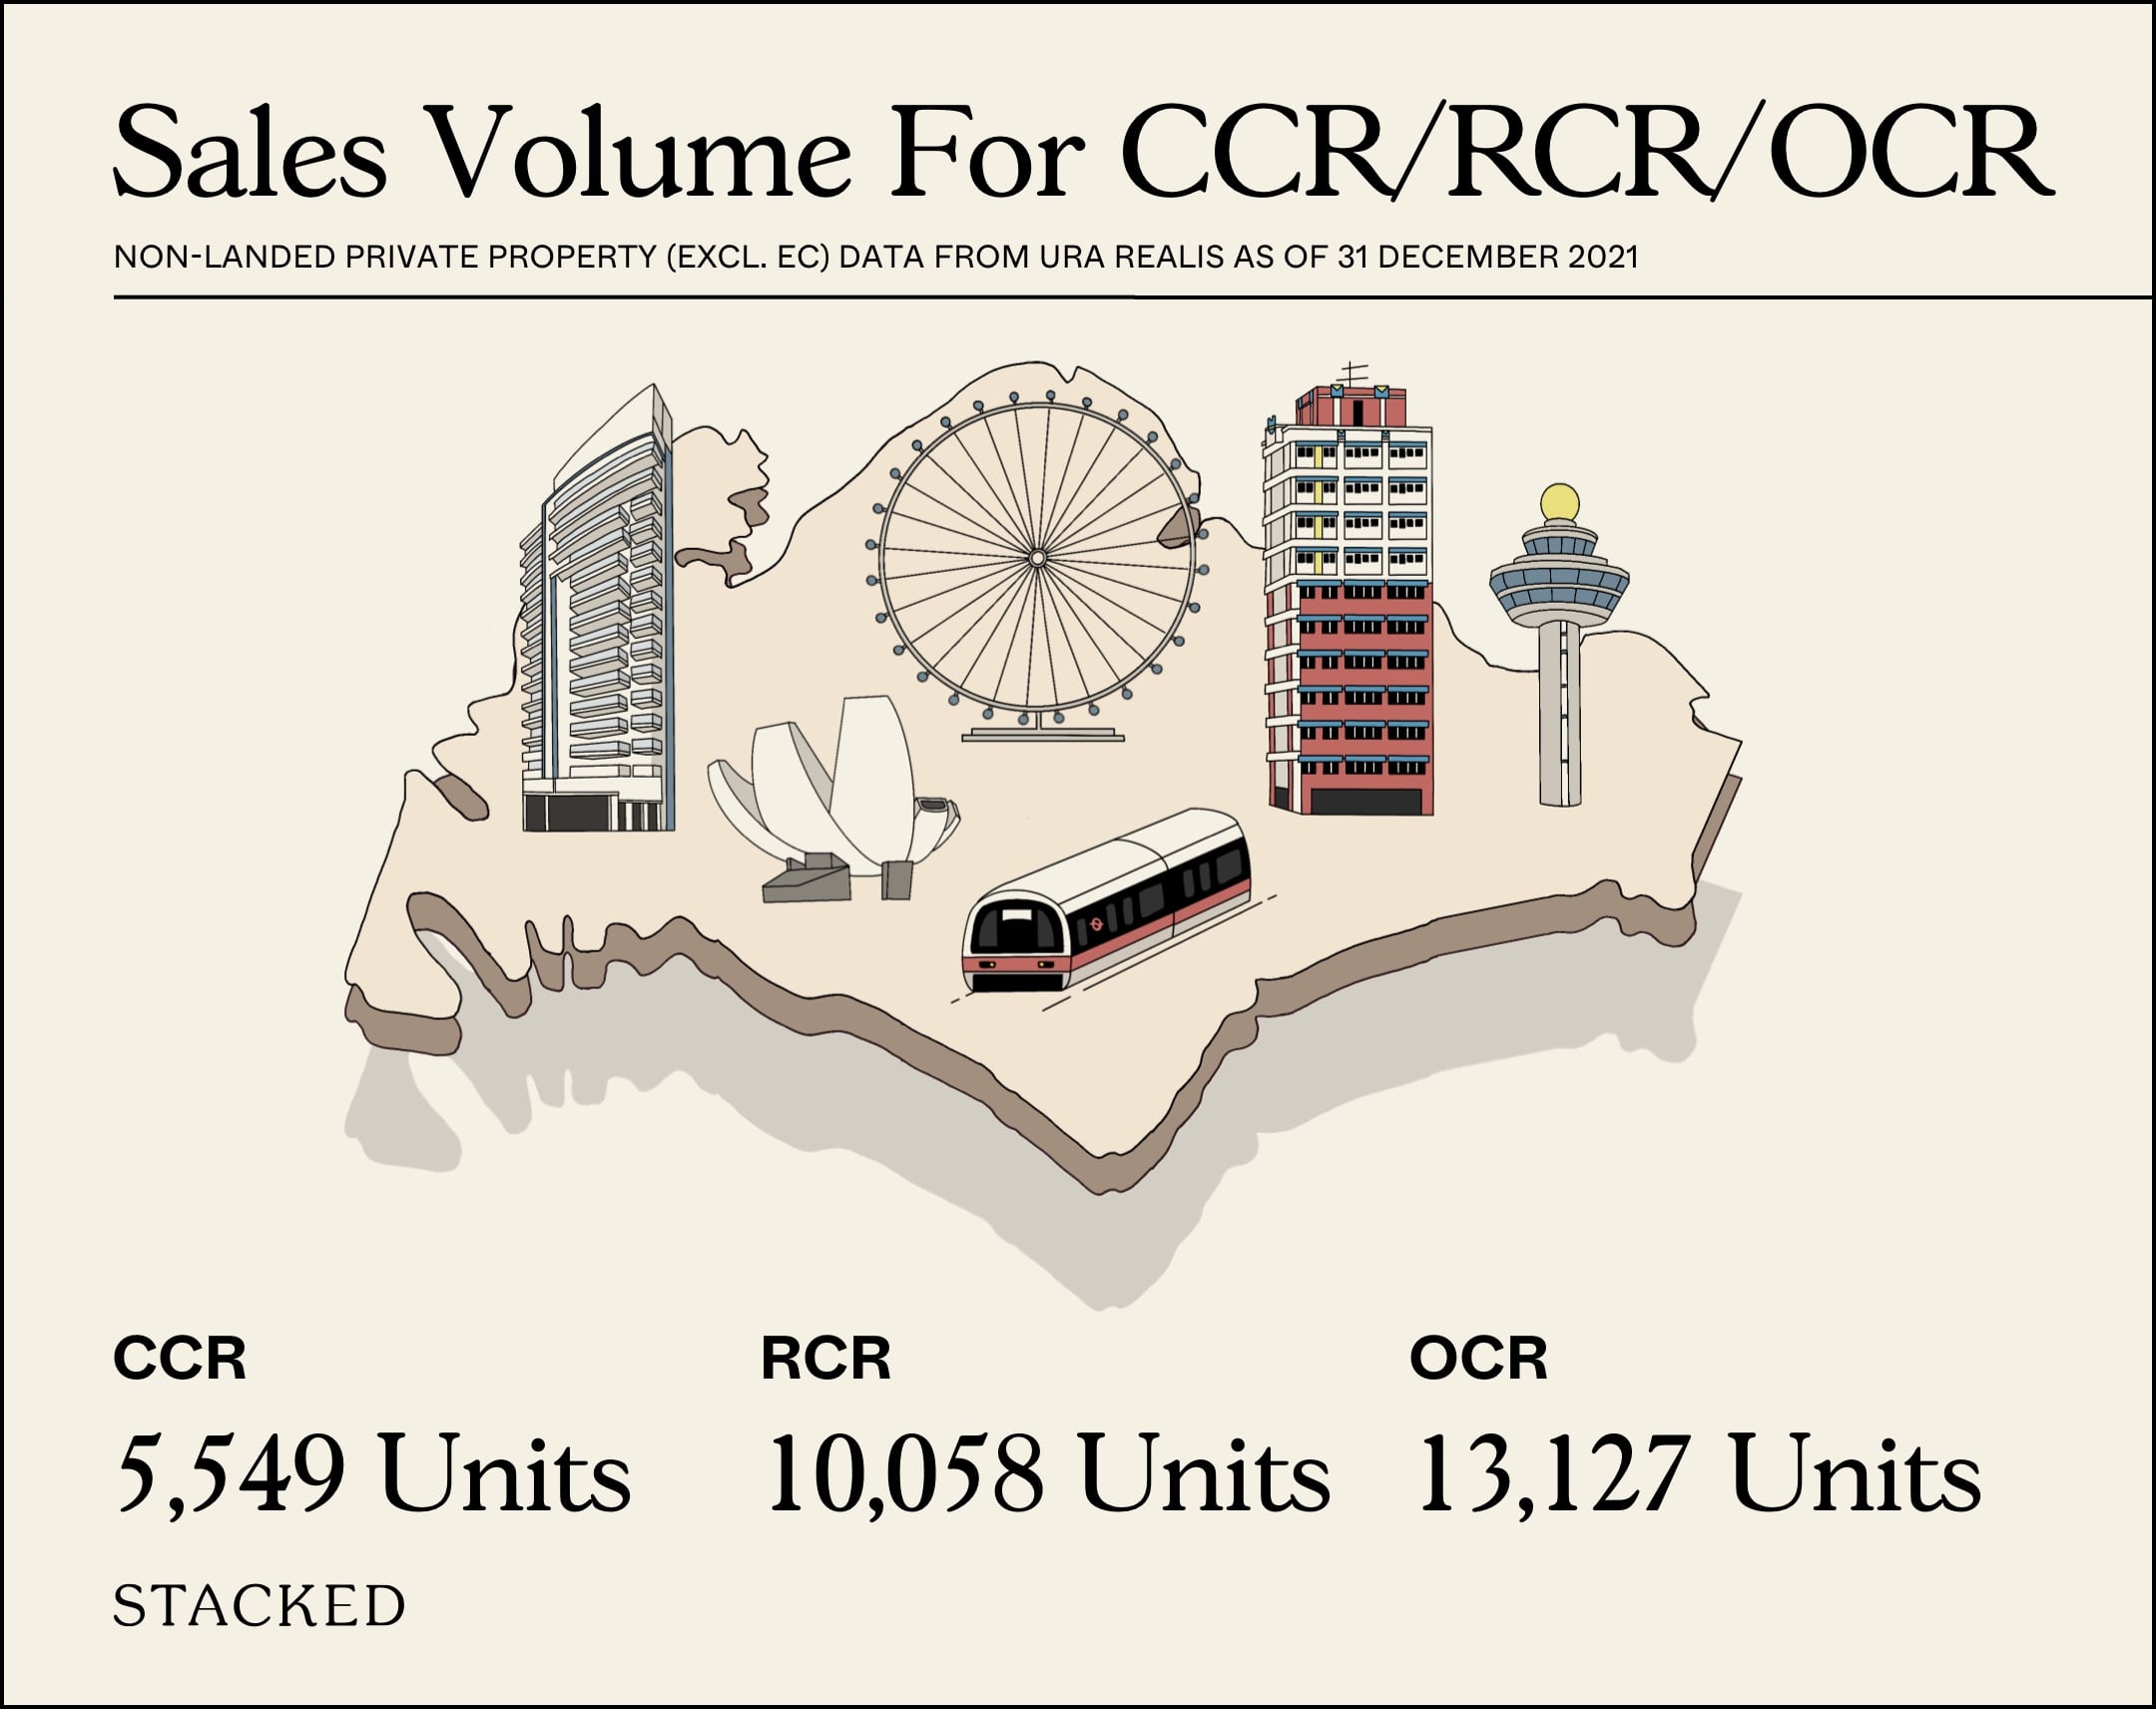
In the Core Central Region (CCR), sales volumes jumped about 84.5 per cent over the year, from 3,008 to 5,549 units.
In the Rest of Central Region (RCR), sales volumes rose around 54 per cent, from 6,531 to 10,058 units.
In the Outside of Central Region (OCR), sales volumes rose around 49.9 per cent, from 8,756 to 13,127 units.
Price movement for non-landed private properties (Excluding ECs)
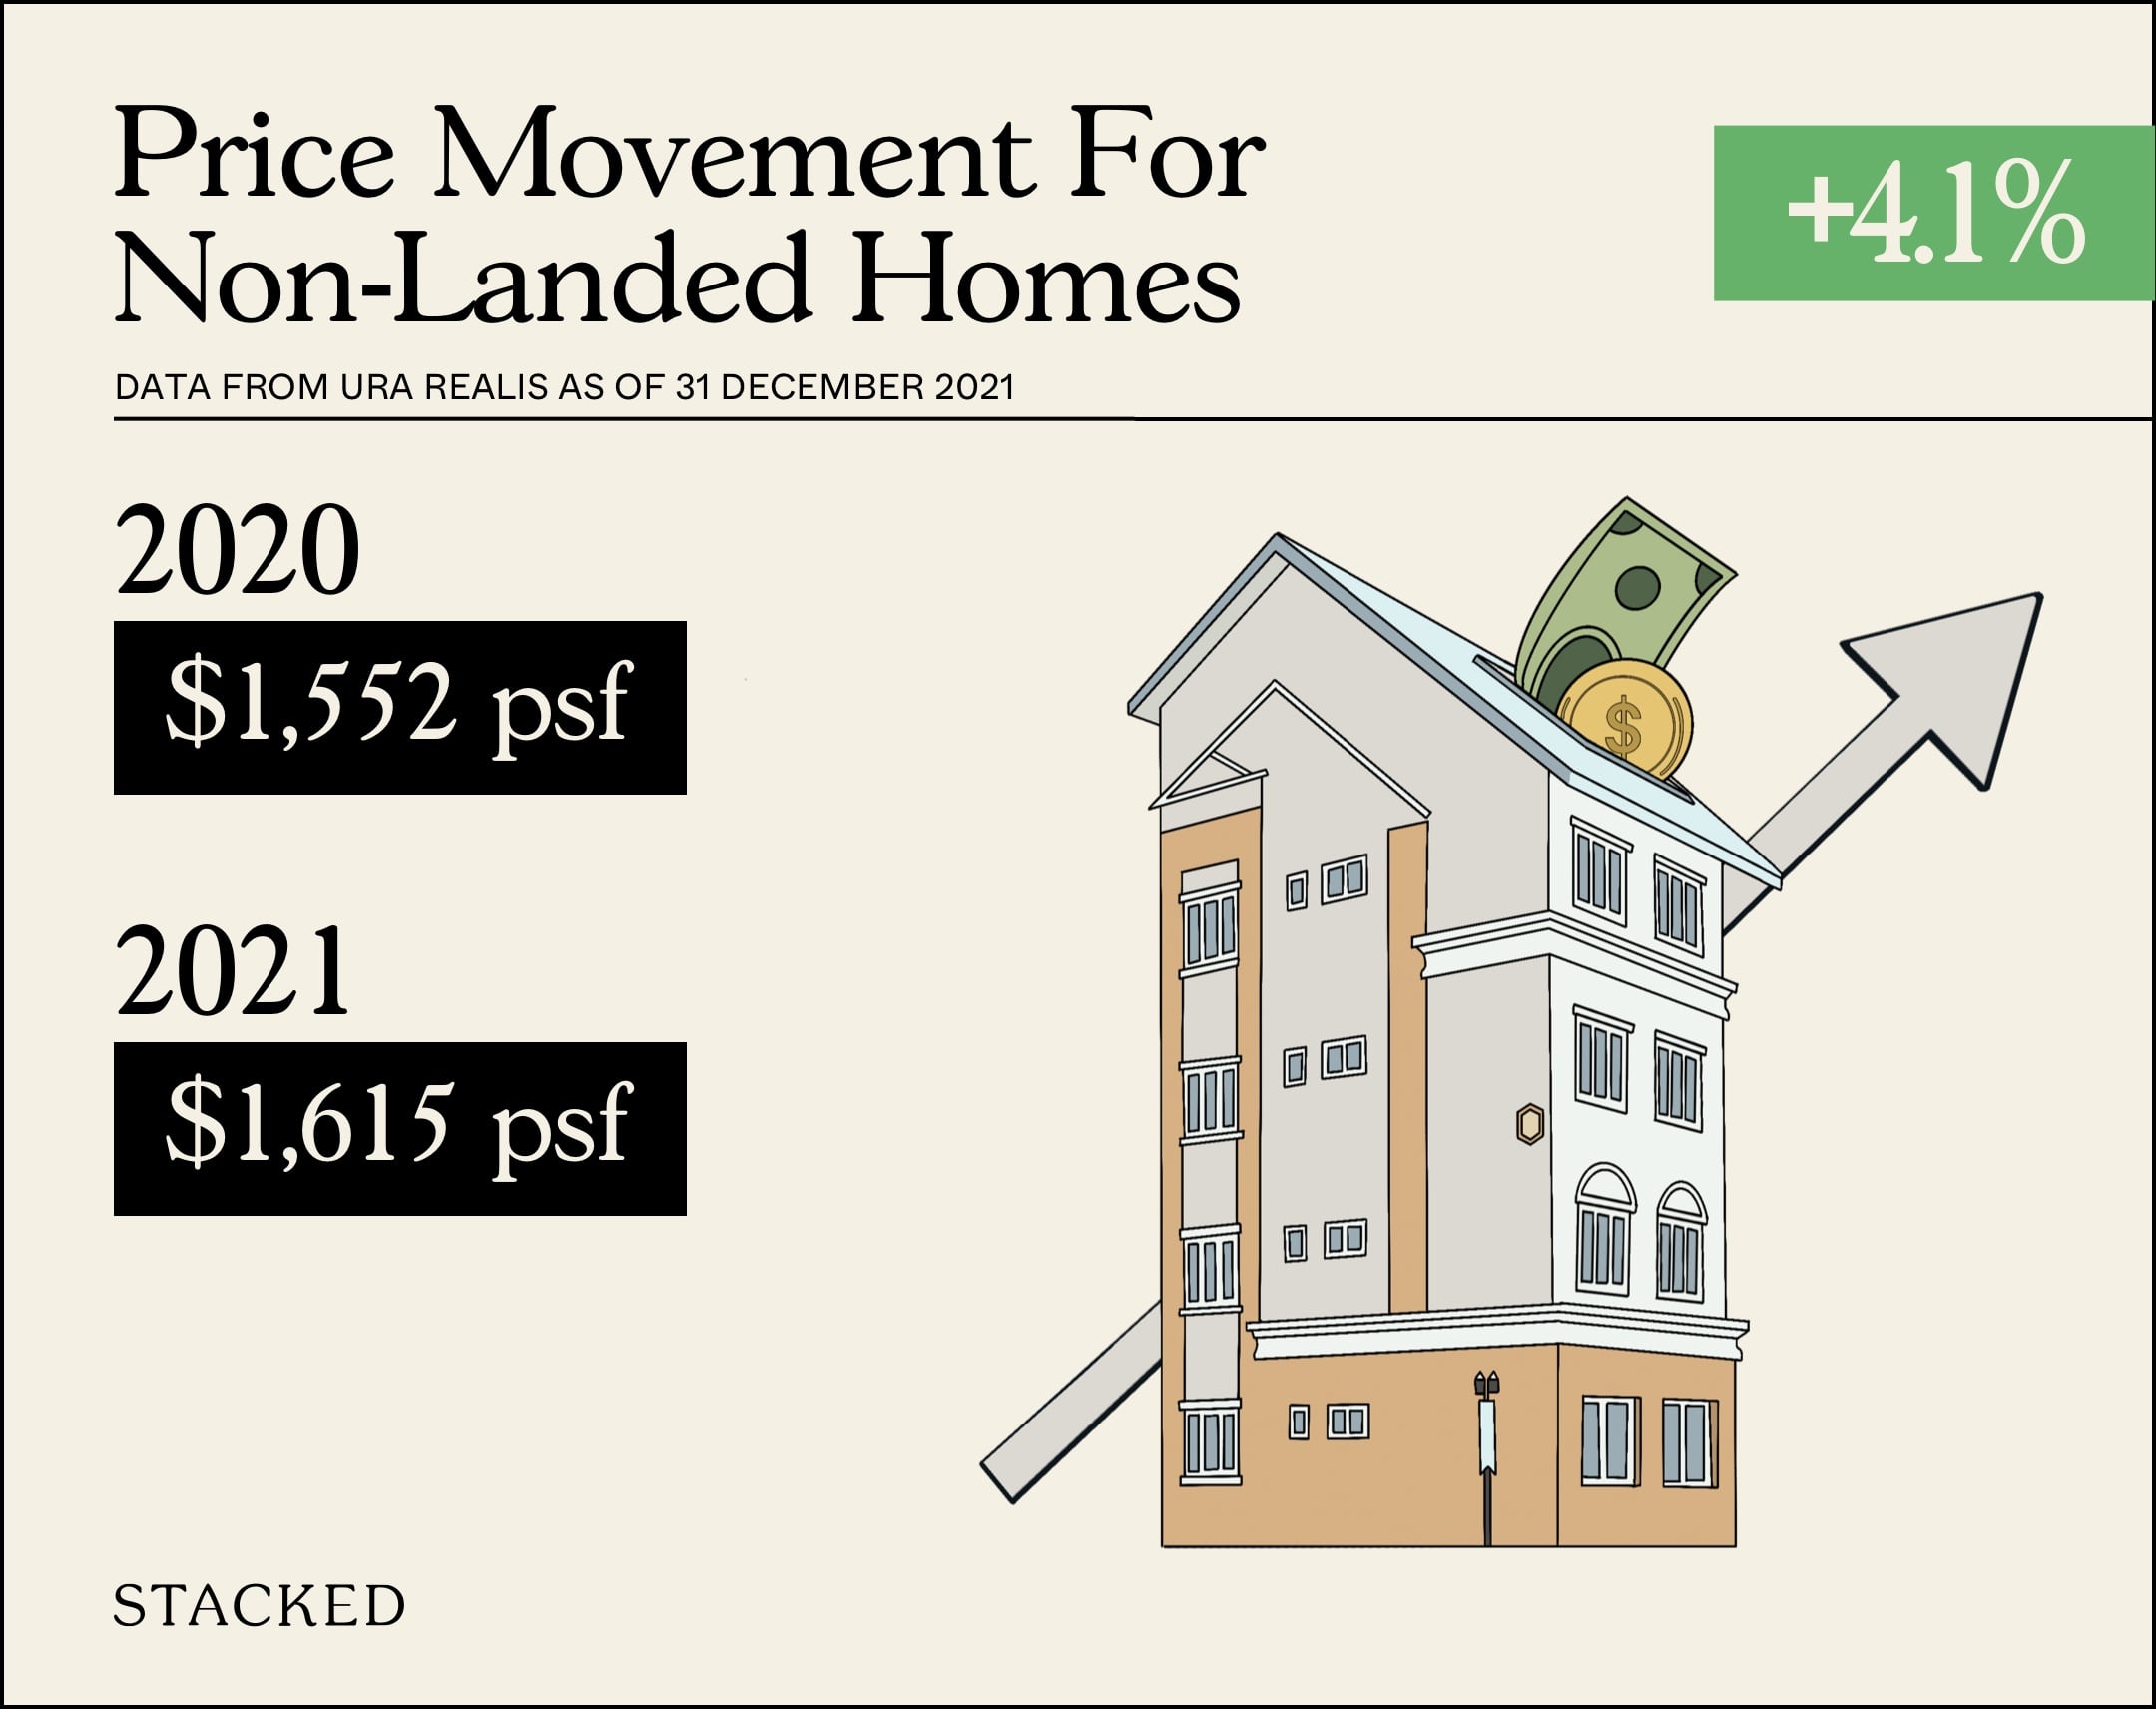
| Region | Sales volume (2020) | Price psf (2020) | Sales volume (2021) | Price psf (2021) | Approx. gain / loss |
| Singapore | 18,295 | $1,552 | 28,734 | $1,615 | +4.06% |
| CCR | 3,008 | $2,209 | 5,549 | $2,372 | +7.38% |
| RCR | 6,531 | $1,699 | 10,058 | $1,775 | +4.47% |
| OCR | 8,756 | $1,327 | 13,127 | $1,330 | +0.23% |
All new launch developments throughout 2021
The following is based on URA November Developer Sales data added with transactions from December 2021. For the most current details on pricing, take-up rates, etc. do drop us a query.
| New Launches In 2021 (Non-Landed Excluding ECs) | Total Number of Units in Project | Cumulative Units Sold to-date | Lowest $PSF in 2021 | Highest $PSF in 2021 | Median $PSF in 2021 | Take-Up Rate |
| AMBER SEA | 132 | 0 | – | – | – | 0.00% |
| CAIRNHILL 16 | 39 | 0 | – | – | – | 0.00% |
| JERVOIS PRIVE | 43 | 1 | – | – | – | 0.02% |
| SUNSTONE HILL | 28 | 0 | – | – | – | 0.00% |
| GEMS VILLE | 24 | 0 | – | – | – | 0.00% |
| IKIGAI | 16 | 0 | – | – | – | 0.00% |
| LIV @ MB | 298 | 0 | – | – | – | 0.00% |
| MATTAR RESIDENCES | 26 | 0 | – | – | – | 0.00% |
| RESIDENTIAL APARTMENTS | 75 | 0 | – | – | – | 0.00% |
| ROYAL HALLMARK | 32 | 0 | – | – | – | 0.00% |
| SOPHIA REGENCY | 38 | 0 | – | – | – | 0.00% |
| ZYANYA | 34 | 0 | – | – | – | 0.00% |
| BELGRAVIA ACE | 107 | 0 | – | – | – | 0.00% |
| KLIMT CAIRNHILL | 138 | 3 | $3,818 | $5,309 | $4,010 | 2.17% |
| 19 NASSIM | 101 | 4 | $3,510 | $3,751 | $3,631 | 3.96% |
| PERFECT TEN | 230 | 10 | $3,118 | $3,504 | $3,241 | 4.35% |
| CUSCADEN RESERVE | 192 | 9 | $3,807 | $3,826 | $3,816 | 4.69% |
| JERVOIS TREASURES | 36 | 2 | $2,271 | $2,271 | $2,271 | 5.56% |
| THE ATELIER | 120 | 9 | $2,530 | $3,040 | $2,706 | 7.50% |
| 10 EVELYN | 56 | 6 | $2,429 | $2,429 | $2,349 | 10.71% |
| PEAK RESIDENCE | 90 | 10 | $2,344 | $2,846 | $2,515 | 11.11% |
| ONE DRAYCOTT | 64 | 8 | $3,090 | $3,365 | $3,108 | 12.50% |
| GRANGE 1866 | 60 | 8 | $2,674 | $2,794 | $2,729 | 13.33% |
| RYMDEN 77 | 31 | 5 | $1,538 | $1,787 | $1,745 | 16.13% |
| PARKSUITES | 119 | 24 | $2,091 | $2,091 | $2,091 | 20.17% |
| THE GAZANIA | 250 | 54 | $1,879 | $2,346 | $2,074 | 21.60% |
| PETIT JERVOIS | 55 | 12 | $2,732 | $2,944 | $2,863 | 21.82% |
| DALVEY HAUS | 17 | 4 | $2,960 | $3,201 | $3,080 | 23.53% |
| THE LILIUM | 80 | 20 | $1,800 | $2,270 | $2,063 | 25.00% |
| BARTLEY VUE | 115 | 29 | $1,741 | $2,021 | $1,922 | 25.22% |
| ONE BERNAM | 351 | 89 | $2,223 | $2,955 | $2,475 | 25.36% |
| HAUS ON HANDY | 188 | 49 | $2,610 | $2,710 | $2,661 | 26.06% |
| PARKWOOD RESIDENCES | 18 | 5 | $1,290 | $1,533 | $1,503 | 27.78% |
| LES MAISONS NASSIM | 14 | 4 | $5,672 | $6,210 | $5,930 | 28.57% |
| VAN HOLLAND | 69 | 22 | $2,570 | $3,090 | $2,931 | 31.88% |
| JUNIPER HILL | 115 | 37 | $2,391 | $2,926 | $2,718 | 32.17% |
| PHOENIX RESIDENCES | 74 | 24 | $1,454 | $1,548 | $1,494 | 32.43% |
| PULLMAN RESIDENCES NEWTON | 340 | 111 | $2,512 | $3,491 | $2,828 | 32.65% |
| MIDTOWN BAY | 219 | 74 | $2,619 | $3,261 | $2,997 | 33.79% |
| SLOANE RESIDENCES | 52 | 18 | $2,718 | $3,366 | $2,889 | 34.62% |
| HYLL ON HOLLAND | 319 | 111 | $2,242 | $2,699 | $2,406 | 34.80% |
| THE LANDMARK | 396 | 144 | $1,946 | $2,498 | $2,203 | 36.36% |
| M SUITES | 16 | 6 | $1,603 | $1,700 | $1,650 | 37.50% |
| MYRA | 85 | 32 | $2,064 | $2,299 | $2,144 | 37.65% |
| MOOI RESIDENCES | 24 | 10 | $2,339 | $2,547 | $2,369 | 41.67% |
| THE HYDE | 117 | 50 | $2,723 | $3,325 | $2,868 | 42.74% |
| RIVIERE | 455 | 197 | $2,307 | $3,060 | $2,644 | 43.30% |
| MEYER MANSION | 200 | 87 | $2,403 | $3,293 | $2,613 | 43.50% |
| WILSHIRE RESIDENCES | 85 | 40 | $2,175 | $2,717 | $2,451 | 47.06% |
| LA MARIPOSA | 17 | 8 | $1,699 | $1,774 | $1,726 | 47.06% |
| LEEDON GREEN | 638 | 313 | $2,318 | $3,017 | $2,677 | 49.06% |
| VERTICUS | 162 | 80 | $1,856 | $2,333 | $2,067 | 49.38% |
| BOTANIC @ CLUNY PARK | 6 | 3 | No Data | No Data | No Data | 50.00% |
| MORI | 137 | 70 | $1,619 | $2,106 | $1,864 | 51.09% |
| ONE HOLLAND VILLAGE RESIDENCES | 296 | 154 | $2,317 | $3,069 | $2,760 | 52.03% |
| THE AVENIR | 376 | 199 | $2,734 | $3,443 | $3,150 | 52.93% |
| 35 GILSTEAD | 70 | 39 | $2,450 | $2,682 | $2,545 | 55.71% |
| THE IVERIA | 51 | 29 | $2,507 | $2,751 | $2,617 | 56.86% |
| URBAN TREASURES | 237 | 135 | $1,816 | $2,109 | $1,878 | 56.96% |
| MEYERHOUSE | 56 | 32 | $2,379 | $2,800 | $2,541 | 57.14% |
| 15 HOLLAND HILL | 57 | 33 | $2,814 | $3,496 | $3,002 | 57.89% |
| PARKWOOD COLLECTION | 53 | 31 | $659 | $826 | $778 | 58.49% |
| PARK NOVA | 54 | 33 | $4,540 | $5,838 | $4,843 | 61.11% |
| KOPAR AT NEWTON | 378 | 231 | $2,118 | $2,651 | $2,380 | 61.11% |
| ROYALGREEN | 285 | 178 | $2,511 | $2,900 | $2,740 | 62.46% |
| 77 @ EAST COAST | 41 | 26 | $1,638 | $1,892 | $1,747 | 63.41% |
| ONE PEARL BANK | 774 | 523 | $2,057 | $2,816 | $2,484 | 67.57% |
| 1953 | 58 | 41 | $1,752 | $1,956 | $1,933 | 70.69% |
| VERDALE | 258 | 185 | $1,637 | $1,897 | $1,775 | 71.71% |
| MIDTOWN MODERN | 558 | 403 | $2,299 | $4,213 | $2,703 | 72.22% |
| THE WATERGARDENS AT CANBERRA | 448 | 328 | $1,232 | $1,579 | $1,469 | 73.21% |
| FYVE DERBYSHIRE | 71 | 53 | $2,247 | $2,441 | $2,350 | 74.65% |
| IRWELL HILL RESIDENCES | 540 | 408 | $2,460 | $4,123 | $2,651 | 75.56% |
| THE COMMODORE | 219 | 169 | $1,289 | $1,670 | $1,511 | 77.17% |
| JERVOIS MANSION | 130 | 102 | $2,171 | $2,916 | $2,552 | 78.46% |
| KI RESIDENCES AT BROOKVALE | 660 | 518 | $1,594 | $2,097 | $1,815 | 78.48% |
| ONE MEYER | 66 | 52 | $2,438 | $2,688 | $2,539 | 78.79% |
| NORMANTON PARK | 1862 | 1476 | $1,455 | $2,024 | $1,792 | 79.27% |
| DAIRY FARM RESIDENCES | 460 | 365 | $1,359 | $1,759 | $1,617 | 79.35% |
| MAYFAIR MODERN | 171 | 139 | $1,795 | $2,306 | $2,081 | 81.29% |
| FOURTH AVENUE RESIDENCES | 476 | 388 | $2,103 | $2,701 | $2,410 | 81.51% |
| FORETT AT BUKIT TIMAH | 633 | 516 | $1,685 | $2,321 | $2,026 | 81.52% |
| BOULEVARD 88 | 154 | 126 | $3,575 | $4,022 | $3,738 | 81.82% |
| SERAYA RESIDENCES | 17 | 14 | $1,532 | $1,532 | $1,552 | 82.35% |
| INFINI AT EAST COAST | 36 | 30 | $1,626 | $2,134 | $1,892 | 83.33% |
| CANNINGHILL PIERS | 696 | 584 | $2,541 | $5,360 | $2,886 | 83.91% |
| 8 HULLET | 44 | 37 | $3,671 | $3,671 | $3,671 | 84.09% |
| AMBER PARK | 592 | 500 | $2,226 | $2,960 | $2,449 | 84.46% |
| AVENUE SOUTH RESIDENCE | 1074 | 910 | $1,801 | $2,556 | $2,227 | 84.73% |
| PARC KOMO | 276 | 236 | $1,459 | $1,799 | $1,557 | 85.51% |
| MIDWOOD | 564 | 486 | $1,552 | $1,925 | $1,671 | 86.17% |
| THE WOODLEIGH RESIDENCES | 667 | 580 | $1,958 | $2,468 | $2,150 | 86.96% |
| NYON | 92 | 80 | $1,915 | $2,721 | $2,337 | 86.96% |
| NEU AT NOVENA | 87 | 76 | $2,379 | $2,711 | $2,546 | 87.36% |
| PASIR RIS 8 | 487 | 429 | $1,411 | $2,092 | $1,627 | 88.09% |
| DUNEARN 386 | 35 | 31 | $2,101 | $2,608 | $2,285 | 88.57% |
| THE FLORENCE RESIDENCES | 1410 | 1253 | $1,355 | $1,947 | $1,682 | 88.87% |
| THE REEF AT KING’S DOCK | 429 | 382 | $1,995 | $2,831 | $2,277 | 89.04% |
| THE M | 522 | 467 | $2,295 | $3,035 | $2,694 | 89.46% |
| RESIDENCE TWENTY-TWO | 22 | 20 | $1,716 | $1,880 | $1,777 | 90.91% |
| MAYFAIR GARDENS | 215 | 196 | $1,754 | $2,212 | $2,021 | 91.16% |
| KENT RIDGE HILL RESIDENCES | 548 | 502 | $1,362 | $2,077 | $1,786 | 91.61% |
| PENROSE | 566 | 522 | $1,553 | $1,802 | $1,674 | 92.23% |
| TEDGE | 42 | 39 | $1,544 | $1,762 | $1,623 | 92.86% |
| SENGKANG GRAND RESIDENCES | 680 | 637 | $1,594 | $1,915 | $1,713 | 93.68% |
| LATTICE ONE | 48 | 45 | $1,626 | $1,946 | $1,846 | 93.75% |
| 3 CUSCADEN | 96 | 90 | $3,686 | $4,227 | $4,199 | 93.75% |
| SKY EVERTON | 262 | 246 | $2,634 | $2,895 | $2,778 | 93.89% |
| THE JOVELL | 428 | 406 | $1,121 | $1,581 | $1,332 | 94.86% |
| CLAVON | 640 | 608 | $1,489 | $1,822 | $1,633 | 95.00% |
| PARC CLEMATIS | 1468 | 1397 | $1,076 | $2,076 | $1,693 | 95.16% |
| UPTOWN @ FARRER | 116 | 111 | $1,619 | $2,144 | $1,896 | 95.69% |
| COASTLINE RESIDENCES | 144 | 138 | $2,253 | $3,119 | $2,454 | 95.83% |
| AFFINITY AT SERANGOON | 1052 | 1013 | $1,096 | $1,794 | $1,548 | 96.29% |
| MONT BOTANIK RESIDENCE | 108 | 104 | $1,552 | $1,899 | $1,739 | 96.30% |
| CASA AL MARE | 49 | 48 | $1,540 | $1,716 | $1,607 | 97.96% |
| ONE-NORTH EDEN | 165 | 162 | $1,779 | $2,257 | $1,986 | 98.18% |
| JADESCAPE | 1206 | 1190 | $1,552 | $1,966 | $1,779 | 98.67% |
| WATERCOVE | 80 | 79 | No Data | No Data | No Data | 98.75% |
| RIVERFRONT RESIDENCES | 1472 | 1454 | $1,094 | $1,527 | $1,362 | 98.78% |
| REZI 24 | 110 | 109 | $1,527 | $1,688 | $1,572 | 99.09% |
| TREASURE AT TAMPINES | 2203 | 2187 | $1,189 | $1,826 | $1,403 | 99.27% |
| PARK COLONIAL | 805 | 800 | $1,665 | $2,148 | $1,916 | 99.38% |
| THE ANTARES | 265 | 264 | $1,515 | $1,955 | $1,817 | 99.62% |
| STIRLING RESIDENCES | 1259 | 1257 | $1,619 | $2,511 | $2,148 | 99.84% |
| PARC ESTA | 1399 | 1399 | $1,616 | $2,050 | $1,743 | 100.00% |
| J@63 | 14 | 14 | $1,332 | $1,758 | $1,570 | 100.00% |
| NOMA | 50 | 50 | $1,478 | $1,668 | $1,628 | 100.00% |
| DAINTREE RESIDENCE | 327 | 327 | $1,517 | $1,903 | $1,718 | 100.00% |
| JUI RESIDENCES | 117 | 117 | $1,805 | $1,966 | $1,889 | 100.00% |
| MARTIN MODERN | 450 | 450 | $2,307 | $3,335 | $2,768 | 100.00% |
| OLLOI | 34 | 34 | $1,472 | $1,799 | $1,757 | 100.00% |
| THE ESSENCE | 84 | 84 | $1,078 | $1,488 | $1,390 | 100.00% |
| TWIN VEW | 520 | 520 | $1,357 | $1,582 | $1,508 | 100.00% |
| VIEW AT KISMIS | 186 | 186 | $1,609 | $1,815 | $1,724 | 100.00% |
| WHISTLER GRAND | 716 | 716 | $1,277 | $1,809 | $1,609 | 100.00% |
Top 5 selling developments in 2021
| Top 5 Selling Developments | No. of Units |
| Normanton Park | 1,473 |
| Parc Central Residences | 693 |
| CanningHill Piers | 582 |
| Treasure at Tampines | 564 |
| Parc Greenwich | 432 |
Best selling CCR new launch
| Project | No. of Units Sold 2021 | Median Price (2021 $PSF) | Median Price (2021) | Tenure |
| Irwell Hill Residences | 408 | $2,651 | $1,686,000 | 99-year |
| Midtown Modern | 403 | $2,703 | $1,704,780 | 99-year |
| Leedon Green | 225 | $2,677 | $1,998,000 | Freehold |
| Fourth Avenue Residences | 180 | $2,410 | $1,685,770 | 99-year |
| The Avenir | 145 | $3,150 | $4,437,000 | Freehold |
Best selling RCR new launch
| Project | No. of Units Sold 2021 | Median Price (2021 $PSF) | Median Price (2021) | Tenure |
| Normanton Park | 1473 | $1,792 | $1,223,473 | 99-year |
| CanningHill Piers | 582 | $2,886 | $1,613,000 | 99-year |
| The Reef At King’s Dock | 382 | $2,277 | $1,623,390 | 99-year |
| Avenue South Residence | 302 | $2,227 | $1,709,000 | 99-year |
| Amber Park | 264 | $2,449 | $1,825,800 | Freehold |
Best selling OCR new launch
| Project | No. of Units Sold 2021 | Median Price (2021 $PSF) | Median Price (2021) | Tenure |
| Parc Central Residences | 693 | $1,175 | $1,238,000 | 99-year |
| Treasure At Tampines | 564 | $1,403 | $1,490,500 | 99-year |
| Parc Greenwich | 432 | $1,233 | $1,305,000 | 99-year |
| Pasir Ris 8 | 429 | $1,627 | $1,266,000 | 99-year |
| Midwood | 402 | $1,671 | $1,163,000 | 99-year |
Top 5 non-landed private properties for resale gains in 2021
| Project Name | Sell Date | Price | Quantum Gains | % Gains | Holding Period (Years) |
| Lien Towers | 25/6/21 | $8,400,000 | $6,350,000 | 310% | 19.9 |
| Lakeside Apartments | 18/5/21 | $1,222,500 | $922,500 | 308% | 15.2 |
| N.A. | 6/9/21 | $2,370,000 | $1,780,000 | 302% | 22.3 |
| N.A. | 19/4/21 | $1,338,000 | $998,000 | 294% | 19.9 |
| Willyn Ville | 1/9/21 | $3,000,000 | $2,235,000 | 292% | 16 |
Bottom 5 private properties for resale gains in 2021
| Project Name | Sell Date | Price | Quantum Loss | % Loss | Holding Period (Years) |
| Bedok Shopping Complex | 19/10/21 | $340,000 | -$440,000 | -56% | 8.7 |
| The Azure | 29/3/21 | $3,600,000 | -$3,600,000 | -50% | 13.4 |
| Turquoise | 14/5/21 | $4,702,500 | -$4,429,575 | -49% | 13.5 |
| Orchard Scotts | 5/7/21 | $3,230,000 | -$2,241,200 | -41% | 10.3 |
| St Regis Residences | 5/1/21 | $8,000,000 | -$3,200,000 | -40% | 13 |
Rental market for private non-landed properties
Island-wide, leasing volumes fell by about 2.8 per cent, from 86,567 in 2020, to 84,125 in 2021.
In the CCR, leasing volume registered a slight increase of 2.75 per cent, from 25,041 to 25,730.
In the RCR, leasing volume fell around 4.77 per cent, from 29,093 to 27,706.
In the OCR, leasing volume fell around 5.38 per cent, from 32,433 to 30,689.
| Market Segment | 2020 | 2021 | Change |
| Core Central Region | 25,041 | 25,730 | +2.75% |
| Outside Central Region | 32,433 | 30,689 | -5.38% |
| Rest of Central Region | 29,093 | 27,706 | -4.77% |
| Total | 86,567 | 84,125 | -2.82% |
| Market Segment | 2020 | 2021 | Change |
| Core Central Region | $3.98 | $4.13 | +3.77% |
| Outside Central Region | $2.74 | $2.93 | +6.93% |
| Rest of Central Region | $3.43 | $3.57 | +4.08% |
| Total | $3.27 | $3.48 | +6.42% |
Rental rates are on an uptrend for all regions in Singapore, with the biggest change from the OCR with a 6.9 per cent increase in 2021.
Rental MarketCondo Rental Rates Are Likely To Increase Despite Hitting A 6-Year High: Here’s Why
by Ryan J. OngTop 5 developments for rental yield in 2021:
| Project | Tenure | Average Rent ($PSF PM) | Leasing Volume | Rental Yield (%) |
| The Hillford | 60 years from 2013 | 4.74 | 113 | 4.8 |
| Central Imperial | Freehold | 3.99 | 38 | 4.6 |
| Newest | 956 years from 1928 | 3.7 | 60 | 4.6 |
| Treasures @ G20 | Freehold | 3.79 | 19 | 4.5 |
| City Suites | Freehold | 4.38 | 39 | 4.4 |
| Pavilion Square | Freehold | 4.98 | 30 | 4.4 |
Bottom 5 developments for rental yield in 2021:
| Project | Tenure | Average Rent ($PSF PM) | Leasing Volume | Rental Yield (%) |
| Botanic Gardens View | Freehold | 2.59 | 35 | 1.3 |
| Ardmore Park | Freehold | 4.74 | 103 | 1.6 |
| Kim Sia Court | Freehold | 2.69 | 72 | 1.6 |
| The Lumos | Freehold | 3.03 | 25 | 1.6 |
| Four Seasons Park | Freehold | 4 | 53 | 1.6 |
HDB resale market
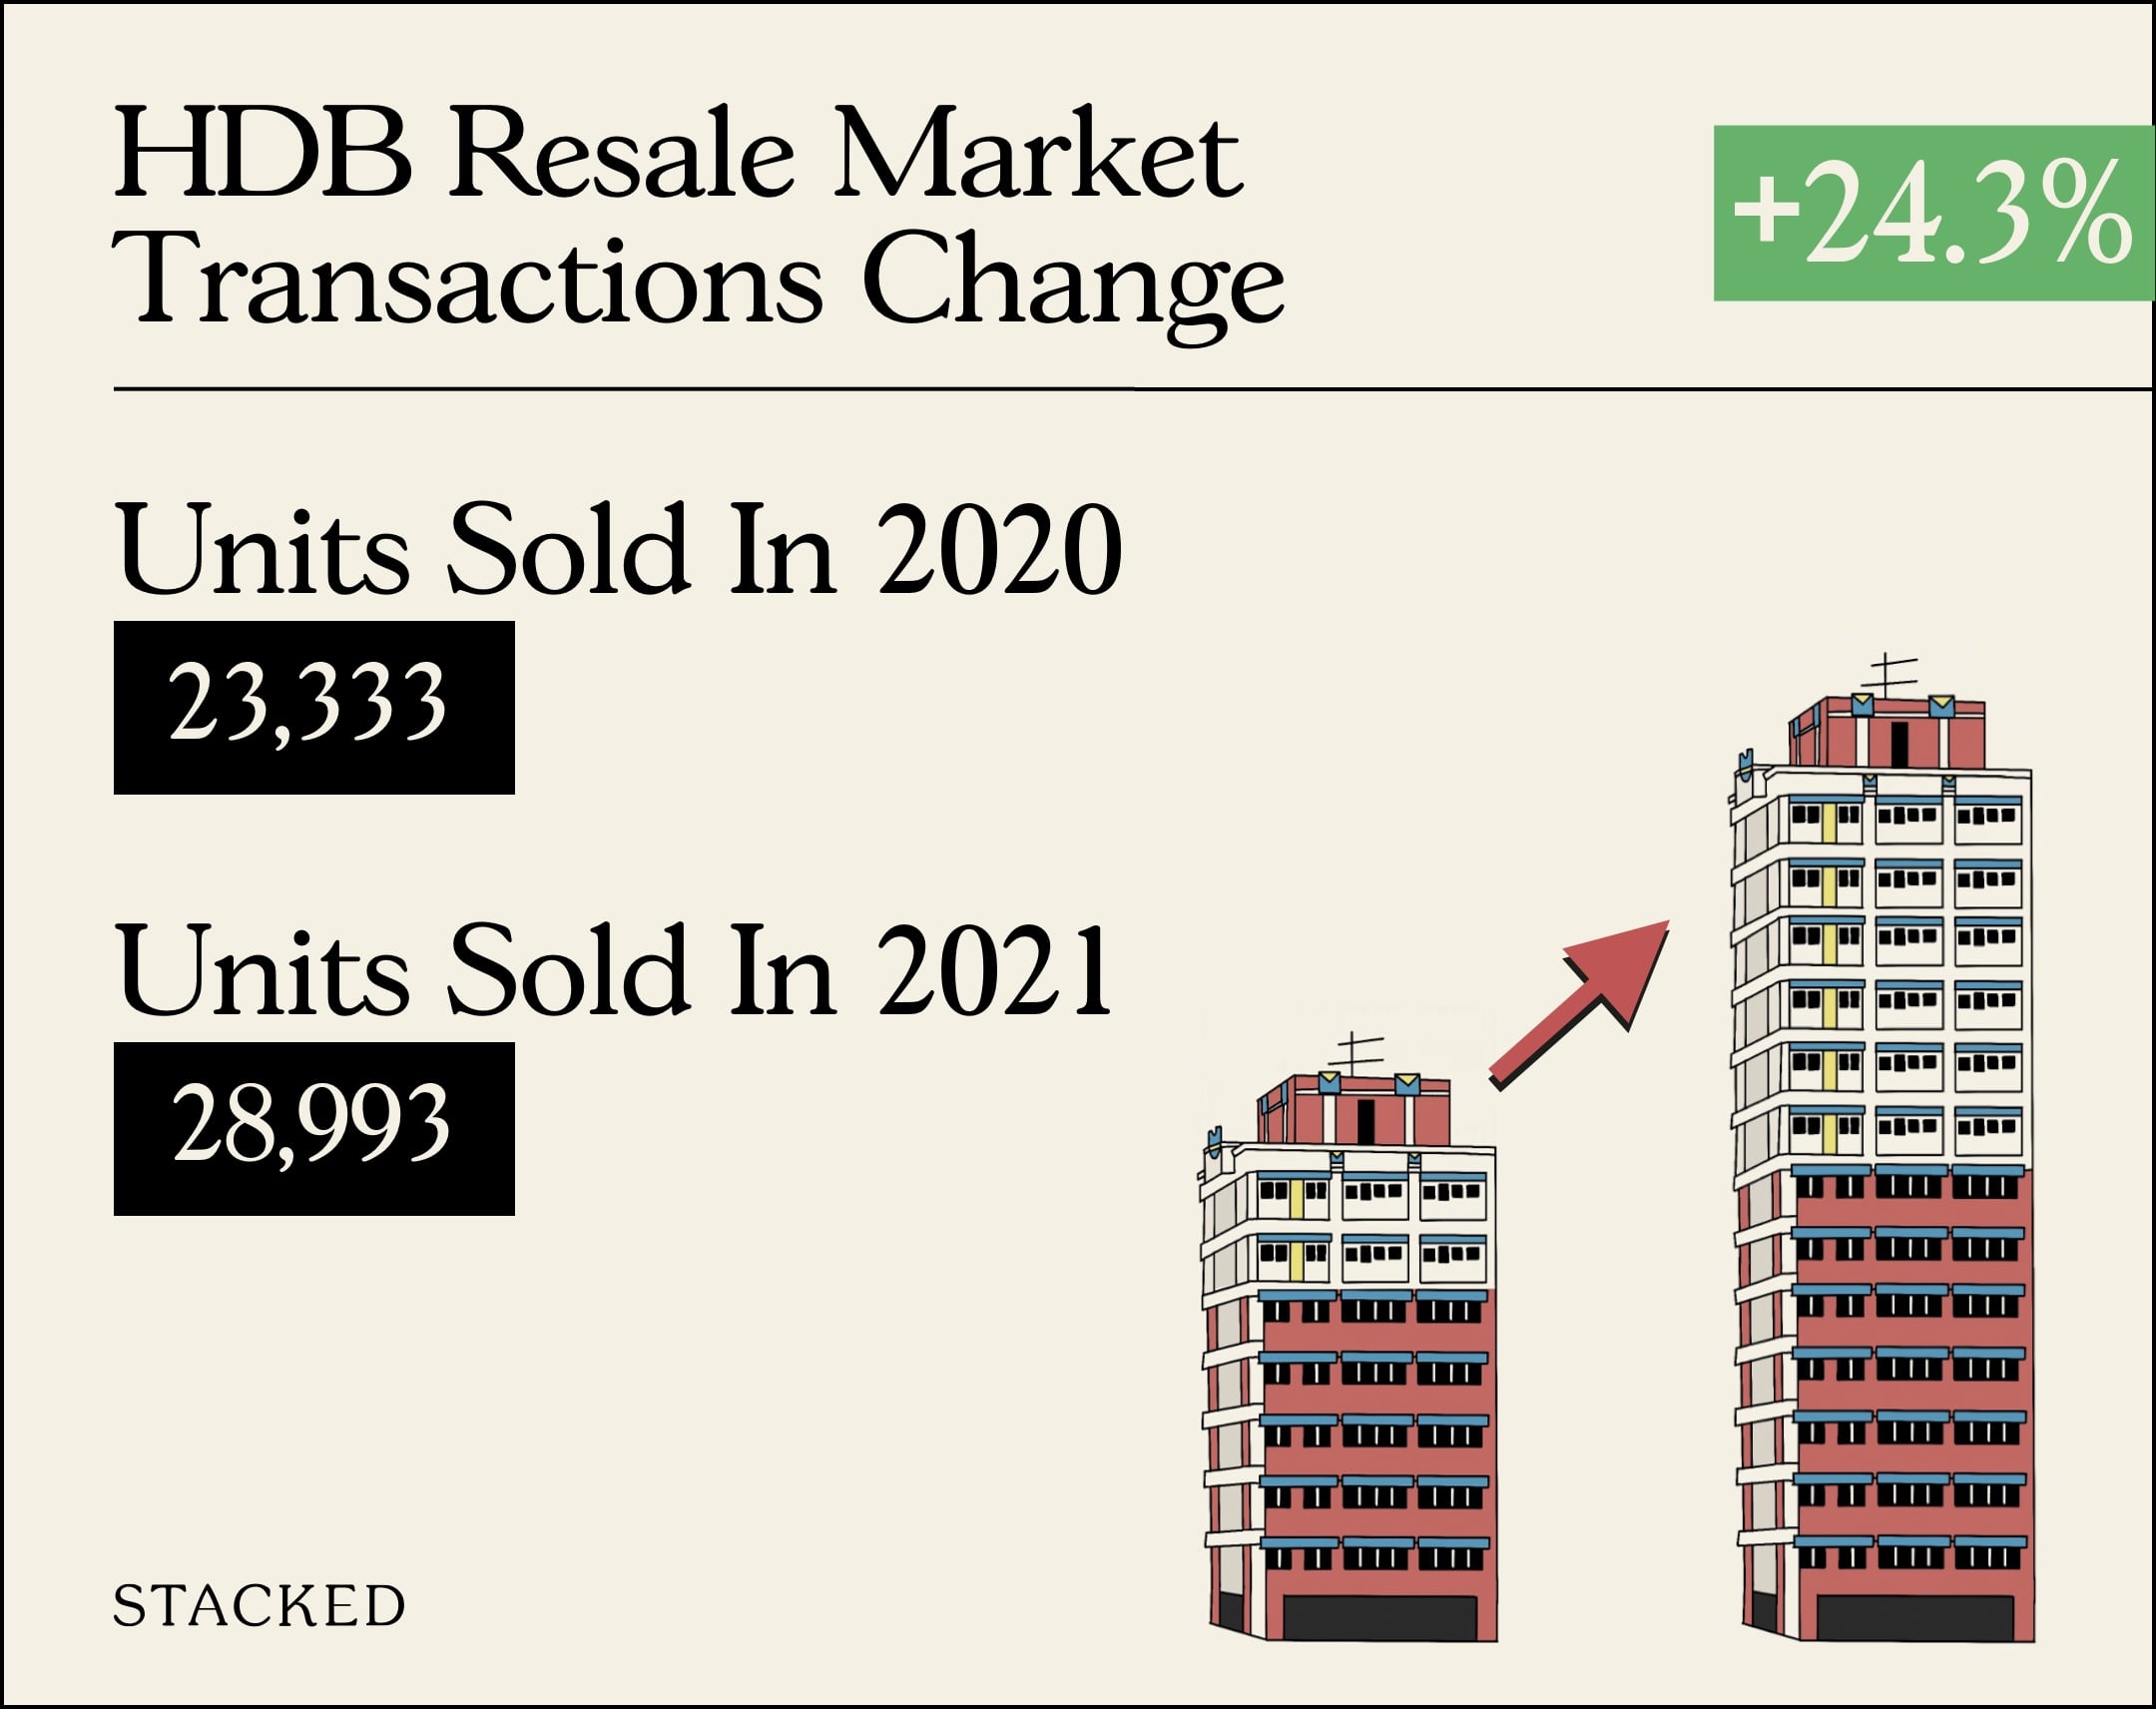
The total number of resale flat transactions rose by about 24.3 per cent in 2021. Total resale transactions numbered 28,993 units, up from 23,333 units last year. Do note that the numbers are likely higher as not all transactions in 2021 have been officially recorded.
The number of 2-room flat transactions decreased from 418 to 386 in 2021, down 7.66 per cent.
3-room flat transactions increased from 5,384 units to 6,250 units, a 16.1 per cent increase, while 4-room flat transactions rose from 9,647 units to 12,306 units; up around 27.6 per cent.
5-room flat transactions rose from 5,984 units to 7,774 units, up 29.9 per cent, while Executive flat transactions rose from 1,882 units to 2,250 units, up 19.6 per cent.
Lastly, there were 18 recorded transactions for 3Gen flats in 2021, a 125 per cent increase from 8 transactions the year before.
| Flat size | Transaction volume (2020) | Price psf (2020) | Transaction volume (2021) | Price psf (2021) | Approx. gain / loss |
| All flats | 23,333 | $434 | 28,993 | $488 | +12.4% |
| 1-room | 10 | $539 | 9 | $591 | +9.6% |
| 2-room | 418 | $471 | 386 | $536 | +13.9% |
| 3-room | 5,384 | $428 | 6,250 | $482 | +12.7% |
| 4-room | 9,647 | $443 | 12,306 | $499 | +12.8% |
| 5-room | 5,984 | $430 | 7,774 | $480 | +11.7% |
| Executive | 1,882 | $407 | 2,250 | $453 | +11.2% |
| 3Gen | 18 | $449 | 18 | $491 | +9.3% |
As you may very well know by now, other than volume, prices have increased across the board, with each category registering at least a 2 digit percentage increase with the exception of 1-room and 3Gen HDB flats.
All BTO launch sites of 2021
| Town | BTO Name | Launch Date | Est. Completion | Units |
| Toa Payoh | Alkaff Breeze | 04 Feb 2021 | 2Q 2024 | 353 |
| Toa Payoh | Bartley GreenRise | 04 Feb 2021 | 2Q 2025 | 387 |
| Toa Payoh | ParkEdge @ Bidadari | 04 Feb 2021 | 1Q 2025 | 476 |
| Bukit Batok | Harmony Village @ Bukit Batok | 04 Feb 2021 | 2Q 2024 | 169 |
| Bukit Batok | West Hill @ Bukit Batok | 04 Feb 2021 | 2Q 2026 | 962 |
| Bukit Merah | Telok Blangah Beacon | 25 May 2021 | 1Q 2027 | 175 |
| Central | River Peaks I & II | 17 Nov 2021 | 2Q 2028 | 960 |
| Choa Chu Kang | Heart of Yew Tee | 17 Nov 2021 | 3Q 2026 | 68 |
| Geylang | MacPherson Weave | 25 May 2021 | 1Q 2026 | 1382 |
| Hougang | Hougang Citrine | 11 Aug 2021 | 1Q 2025 | 749 |
| Hougang | Hougang Olive | 17 Nov 2021 | 1Q 2025 | 390 |
| Hougang | Kovan Wellspring | 11 Aug 2021 | 3Q 2026 | 586 |
| Hougang | Tanjong Tree Residences @ Hougang | 17 Nov 2021 | 2Q 2026 | 300 |
| Jurong East | Toh Guan Grove | 11 Aug 2021 | 1Q 2026 | 569 |
| Jurong West | Nanyang Opal | 17 Nov 2021 | 4Q 2025 | 221 |
| Kallang/Whampoa | Kent Heights | 17 Nov 2021 | 4Q 2026 | 430 |
| Kallang/Whampoa | McNair Heights | 04 Feb 2021 | 2Q 2026 | 626 |
| Kallang/Whampoa | Towner Residences | 11 Aug 2021 | 4Q 2026 | 316 |
| Queenstown | Queen’s Arc | 11 Aug 2021 | 3Q 2027 | 610 |
| Tampines | Tampines GreenJade | 11 Aug 2021 | 3Q 2025 | 546 |
| Tampines | Tampines GreenQuartz | 11 Aug 2021 | 2Q 2026 | 1613 |
| Tengah | Garden Bloom @ Tengah | 25 May 2021 | 3Q 2025 | 782 |
| Tengah | Parc Clover @ Tengah | 17 Nov 2021 | 4Q 2024 | 1124 |
| Tengah | Parc Glen @ Tengah | 17 Nov 2021 | 4Q 2024 | 1008 |
| Tengah | Parc Woods @ Tengah | 04 Feb 2021 | 1Q 2025 | 767 |
| Woodlands | Woodgrove Ascent | 25 May 2021 | 3Q 2025 | 1540 |
Executive Condominium (EC) launches in 2021
| EC New Launches In 2021 | Units | Units Sold to-date | Lowest $PSF in 2021 | Highest $PSF in 2021 | Median $PSF in 2021 | Take-Up Rate |
| Provence Residence | 413 | 355 | $1,004 | $1,304 | $1,158 | 85.96% |
| Parc Greenwich | 496 | 435 | $1,029 | $1,379 | $1,233 | 87.70% |
| Ola | 548 | 530 | $1,013 | $1,357 | $1,148 | 96.72% |
| Parc Central Residences | 700 | 695 | $1,002 | $1,286 | $1,175 | 99.29% |
Policy measures/changes in 2021
- 16 Dec new property cooling measures
- 10-year MOP for prime region HDB flats
1. 16 Dec new property cooling measures
The full details of this can be found in our earlier article.
Unless you’ve been living under a rock for the past month, you’d probably have heard of the new property cooling measures that were just recently announced.
Here’s a brief recap:
| Cooling Measure | Old Measure | 16 December 2021 New Measure |
|---|---|---|
| Loan To Value Ratio | 90% for HDB loans 75% for bank loans | 85% for HDB loans 75% for bank loans |
| Total Debt Servicing Ratio | 60% of monthly income | 55% of monthly income |
| Additional Buyers Stamp Duty | Singapore Citizens None for first property 12% on second property 15% on subsequent property Permanent Residents 5% on first property 15% on subsequent property Foreigners 20% Entities 25% +5% non-remissible for property developers | Singapore Citizens None for first property 17% on second property 25% on subsequent property Permanent Residents 5% on first property 25% on second property 30% on subsequent property Foreigners 30% Entities 35% +5% non-remissible for property developers |
In all honesty, this has been a long time coming. We’ve even talked about it as early as Jan 2021 (it was on 18 Jan DPM Heng Swee Keat said the government is paying close attention to the property market). So if anything, it has been surprising that these measures have taken as long as they have to be executed.
2. 10-year MOP for prime region HDB flats
This was a point of contention for a long time coming as well, with much discussion happening online in Dec 2020.
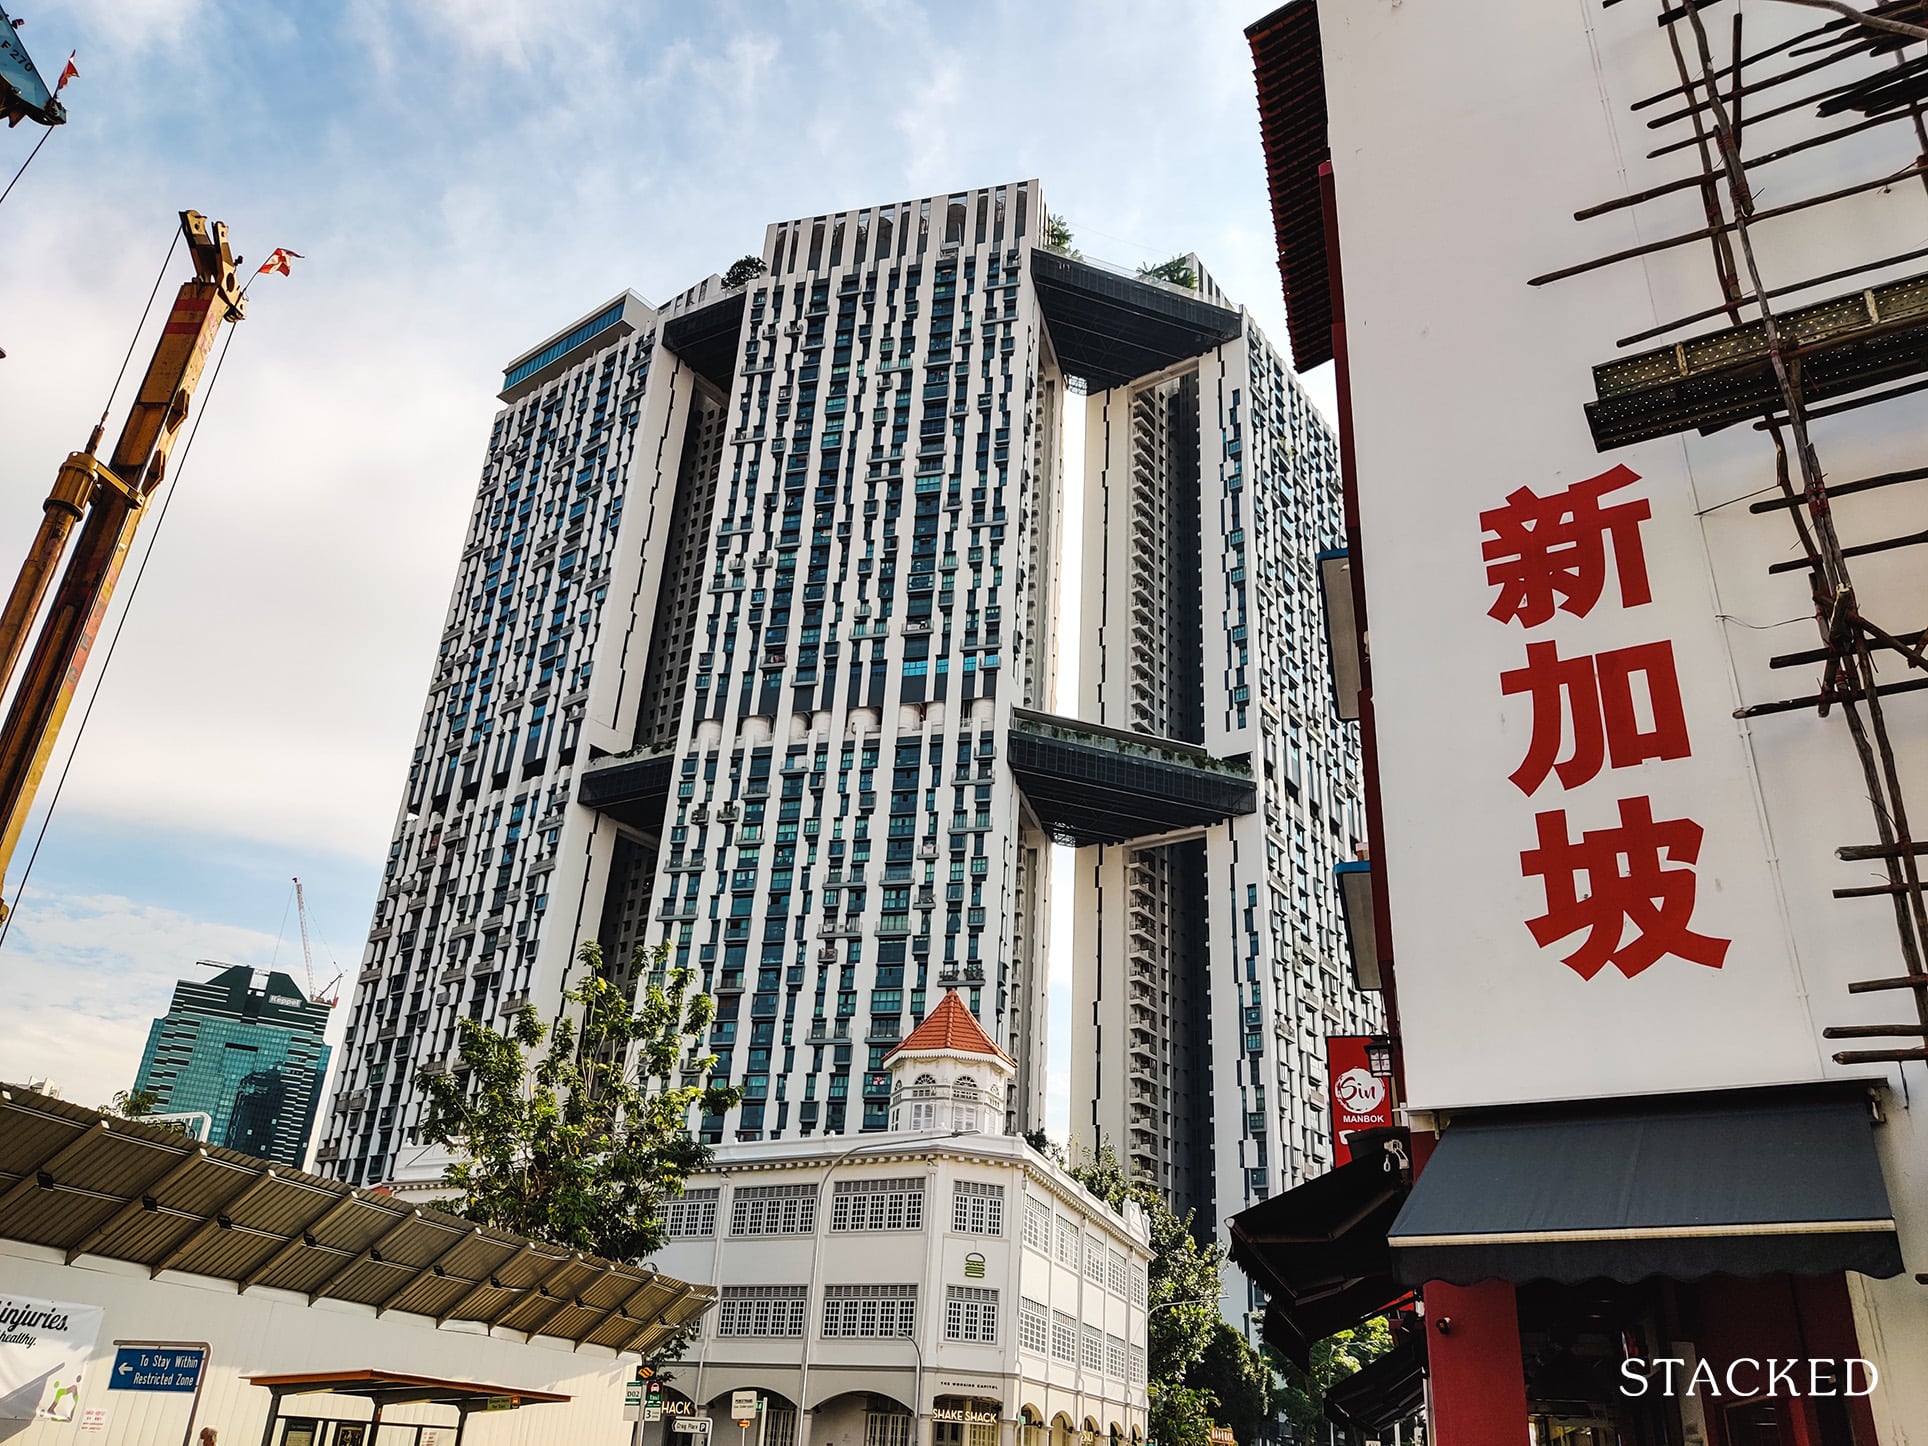
So this new PLH model comes after 10 months of public engagement from Nov 2020 to Sep 2021. There were more than 7,500 Singaporeans consulted for feedback, including first-time homebuyers, existing homeowners, industry experts, and academics.
The new PLH model imposes some additional restrictions, on HDB flats bought in prime areas:
- 10-year MOP instead of five years
- No renting out the whole flat
- Subsidy Recovery, on top of existing resale levy
- Tighter eligibility requirements
- Reduced number of flats set aside for MCPS
It’s still up in the air how this new ruling may affect HDB prices down the road. But for now, the common consensus is that HDB flats on the edge of the prime areas will benefit most from the new ruling. HDB has clarified that there will be no retroactive application of PLH model rules, on flats already in prime areas. Existing resale flats in prime areas will not suddenly have 10-year MOPs or income ceilings, so again, owners in these areas will stand to gain the most.
Notable trends that emerged in 2021
- Condolidation of agencies
- Super prime real estate
- OCR condos dominating
- Trend of larger homes
1. Consolidation of agencies
With the recent exodus from Orange Tee and Tie (OTT) toward other real estate agencies, there’s a real possibility that the “big four” will soon become the “big three”. Singapore’s real estate firms now resemble an oligopoly, with possibly just three “power players” dominating the market.
While most consumers may not think much of it, there may be further knock-on implications that could indirectly affect the market. With rising land costs, an increase in ABSD, and development charges, property developer margins are getting slimmer by the day. Couple that with the increase in the influence of the big property agencies, and you have a somewhat unhealthy situation in that developers absolutely need the agencies to market their units. They don’t have the database of potential buyers, or the sheer numbers required to push their projects.
The combination of factors here could result in preventing further innovation as well as a negative impact on a push for better service levels among agents.
2. Super prime real estate
We’ve yet to see the final numbers yet, but so far Good Class Bungalow (GCB) transactions have totalled close to 90 as of end-2021. This has way surpassed 2020’s number of 44 transactions, with notable high-profile deals such as Secretlab CEO’s purchasing of 27 Olive Road for $36m and the spouse of Grab’s founder transaction of 55 Bin Tong Park for $40m. The biggest deal of the year so far still goes to the wife of Nanofilm’s founder, who bought 30 Nassim Road for a jaw-dropping $128.8m.
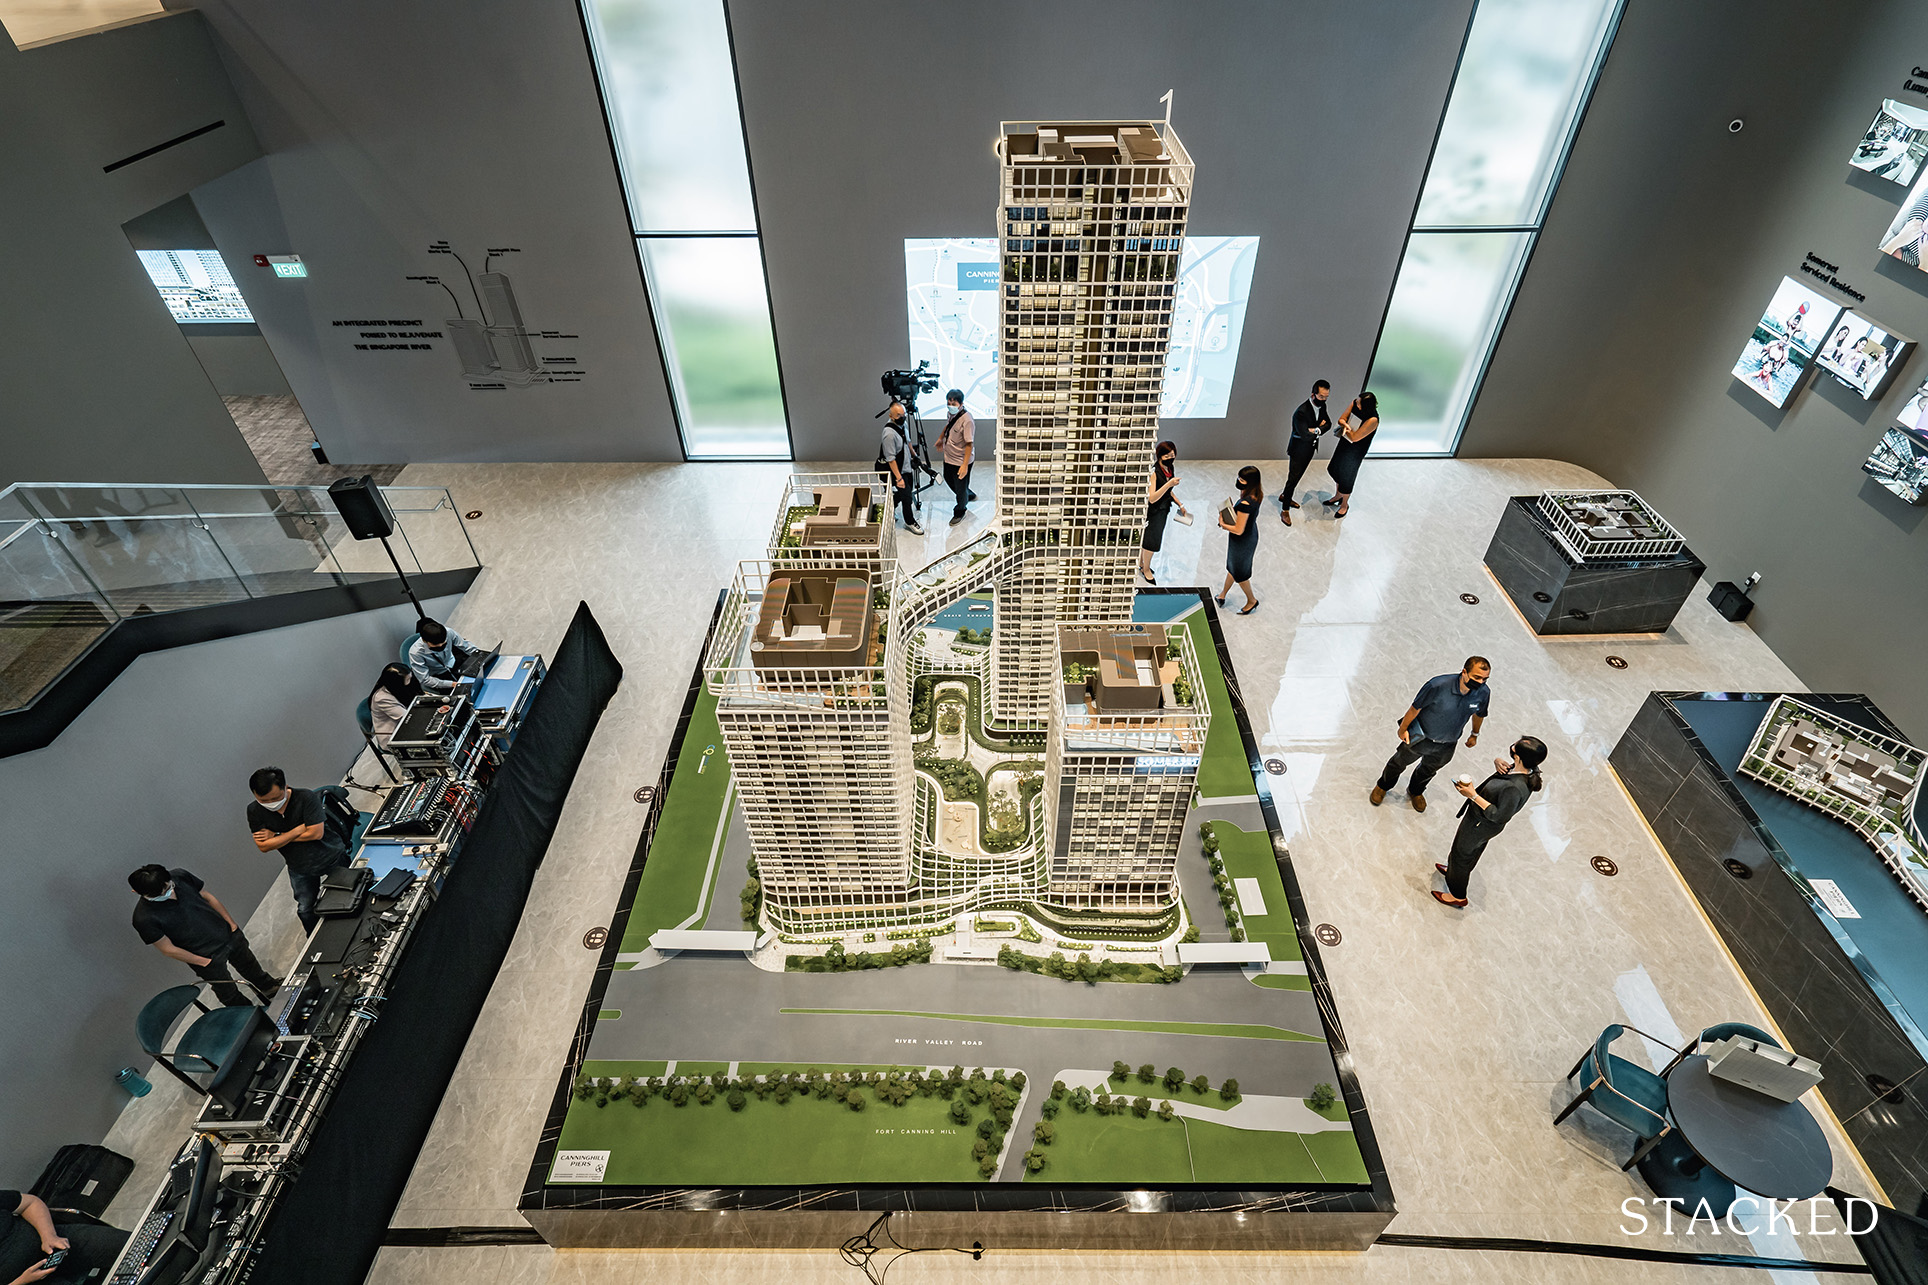
It’s not just about landed properties either, ultra-luxury condominiums have been hitting the headlines in 2021 as well. One of the early highlights was the deal for Eden at 2 Draycott Park, where the entire development was bought for $293.m, or $4,827 psf by the Tsai family of Taiwan. In late October, the penthouse unit at the ultra-luxury Les Maisons Nassim was sold for $75 million or $6,210 psf which is stratospheric for a condo unit. Mind you, this isn’t like the Wallich Residence super penthouse (which is the highest possible point to live at in Singapore), so this deal will take some beating to top. The most recent high-end deal was for the 8,956 sq ft super penthouse at CanningHill Piers, this went for $48 million, or $5,360 psf.
The reasons for the popularity of super-prime real estate in Singapore are somewhat similar to the overall surge in landed homes. But to conclude, note that the last peak for GCBs was in 2010, as recovery from the ‘08/09 financial crisis settled in. We’ve seen that investors like to consider Singapore real estate – especially freehold landed homes – as a safe haven in volatile times. With the supply of GCBs limited to just the 39 areas in Singapore, there’s seemingly little supply to meet the demand of such luxurious landed living in Singapore. The same goes for the ultra-luxury penthouses – given there’s only one in each development, the size and exclusivity are always going to be a major draw for the ultra-wealthy foreigners.
3. OCR condos dominating
As with the numbers reported at the year-end, OCR condos have represented the largest price increase from 2020.
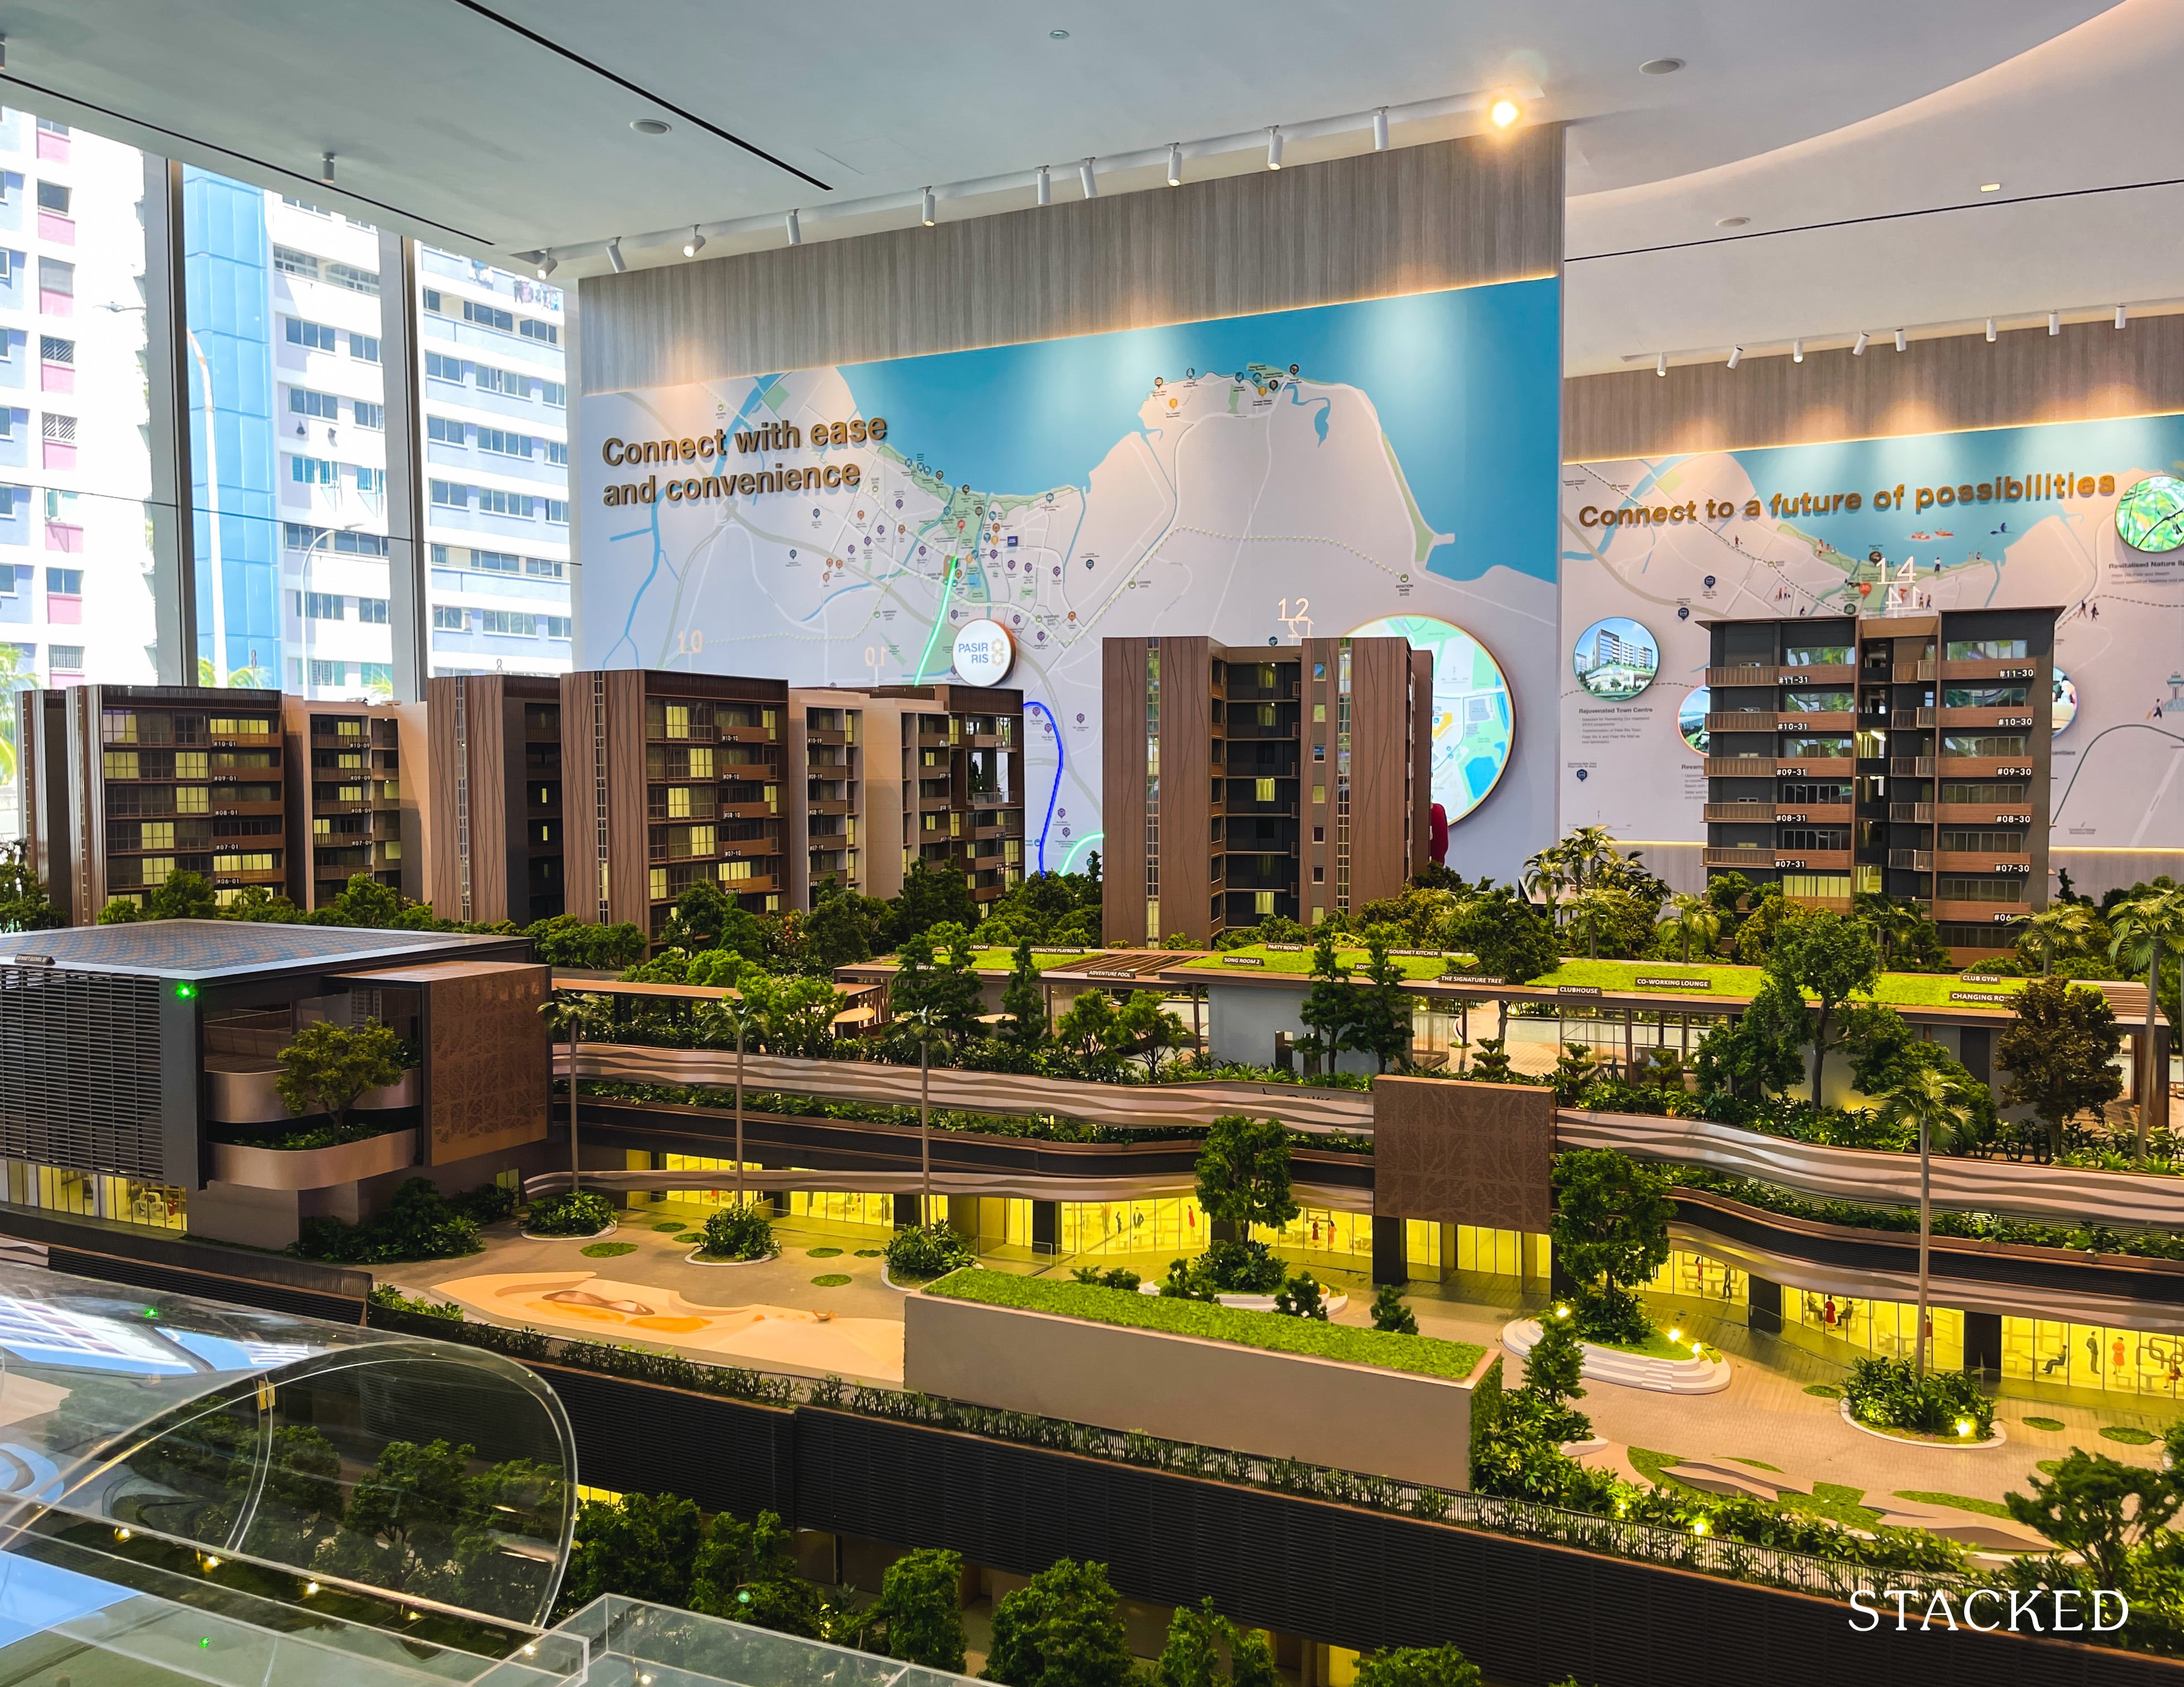
The biggest demographic of home buyers right now are HDB upgraders. For these buyers, the right price tends to be a quantum of between $1.2 million to $1.5 million. In most cases, this comes down to financing. The difficulty lies in the cash portion of the down payment.
The first five per cent of the new home must be paid in hard cash; for most upgraders, this will be roughly between $60,000 to $75,000. In our experience, most upgraders can barely cover this, after selling a 4-room flat and refunding their CPF.
Given that the average family unit in the RCR approaches $1.8 million, this restricts most upgraders – and hence the bulk of buyers in general – to OCR condos.
4. Trend of larger homes
If we were to just go by the trends from our most-read list of 2021, it would be a cinch to pick out that homebuyers are gravitating towards larger homes. Notable pieces include the ultimate list of Executive Maisonette and jumbo flats, touring one of the cheapest freehold landed estates, and a list of older, freehold condos as well.
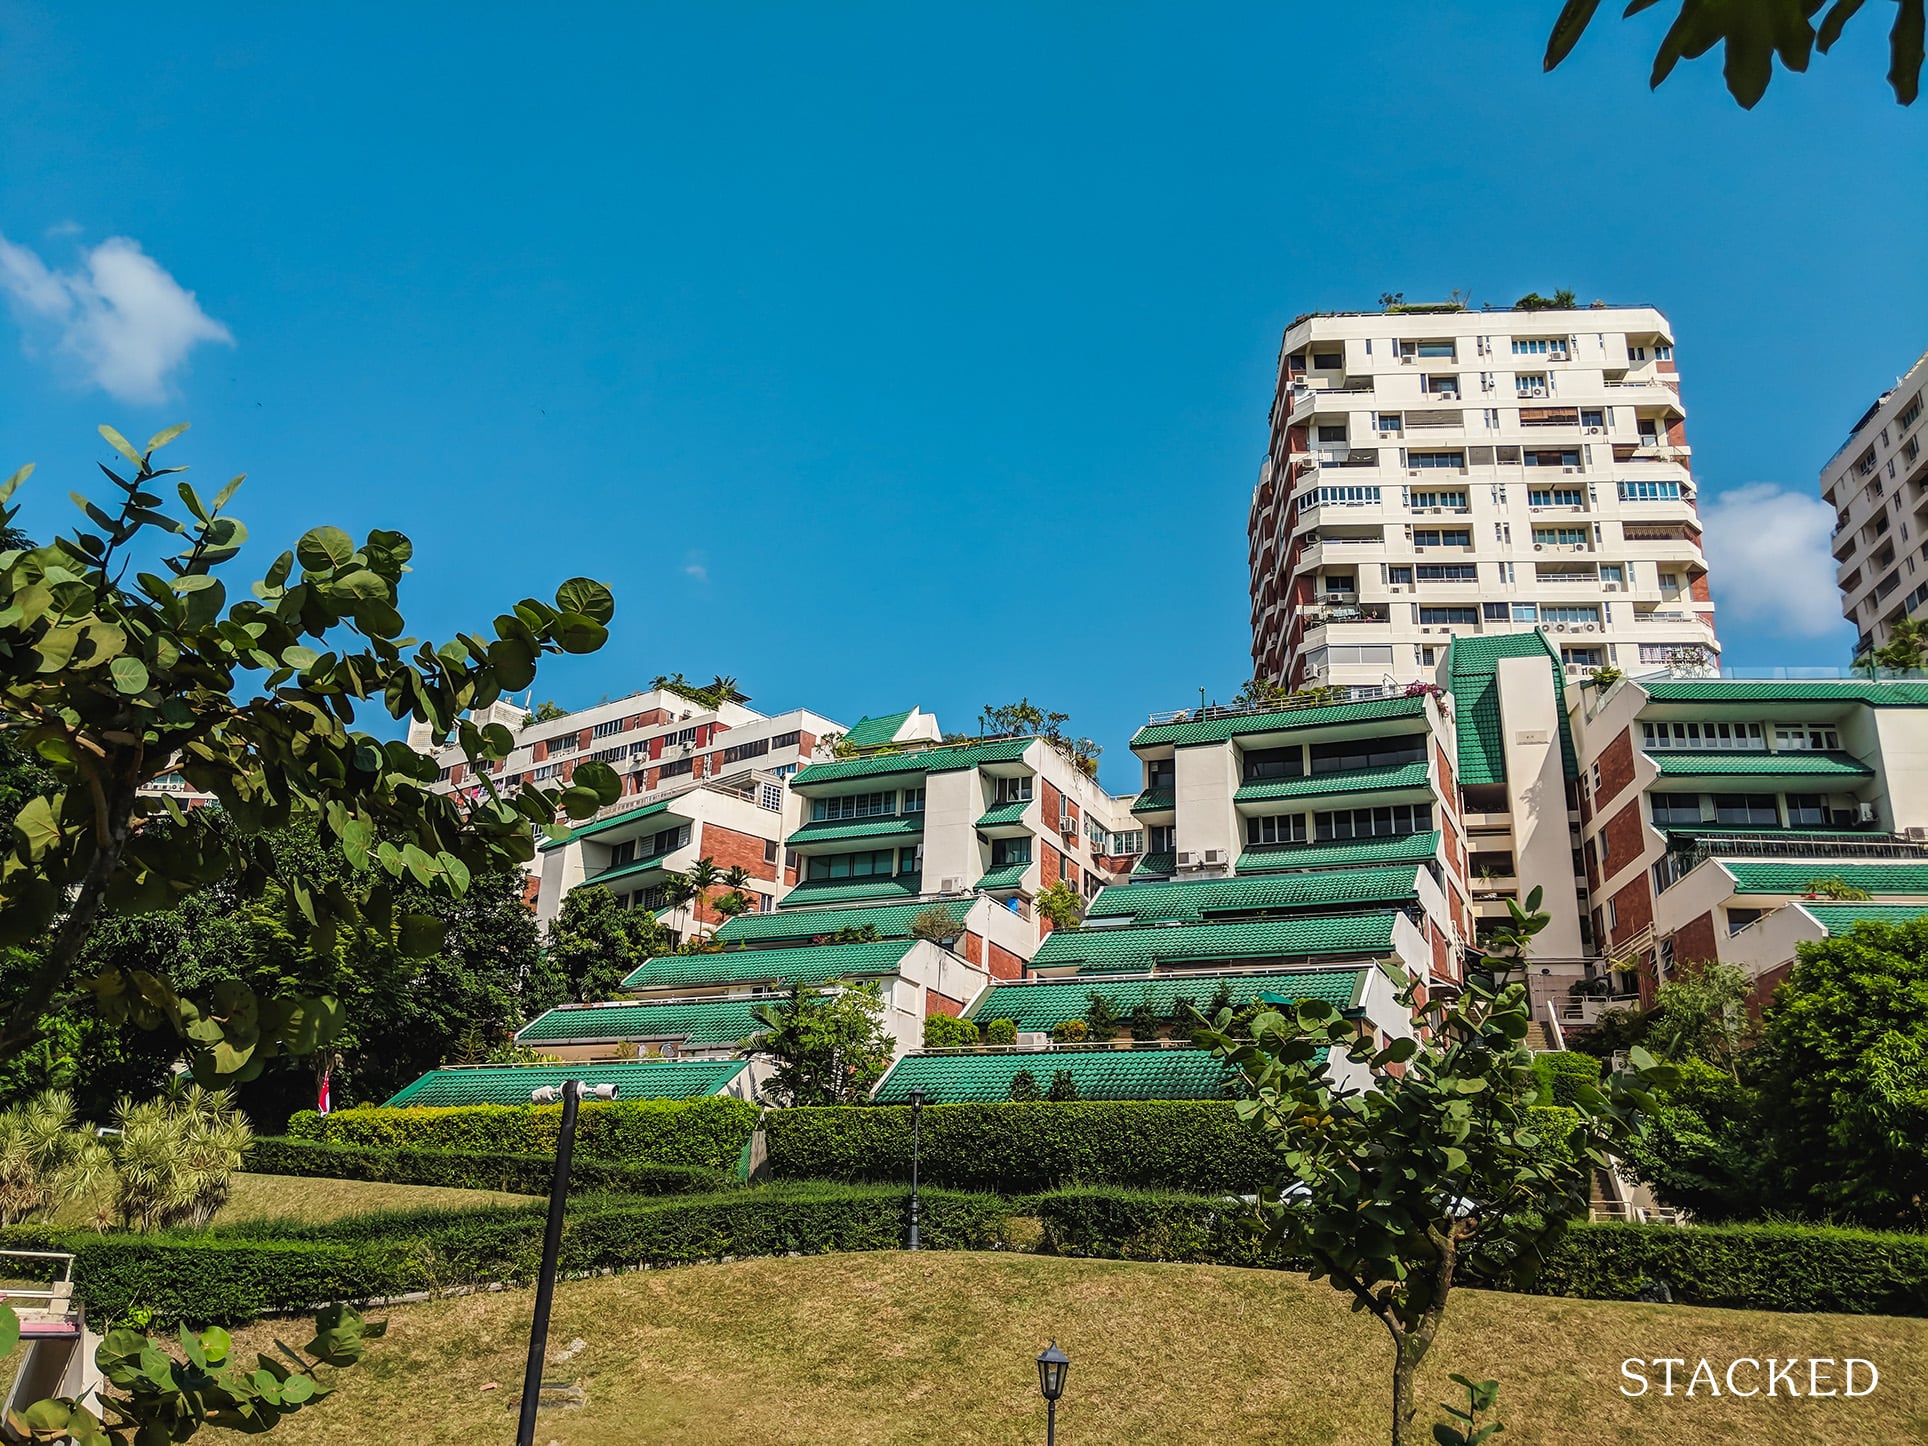
Because of the pandemic, many people have now realised the importance of space, and are more willing to pay the premium purely because of the amount of time now spent at home. While work from home isn’t yet a permanent fixture, it will increasingly become a reality (or at least, a hybrid arrangement for many). Despite the measures relaxing from Jan 1, 2022 (50% of the workforce will now be allowed to go back to the office), it is likely that this trend may yet still persist in 2022.
Overall, the property market has definitely been a good year for sellers, not so much for buyers
The announcement of the new cooling measures will certainly have an effect on the market, and we expect the start of 2022 to start a little slowly. The foreigner ABSD increase is undoubtedly a big jump and will be a cause for concern for many of the higher-end launches in Singapore, just as some momentum seemed to be picking up for the CCR launches. A trickle of discounts has already started since the announcement, and we do think that there could be more coming, given that some will be facing ABSD deadlines in 2023.
To wrap up, there’s no question that the pandemic has and will create lasting changes, not just in the property market, but beyond. 2022 will be a year when many of us finally settle into a post-pandemic new normal, and hopefully, we can see light at the end of the tunnel.
For more updates on the property market and development reviews, follow us on Stacked. We’ll keep you up to date as the changes happen.
And from the team at Stacked, enjoy the holidays and have a Happy New Year!
At Stacked, we like to look beyond the headlines and surface-level numbers, and focus on how things play out in the real world.
If you’d like to discuss how this applies to your own circumstances, you can reach out for a one-to-one consultation here.
And if you simply have a question or want to share a thought, feel free to write to us at stories@stackedhomes.com — we read every message.
Frequently asked questions
How did the property market in Singapore perform in 2021?
What were the top-selling property developments in Singapore in 2021?
How did resale HDB prices change in 2021?
What was the trend in private non-landed property prices in 2021?
How did the rental market for private properties change in 2021?
What were the trends in the Singapore property market at the end of 2021?
Need help with a property decision?
Speak to our team →Read next from Property Trends
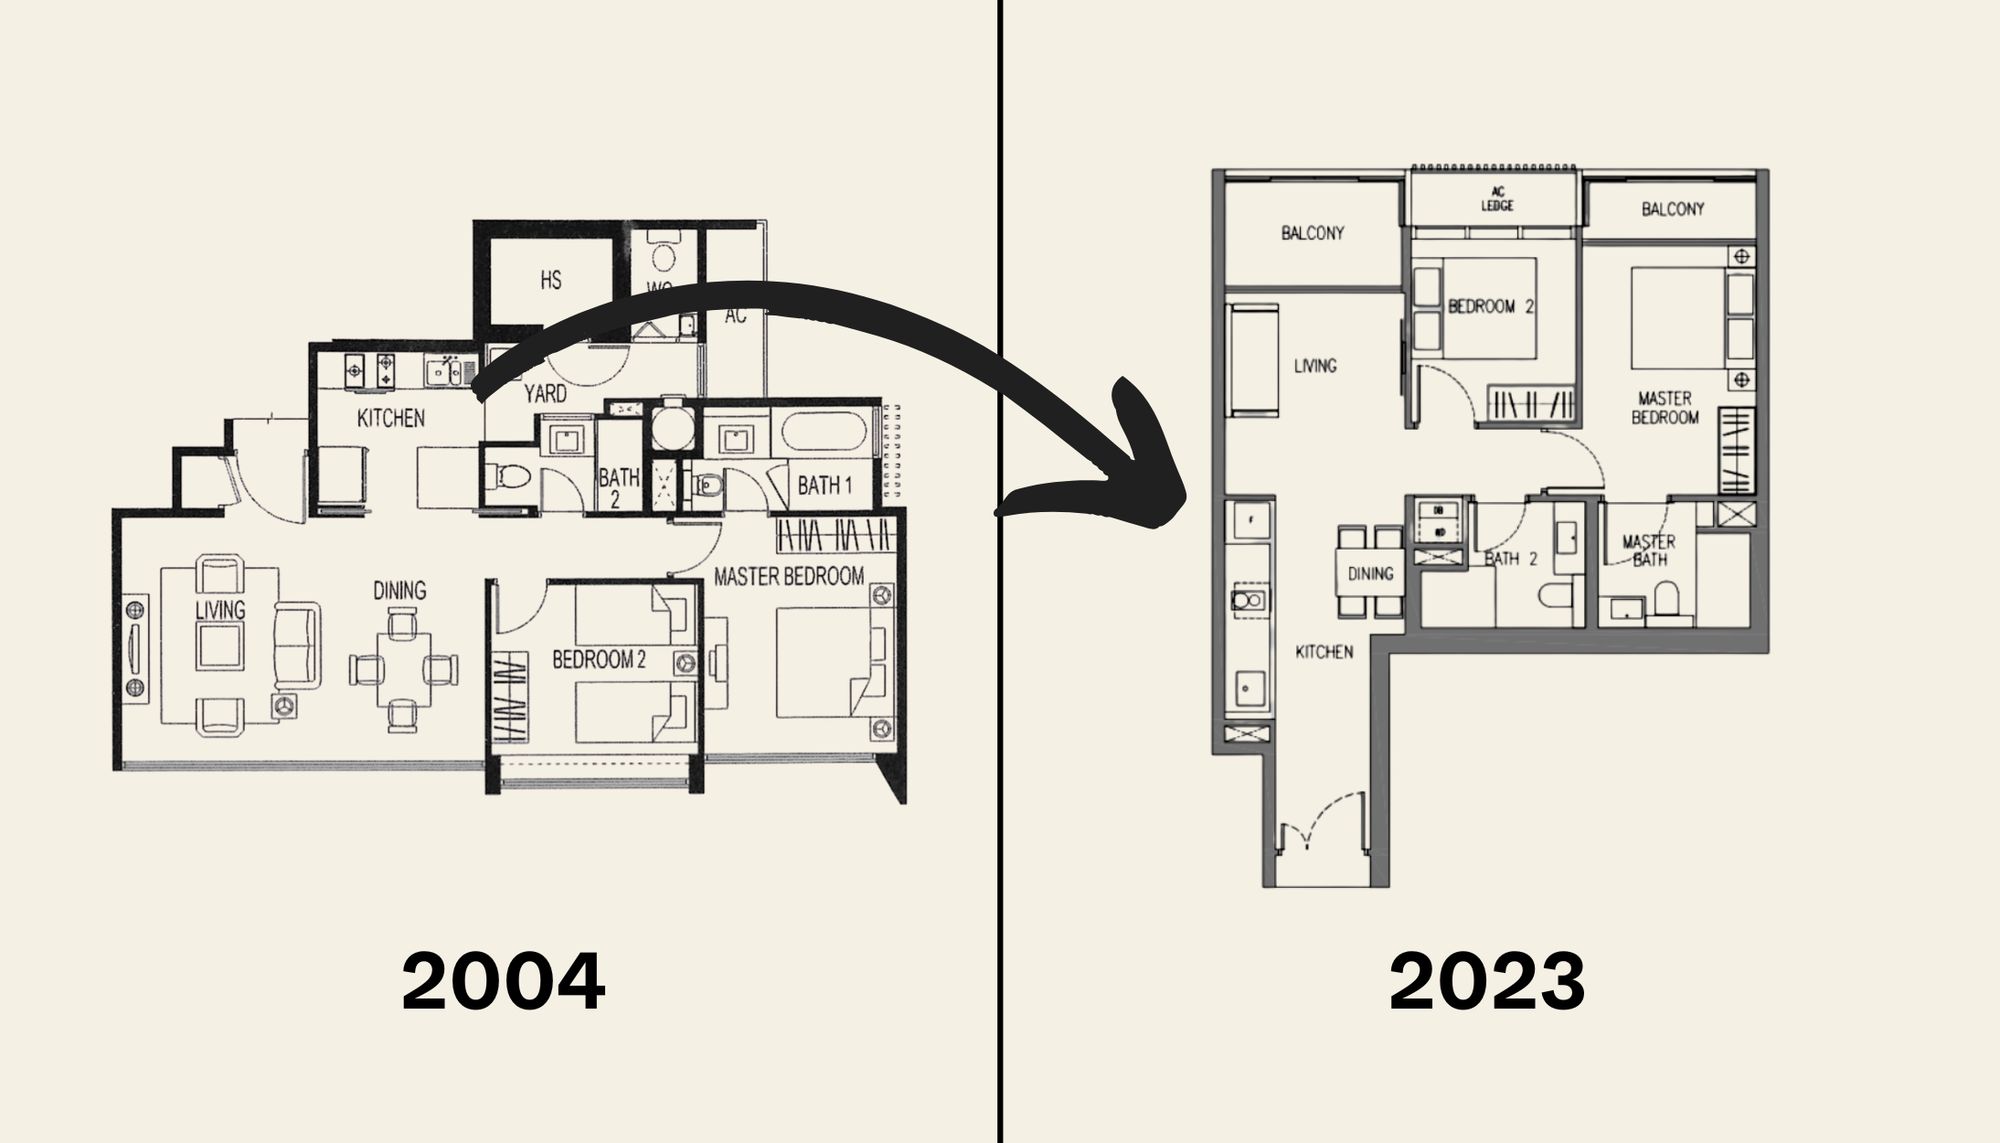
Property Trends The Room That Changed the Most in Singapore Homes: What Happened to Our Kitchens?
Property Trends Condo vs HDB: The Estates With the Smallest (and Widest) Price Gaps
Property Trends Why Upgrading From An HDB Is Harder (And Riskier) Than It Was Since Covid
Property Trends Should You Wait For The Property Market To Dip? Here’s What Past Price Crashes In Singapore Show
Latest Posts

Singapore Property News Why Some Singaporean Parents Are Considering Selling Their Flats — For Their Children’s Sake
Pro River Modern Starts From $1.548M For A Two-Bedder — How Its Pricing Compares In River Valley
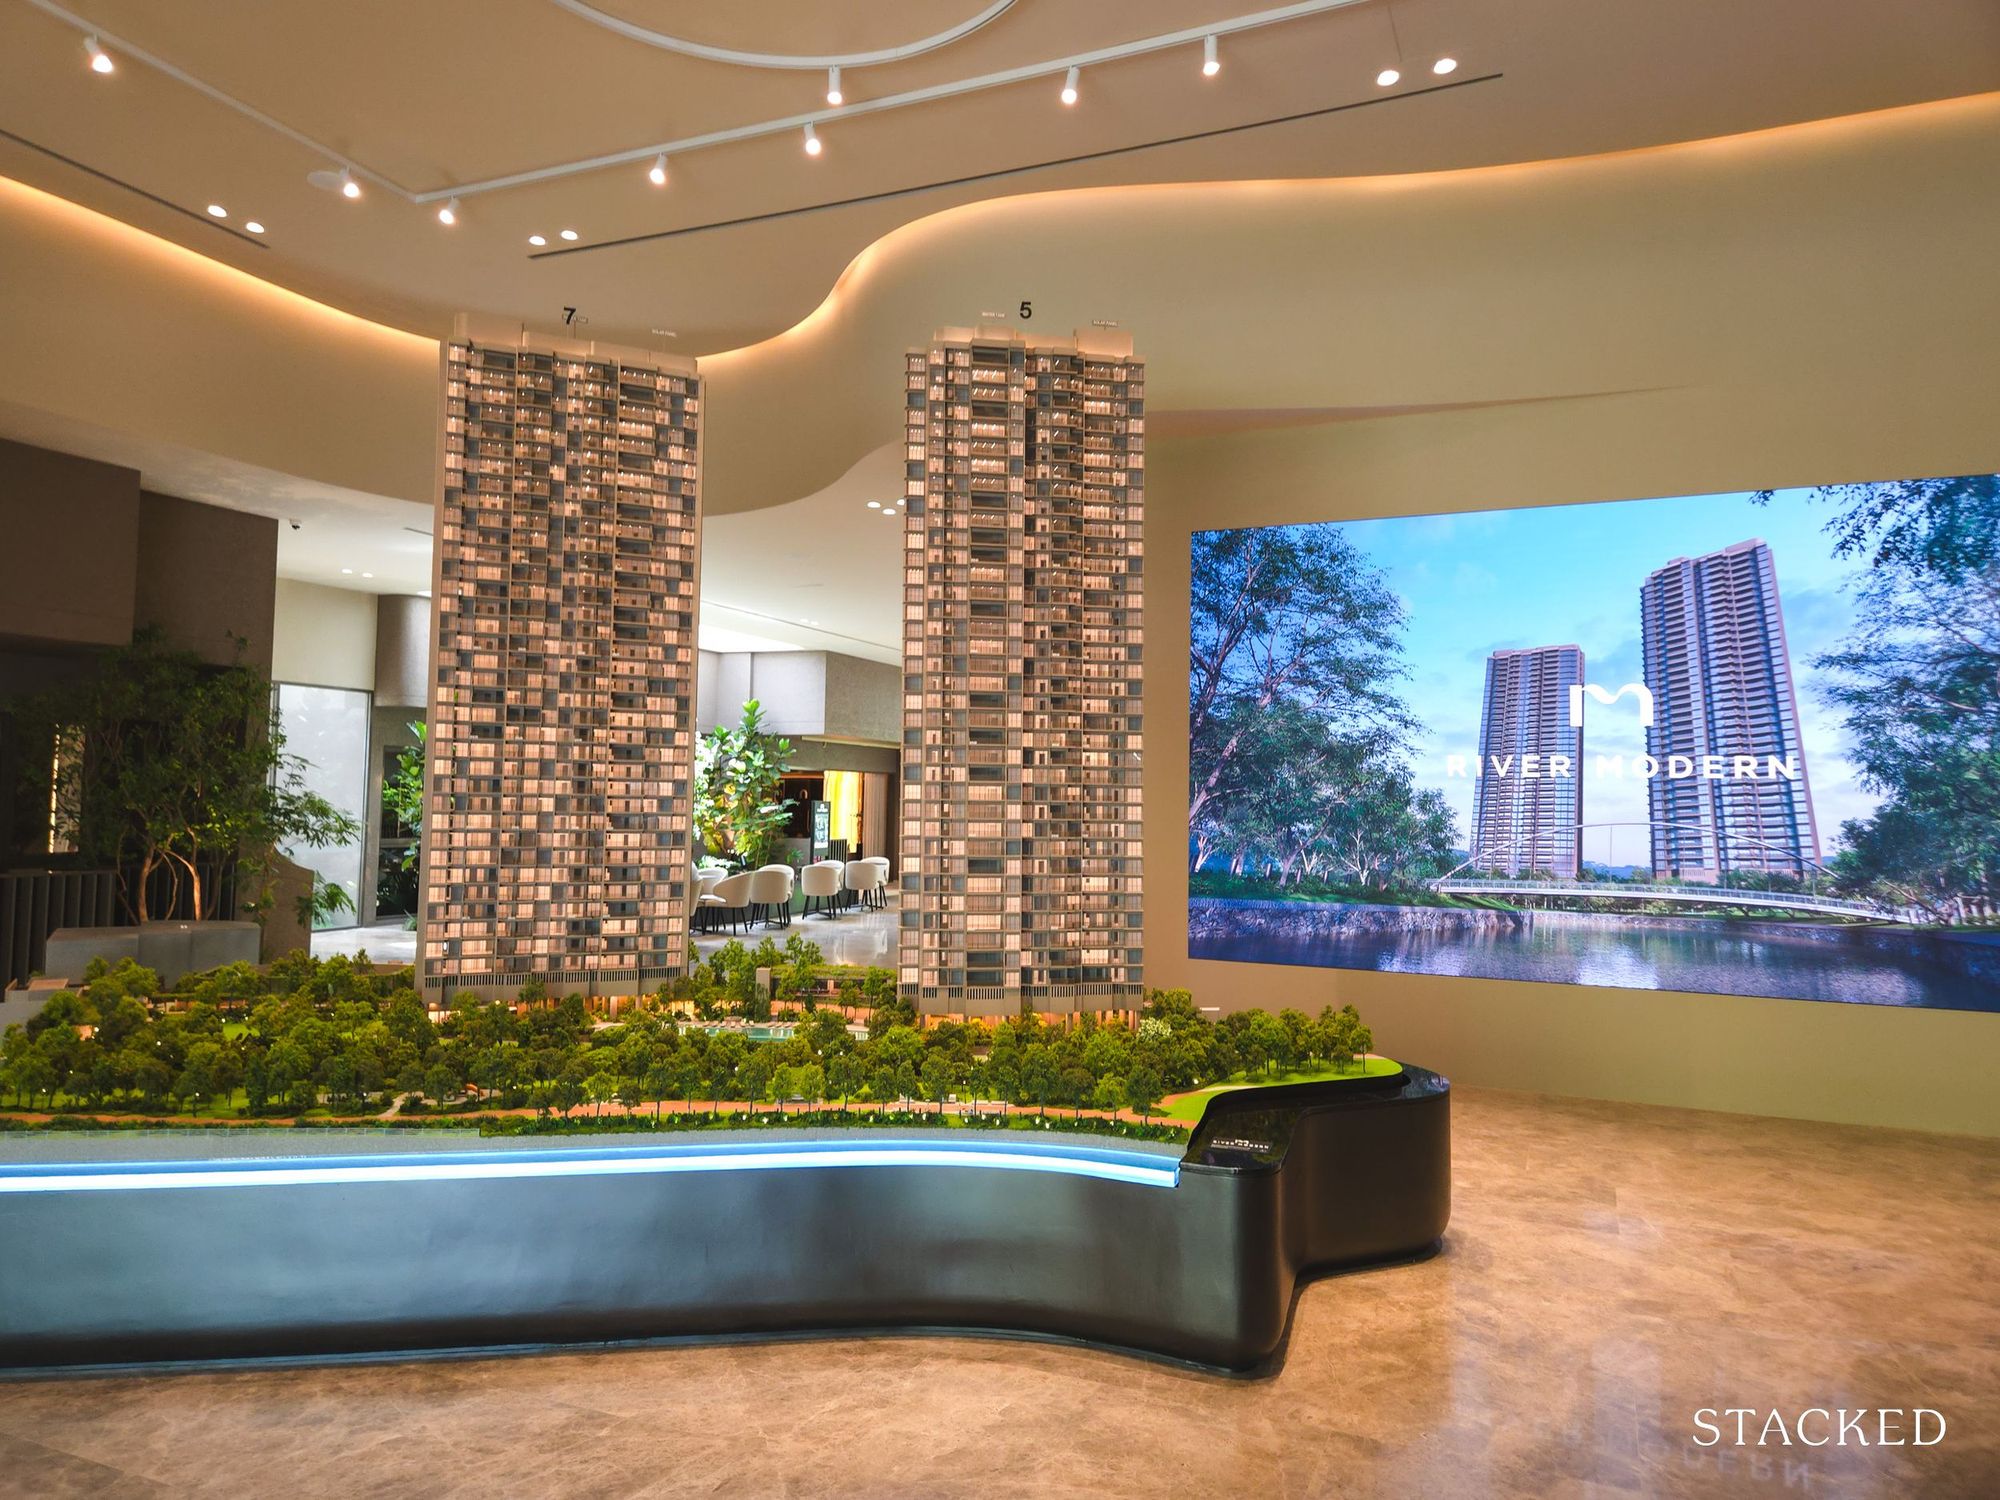
New Launch Condo Reviews River Modern Condo Review: A River-facing New Launch with Direct Access to Great World MRT Station








0 Comments