10 Most Profitable Resale Condos In 2024 (One Made $1m In 8 Years)
November 26, 2024
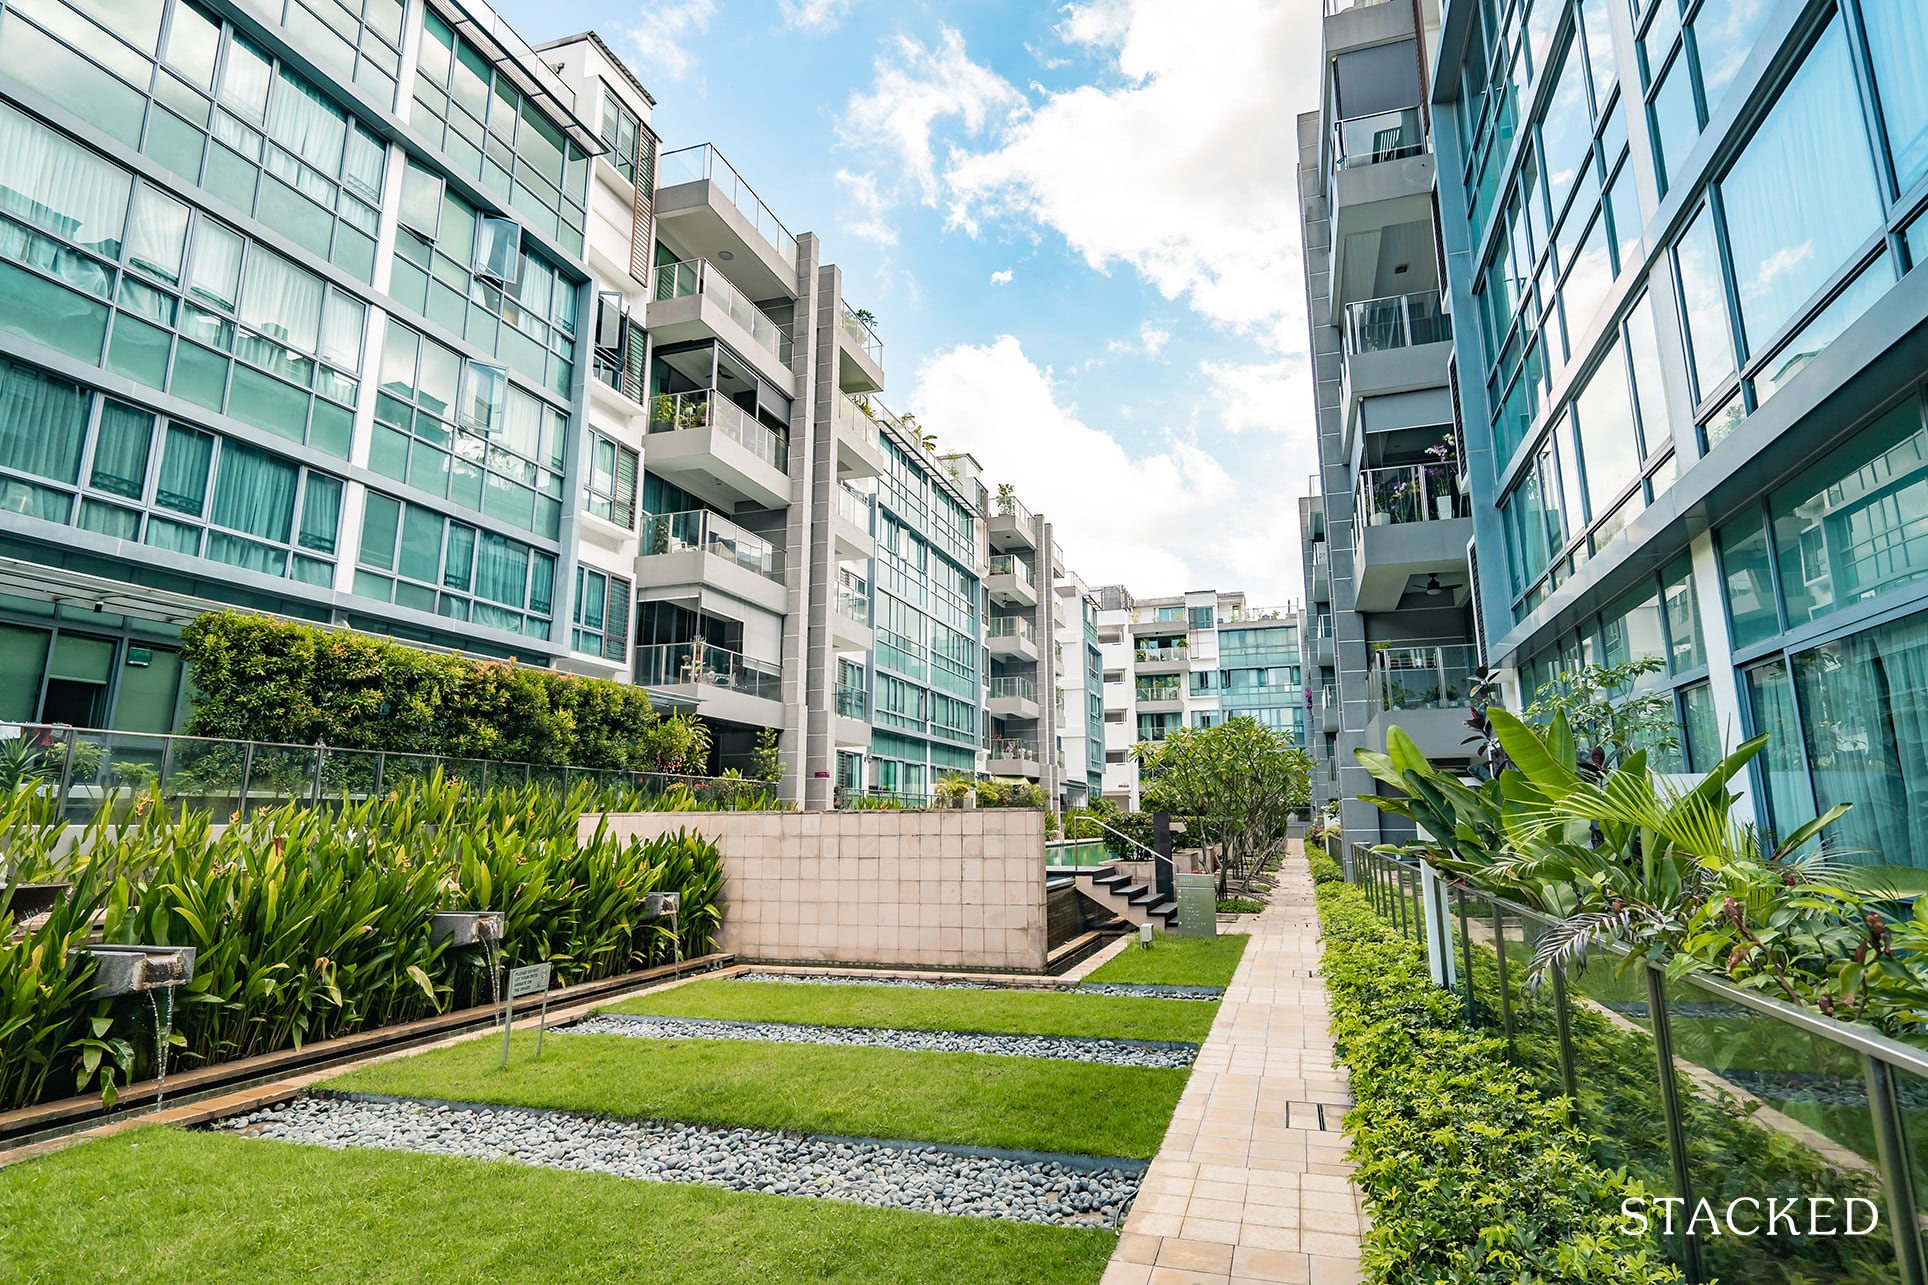
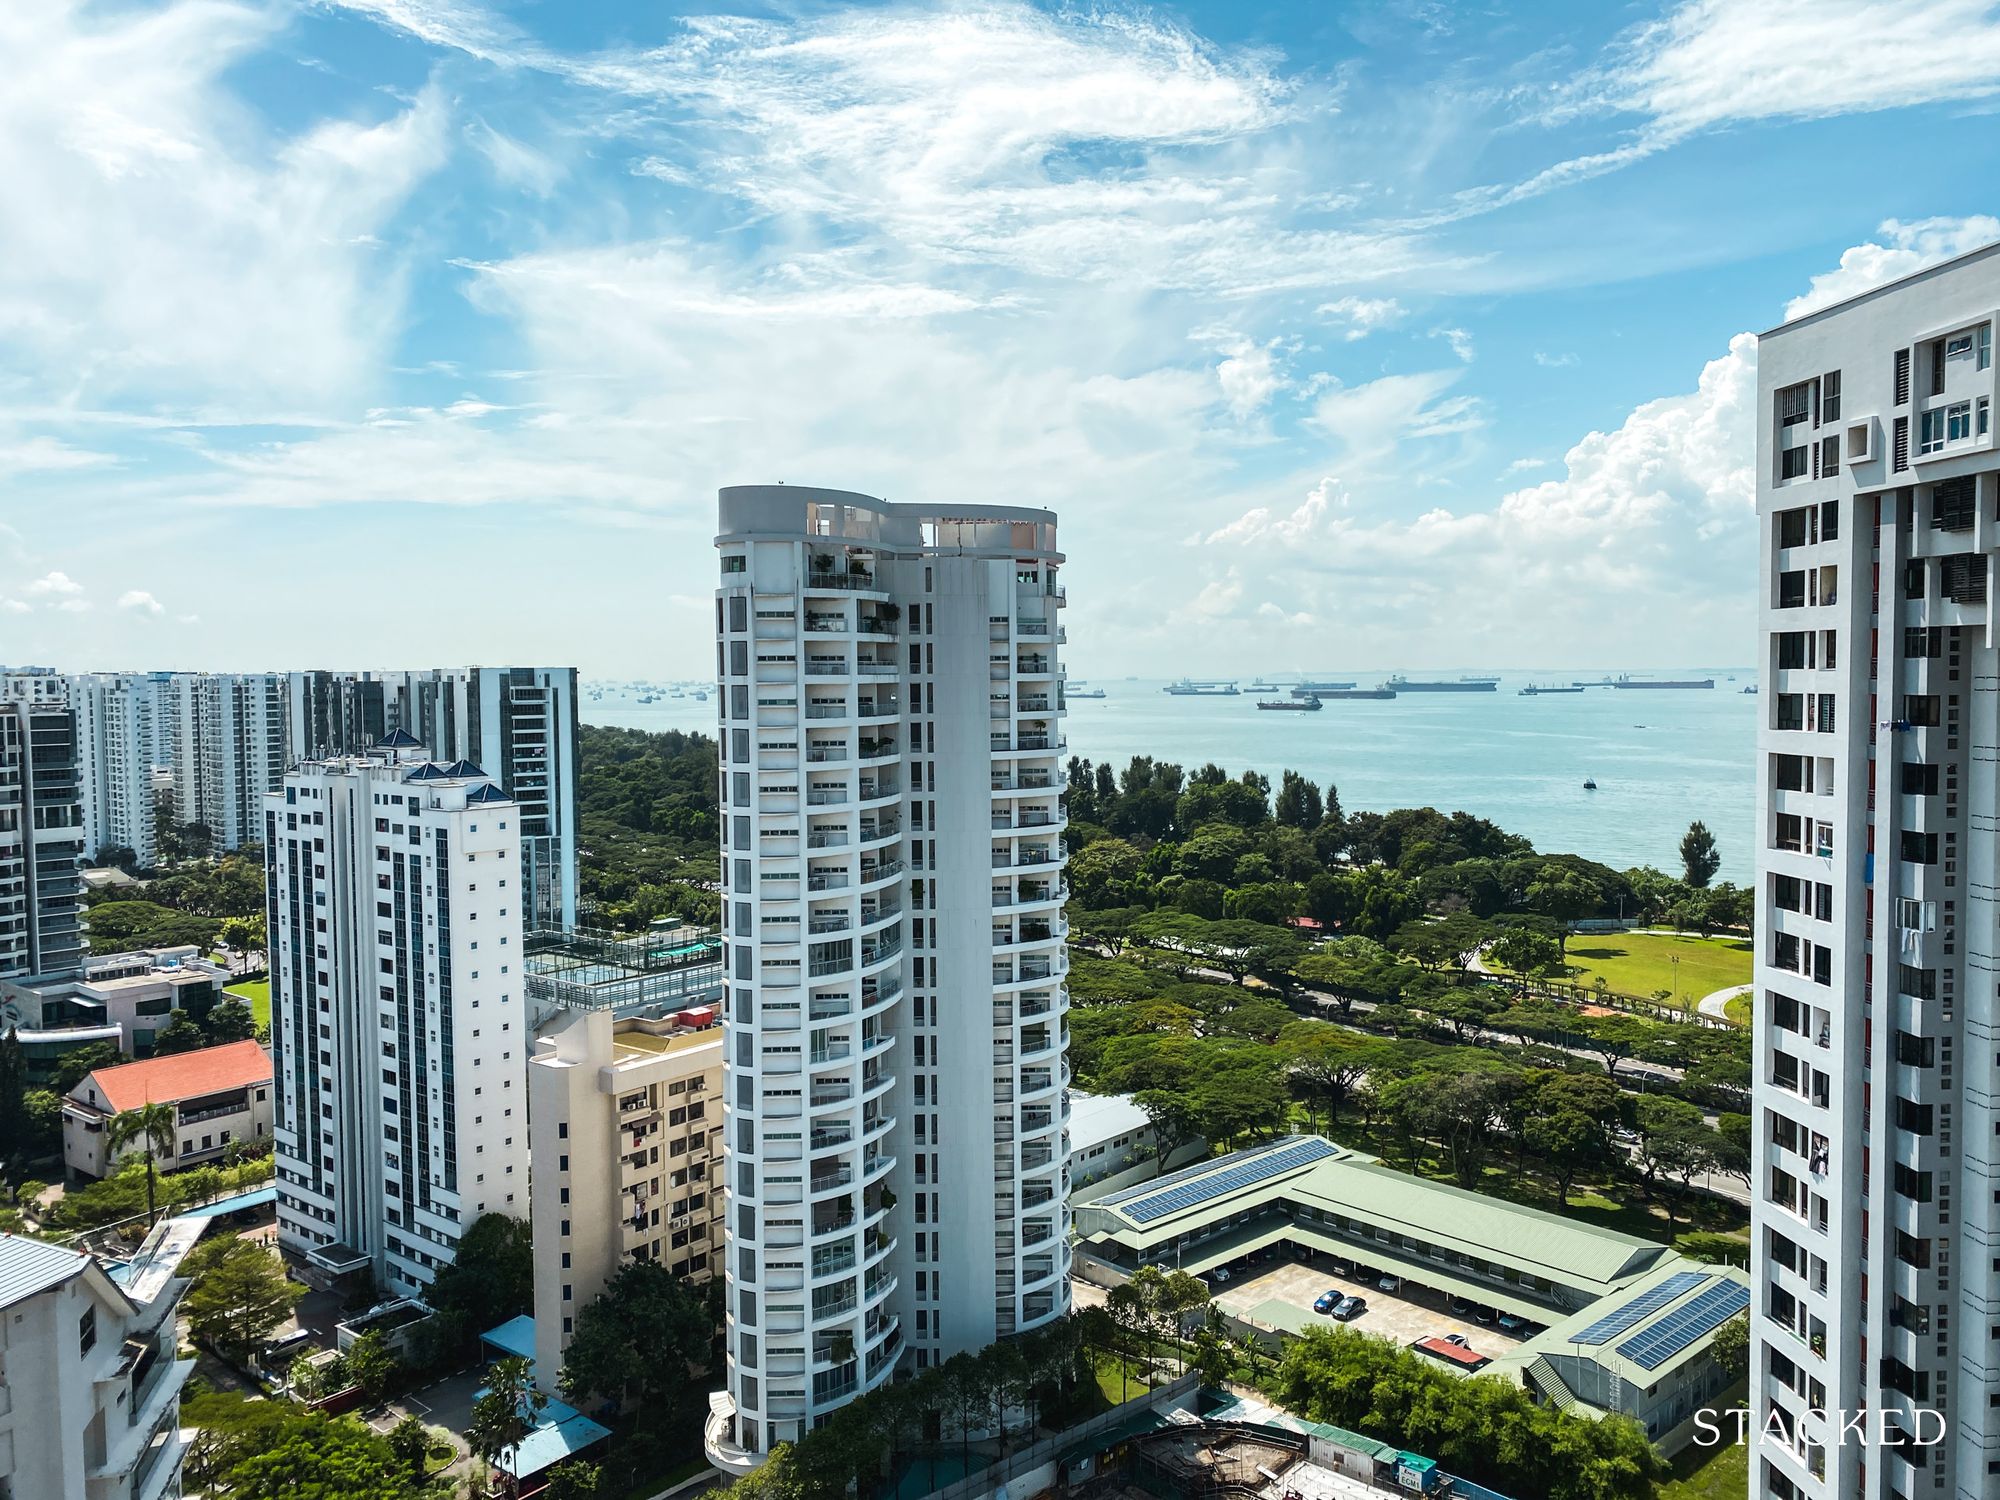
Resale condos may not have that “new car effect” of owning something brand new, but some property investors will swear by these. There are good reasons for that: not only are you observing the real product (noisy neighbours and all), but you can observe transaction histories, get feedback, and depending on the project, sometimes get a better deal because of how resale prices may sometimes lag behind a new launch. Here are some examples of resale condos that have produced mind-boggling profits to date:
Note: We only used projects with at least five transactions this year (2024), which were bought anytime between 2013 and 2023.
Top projects for resale gains, by percentage
| Project | Tenure | Completed | Avg Gains (%) | Avg Total Returns (%) | Avg Holding Period | No. of Buy/Sell Tnx |
| THE RIVERVALE | 99 yrs from 18/12/1997 | 2000 | $554,778 | 63.2% | 6.9 | 5 |
| THE BLOSSOMVALE | 999 yrs from 15/08/1884 | 1998 | $1,068,000 | 59.1% | 8.4 | 5 |
| HILLVIEW GREEN | 999 yrs from 19/05/1883 | 1998 | $741,340 | 56.7% | 5.3 | 5 |
| RIVERPARC RESIDENCE | 99 yrs from 27/12/2010 | 2014 | $547,400 | 56.3% | 3.9 | 10 |
| ONE AMBER | Freehold | 2010 | $925,000 | 54.7% | 7.7 | 5 |
| KOVAN MELODY | 99 yrs from 20/01/2004 | 2006 | $715,755 | 53.0% | 7.0 | 5 |
| THE FLORAVALE | 99 yrs from 16/12/1997 | 2000 | $439,022 | 51.8% | 7.2 | 5 |
| CASTLE GREEN | 99 yrs from 01/12/1993 | 1997 | $472,857 | 50.0% | 5.4 | 7 |
| EVERGREEN PARK | 99 yrs from 01/10/1995 | 1999 | $393,200 | 48.7% | 6.0 | 5 |
| VILLA MARINA | 99 yrs from 13/02/1995 | 1999 | $675,685 | 47.7% | 6.2 | 6 |
| WHITEWATER | 99 yrs from 23/07/2002 | 2005 | $401,886 | 47.3% | 5.6 | 8 |
Top projects for resale gains by amount
| Project | Tenure | Completed | Avg Gains ($) | Avg Total Returns (%) | Avg Holding Period | No. of Buy/Sell Tnx |
| THE BLOSSOMVALE | 999 yrs from 15/08/1884 | 1998 | $1,068,000 | 59.1% | 8.4 | 5 |
| THE TESSARINA | Freehold | 2003 | $954,033 | 38.2% | 6.6 | 6 |
| PANDAN VALLEY | Freehold | 1978 | $947,200 | 43.8% | 7.7 | 5 |
| ONE AMBER | Freehold | 2010 | $925,000 | 54.7% | 7.7 | 5 |
| THE TRILLIUM | Freehold | 2010 | $886,000 | 22.5% | 6.6 | 5 |
| THE SIXTH AVENUE RESIDENCES | Freehold | 2009 | $853,178 | 41.3% | 7.0 | 5 |
| HILLINGTON GREEN | 999 yrs from 19/05/1883 | 2002 | $774,500 | 46.8% | 6.1 | 6 |
| HILLVIEW GREEN | 999 yrs from 19/05/1883 | 1998 | $741,340 | 56.7% | 5.3 | 5 |
| KOVAN MELODY | 99 yrs from 20/01/2004 | 2006 | $715,755 | 53.0% | 7.0 | 5 |
| BOTANNIA | 956 yrs from 27/05/1928 | 2009 | $711,481 | 42.7% | 6.6 | 6 |
| THE PARC CONDOMINIUM | Freehold | 2010 | $690,096 | 42.2% | 6.7 | 9 |
Interesting top projects:
1. The Blossomvale
The Blossomvale is a 999-year lease condo with just 220 units, built back in 1998. This condo is the most interesting on the list – not just because of its incredible gains, but because it used to suffer from significant losses in earlier decades.
The recent pick up is due in part to big improvements nearby. The King Albert Park MRT station (DTL, CRL), which didn’t exist before, is now within walking distance. This station puts residents just one stop away from Beauty World Plaza. Prior to this, Blossomvale’s location was quite inaccessible; and its closest mall was the ageing Bukit Timah Plaza. While both malls are old, the situation will also improve soon with the addition of commercial units at The Linq @ Beauty World and The Reserve Residences. In any case, KAP Residences is also in a better place with the addition of a cinema as well as several food outlets.
Next, the old Bukit Timah Railway Station is nearby. When Blossomvale was built, this wasn’t really an amenity; but now it’s a community node situated along the Rail Corridor and an excellent starting point for nature lovers and walkers. Couple this with the presence of nearby schools like Methodist Girls’ and Pei Hwa, and the appeal to families is easy to understand.
Finally, the recent new launches nearby like Mayfair Garden/Mayfair Modern next door, along with The Reserve Residences, The Linq, and 8@BT will likely have played some part in elevating the prices of the resale condos around.
That said, Blossomvale used to do quite badly. Its records show 166 profitable transactions and 121 losses. What happened? Well looking at the losses, we can see most of them came from units initially purchased in 1996, and sold around 2009.
| Sold on | Address | Unit area (sqft) | Sale price (S$ psf) | Bought on | Purchase price (S$ psf) | Profit (S$) | Holding period (days) | Annualised (%) |
| 31 Oct 2017 | 900 Dunearn Road #06-XX | 904 | 1,493 | 18 Oct 2012 | 1,535 | -38,000 | 1,839 | -0.5 |
| 13 Oct 2010 | 900 Dunearn Road #03-XX | 1,367 | 977 | 25 Apr 1996 | 1,003 | -36,000 | 5,284 | -0.2 |
| 16 Apr 2010 | 900 Dunearn Road #04-XX | 1,324 | 1,020 | 19 Apr 1996 | 1,048 | -26,000 | 5,110 | -0.1 |
| 15 Mar 2010 | 900 Dunearn Road #06-XX | 1,582 | 1,040 | 6 May 1996 | 1,066 | -18,720 | 5,061 | -0.1 |
| 22 Feb 2010 | 900 Dunearn Road #05-XX | 1,324 | 974 | 23 Apr 1996 | 1,029 | -72,000 | 5,053 | -0.4 |
| 4 Feb 2010 | 900 Dunearn Road #03-XX | 1,281 | 980 | 25 Apr 1996 | 1,032 | -66,620 | 5,033 | -0.4 |
| 18 Jan 2010 | 900 Dunearn Road #02-XX | 1,324 | 967 | 1 Apr 1996 | 1,017 | -66,000 | 5,040 | -0.4 |
| 18 Jan 2010 | 900 Dunearn Road #03-XX | 840 | 985 | 16 May 1996 | 1,012 | -23,200 | 4,995 | -0.2 |
| 23 Dec 2009 | 900 Dunearn Road #04-XX | 1,410 | 949 | 1 Jun 1999 | 1,007 | -82,000 | 3,858 | -0.6 |
| 25 Nov 2009 | 900 Dunearn Road #07-XX | 1,399 | 943 | 25 Apr 1996 | 989 | -64,000 | 4,962 | -0.3 |
| 25 Sep 2009 | 900 Dunearn Road #07-XX | 840 | 995 | 6 May 1996 | 995 | 0 | 4,890 | 0 |
| 4 Sep 2009 | 900 Dunearn Road #08-XX | 840 | 887 | 25 Apr 1996 | 998 | -93,000 | 4,880 | -0.9 |
| 1 Jun 2009 | 900 Dunearn Road #08-XX | 840 | 869 | 19 Apr 1996 | 964 | -79,000 | 4,791 | -0.8 |
| 8 May 2009 | 900 Dunearn Road #04-XX | 1,012 | 835 | 1 Jun 1999 | 852 | -8,000 | 3,629 | -0.1 |
| 7 May 2009 | 900 Dunearn Road #06-XX | 1,399 | 715 | 11 Apr 1996 | 985 | -378,000 | 4,774 | -2.4 |
| 27 Apr 2009 | 900 Dunearn Road #01-XX | 1,141 | 745 | 6 May 1996 | 989 | -278,000 | 4,739 | -2.2 |
| 14 Apr 2009 | 900 Dunearn Road #01-XX | 1,550 | 713 | 19 Apr 1996 | 938 | -349,000 | 4,743 | -2.1 |
| 9 Apr 2009 | 900 Dunearn Road #05-XX | 1,012 | 791 | 25 Apr 1996 | 1,072 | -273,000 | 4,732 | -2.2 |
| 20 Mar 2009 | 900 Dunearn Road #06-XX | 1,432 | 768 | 1 Apr 1996 | 1,050 | -403,000 | 4,736 | -2.4 |
| 6 Feb 2009 | 900 Dunearn Road #07-XX | 1,367 | 775 | 16 Apr 1999 | 775 | 0 | 3,584 | 0 |
It probably isn’t a coincidence that the Global Financial Crisis was in 08/09, or that the Asian Financial Crisis was in 1997. So the number of losing transactions likely reflects wider economic issues, rather than any actual problems with Blossomvale itself.
We can see Blossomvale’s prices have more than recovered, and have steadily climbed over the past decade. Possibly, buyers who picked up units at a low cost (such as urgent sales during the Global Financial Crisis) saw good returns as a result.
The last transaction, in August 2024, saw a price of $2,263 psf. This was for an 840 sq. ft. unit, which came to a quantum of just $1.9 million. A family-sized unit (1,410 sq.ft.) also transacted in June, for about $2,170 psf. This came to a quantum that was slightly over $3 million. These transactions reflected annualised gains of 5.8 and 7.4 per cent respectively, and show quite the turnaround that’s happening for Blossomvale.
Transactions
| Sold on | Address | Unit area (sqft) | Sale price (S$ psf) | Bought on | Purchase price (S$ psf) | Profit (S$) | Holding Period (Years) | Annualised (%) |
| 29 Aug 2024 | 900 Dunearn Road #04-XX | 840 | $2,263 | 26 Feb 2018 | $1,572 | $580,000 | 6.5 | 5.8 |
| 14 Jun 2024 | 900 Dunearn Road #05-XX | 1,410 | $2,170 | 17 Mar 2017 | $1,291 | $1,240,000 | 7.2 | 7.4 |
| 31 May 2024 | 900 Dunearn Road #07-XX | 1,410 | $2,269 | 25 May 2016 | $1,333 | $1,320,000 | 8.0 | 6.9 |
| 25 Apr 2024 | 900 Dunearn Road #04-XX | 1,572 | $2,132 | 31 Jul 2013 | $1,304 | $1,300,000 | 10.7 | 4.7 |
| 17 Apr 2024 | 900 Dunearn Road #03-XX | 1,324 | $2,039 | 6 Nov 2014 | $1,360 | $900,000 | 9.5 | 4.4 |
2. One Amber
One Amber is a freehold, 562-unit condo in Marine Parade, close to the Katong area. What’s interesting is the strong gains it is showing, despite the absurdly competitive surroundings; and also being in the shadow of Amber Park, a condo name that dominates this part of Marine Parade.
Dating back to 2010, One Amber will benefit immensely from the completion of the TEL line. Amber Park MRT station (TEL) is now within walking distance – which allows residents to get to the main centre of amenities (i.e., the area around Parkway Parade and i12 Katong) with just one quick train ride.
The area including Parkway Parade and i12 Katong is the lifestyle stretch of East Coast Road; it’s replete with supermarkets, restaurants, enrichment centres, and other family needs. This is also a long-established expatriate enclave, so One Amber can appeal to both families and landlords.
It is worth noting that there is quite a bit of competition in this area. Amber Park, along with Amber Skye, King’s Mansion, and The Esta are just some of the closest condos, with many more nearby.
One Amber has done well nonetheless: it has 79 profitable transactions, and only one losing transaction (a single 570 sq. ft. one-bedder).
The last transaction in October 2024 was at $2,296 psf. This was for a 571 sq. ft. unit at $1.3 million. A month prior to that, a 1,453 sq .ft. unit sold for $3.255 million, or about $2,240 psf.
Transactions
| Sold on | Address | Unit area (sqft) | Sale price (S$ psf) | Bought on | Purchase price (S$ psf) | Profit (S$) | Holding Period (Years) | Annualised (%) |
| 14 Nov 2024 | 1 Amber Gardens #10-05 | 958 | $2,276 | 8 Apr 2011 | $1,409 | $830,000 | 13.6 | 3.6 |
| 25 Oct 2024 | 1 Amber Gardens #12-04 | 570 | $2,296 | 18 Jan 2019 | $1,823 | $270,000 | 5.8 | 4.1 |
| 18 Sep 2024 | 1 Amber Gardens #04-06 | 1,453 | $2,240 | 17 Aug 2016 | $1,239 | $1,455,000 | 8.1 | 7.6 |
| 16 Sep 2024 | 3 Amber Gardens #06-12 | 1,615 | $2,109 | 5 Dec 2006 | $743 | $2,205,000 | 17.8 | 6 |
| 4 Sep 2024 | 1 Amber Gardens #07-04 | 570 | $2,086 | 10 May 2010 | $1,402 | $390,000 | 14.3 | 2.8 |
| 23 Aug 2024 | 7 Amber Gardens #18-17 | 1,270 | $2,307 | 30 Jun 2016 | $1,480 | $1,050,000 | 8.2 | 5.6 |
| 5 Jun 2024 | 3 Amber Gardens #19-09 | 1,658 | $2,021 | 14 Jul 2006 | $757 | $2,095,000 | 17.9 | 5.6 |
| 16 May 2024 | 9 Amber Gardens #04-23 | 958 | $2,276 | 13 Oct 2016 | $1,472 | $770,000 | 7.6 | 5.9 |
| 13 May 2024 | 9 Amber Gardens #17-25 | 958 | $2,264 | 16 Aug 2010 | $1,415 | $813,450 | 13.8 | 3.5 |
| 23 Apr 2024 | 7 Amber Gardens #21-16 | 1,324 | $2,266 | 13 Jul 2015 | $1,450 | $1,080,000 | 8.8 | 5.2 |
| 11 Apr 2024 | 1 Amber Gardens #13-06 | 1,453 | $2,202 | 24 Nov 2006 | $757 | $2,108,000 | 17.4 | 6.4 |
| 27 Mar 2024 | 1 Amber Gardens #21-07 | 1,335 | $2,248 | 25 Oct 2012 | $1,497 | $1,002,000 | 11.4 | 3.6 |
| 15 Mar 2024 | 3 Amber Gardens #05-13 | 1,302 | $2,211 | 22 Oct 2010 | $1,190 | $1,330,000 | 13.4 | 4.7 |
3. The Tessarina
The Tessarina is a freehold, 443-unit project that dates back to 2003. Quite emblematic of Bukit Timah condos, its main appeal is low-density surroundings. The surroundings are landed properties, with a good degree of seclusion and privacy. There are also low-rise commercial units nearby – toward the direction of Bukit Timah Road – that provide an eclectic mix of eateries, wine bars, and clinics.
The reasons for its strong showing are probably similar to Blossomvale above. That said, it is an older condo that has strong options in its vicinity. Maple Woods, for example, is closer to King Albert Park MRT (DTL, CRL), and KAP Residences is integrated with the train station (plus has a cinema and restaurants). Perhaps buyers are willing to overlook the poorer accessibility just on account of the greater privacy. As the saying goes, it’s a feature, not a bug.
The Tessarina has a good track record of 69 profitable transactions, with just one loss ever recorded. We’d also say the loss is trivial; a 3,197 sq. ft. unit transacted in 2020, with a loss of just $50,000.
The last transactions in October (two units) set the average to $2,309 psf. The was for two units that were 1,367 and 1,313 sq. ft. respectively; both saw a quantum of $3 million. This is quite good for an older condo, and Bukit Timah continues to draw lower-density loving buyers.
Transactions
| Sold on | Address | Unit area (sqft) | Sale price (S$ psf) | Bought on | Purchase price (S$ psf) | Profit (S$) | Holding Period (Years) | Annualised (%) |
| 23 Oct 2024 | 26 Wilby Road #03-30 | 1,367 | $2,249 | 7 Jun 2010 | $1,156 | $1,495,000 | 14.4 | 4.7 |
| 15 Oct 2024 | 26 Wilby Road #03-32 | 1,313 | $2,368 | 5 Nov 2020 | $1,736 | $830,000 | 3.9 | 8.2 |
| 27 Sep 2024 | 26 Wilby Road #06-32 | 1,313 | $2,361 | 7 Feb 2018 | $1,675 | $900,000 | 6.6 | 5.3 |
| 9 Sep 2024 | 26 Wilby Road #06-22 | 1,367 | $2,195 | 16 Nov 2006 | $746 | $1,979,999 | 17.8 | 6.2 |
| 2 Aug 2024 | 20 Wilby Road #04-04 | 1,313 | $2,361 | 24 Sep 2018 | $1,600 | $999,200 | 5.9 | 6.9 |
| 15 Jul 2024 | 22 Wilby Road #09-13 | 3,671 | $1,635 | 12 May 2015 | $1,171 | $1,700,000 | 9.2 | 3.7 |
| 2 Jul 2024 | 28 Wilby Road #04-42 | 990 | $2,222 | 30 Dec 2020 | $1,792 | $425,000 | 3.5 | 6.3 |
| 21 Jun 2024 | 26 Wilby Road #04-30 | 1,367 | $2,231 | 8 May 2008 | $1,170 | $1,450,000 | 16.1 | 4.1 |
| 12 Mar 2024 | 26 Wilby Road #08-29 | 1,335 | $2,060 | 26 Aug 2008 | $1,161 | $1,200,000 | 15.6 | 3.8 |
| 15 Feb 2024 | 26 Wilby Road #09-28 | 1,367 | $2,268 | 12 Sep 2011 | $1,388 | $1,202,000 | 12.4 | 4 |
| 19 Jan 2024 | 26 Wilby Road #03-34 | 1,324 | $2,266 | 1 Nov 2013 | $1,609 | $870,000 | 10.2 | 3.4 |
4. The Trillium
The Trillium defies a lot of expectations if you look at its attributes. This is a freehold, 231-unit condo right across the road from Great World City.
On paper, it has elements often associated with poor gains: its high quantum CCR condo which should have less room for appreciation; and its units have a circular layout, which is not well-liked by most home buyers.
Circular layouts are hard to accommodate in interior design, as most furniture is meant to fit square rooms. And whilst circular layouts do allow for panoramic views, they also have more surface area for sun exposure; a problem in our already hot climate.
Nonetheless, all of this may have been swept aside by the fundamental issue of location. With the newly revamped Great World City across the road, residents have almost any amenity they need; and the attached Great World City MRT station (TEL) also provides decent accessibility. In any case, Orchard Road itself is just a short drive from here; so it’s prestigious and convenient.
Trillium has 149 profitable transactions, and 20 unprofitable ones. But most of the losses stem from sales during the property downturn in 2016/17, and a good number were in 2009, at the time of the Global Financial Crisis.
The volume of transactions is low, which isn’t too surprising for such a high-end District 9 condo. The last transaction in September was at $2,712 psf, for a gigantic 2,389 sq. ft. project. This came to a jaw-dropping quantum of $6.48 million. A month before that, another similar-sized unit transacted for $6.2 million.
This is a unique project that defies expectations, but it’s definitely not within the grasp of the average Singaporean. Given that Singaporeans only own 32 per cent of this project, it will be interesting to see if its momentum lasts, given the ABSD rate hike on foreigners and entities.
Transactions
| Sold on | Address | Unit area (sqft) | Sale price (S$ psf) | Bought on | Purchase price (S$ psf) | Profit (S$) | Holding Period (Years) | Annualised (%) |
| 25 Sep 2024 | 112 Kim Seng Road #22-01 | 2,390 | $2,712 | 24 Sep 2021 | $2,574 | $330,000 | 3.0 | 1.8 |
| 27 Aug 2024 | 112 Kim Seng Road #25-01 | 2,390 | $2,595 | 27 Jul 2017 | $1,925 | $1,600,000 | 7.1 | 4.3 |
| 12 Aug 2024 | 112 Kim Seng Road #06-02 | 1,798 | $2,615 | 1 Jun 2007 | $1,661 | $1,714,000 | 17.2 | 2.7 |
| 2 Aug 2024 | 112 Kim Seng Road #10-02 | 1,798 | $2,587 | 11 May 2018 | $2,170 | $750,000 | 6.2 | 2.9 |
| 13 Jun 2024 | 112 Kim Seng Road #26-02 | 1,798 | $2,720 | 30 Apr 2007 | $1,993 | $1,306,888 | 17.1 | 1.8 |
| 17 May 2024 | 112 Kim Seng Road #03-03 | 1,399 | $2,358 | 12 Sep 2017 | $1,787 | $800,000 | 6.7 | 4.2 |
| 20 Mar 2024 | 116 Kim Seng Road #10-07 | 1,399 | $2,578 | 20 Apr 2007 | $1,596 | $1,374,000 | 16.9 | 2.9 |
| 6 Feb 2024 | 116 Kim Seng Road #05-05 | 2,217 | $2,458 | 9 May 2014 | $2,029 | $950,000 | 9.8 | 2 |
5. The Sixth Avenue Residences
Sixth Avenue Residences is a small (175 units only) freehold project, dating back to 2009. The strong gains here are quite surprising, given that the newer Fourth Avenue Residences is closer to the MRT station, and should have more up-to-date facilities.
This project is, as the name implies, quite deep in the landed enclave of Sixth Avenue. This is as residential as you can get: almost nothing beyond rows and rows of landed houses. But a closer look reveals it’s more convenient than many similarly located projects: a side gate provides access to a nearby Cold Storage (Guthrie House), and quite a number of cafes and restaurants nearby. And whilst Fourth Avenue Residences is closer to the MRT station, you can still walk to Sixth Avenue MRT station (DTL) from here.
A closer look at the facilities also shows why it is attractive: despite having just 175 units, this project has a tennis court and two 50-metre pools. It has a good range of facilities and able to keep up with the newer Fourth Avenue Residences.
In terms of performance, there have been 182 profitable transactions here, with just 14 losses; about half of those were during the financial crisis in 2009.
The price movement is bound to be more volatile, given the low unit count and transaction volume. But the very latest transaction was at $2,175 psf. This was for a 1,356 sq. ft. unit at $2.95 million. Prior to this in October, a 1,636 sq. ft. unit transacted at $2,200 psf, or $3.6 million.
Hefty price tags, but not unexpected for a Bukit Timah property; and it is harder to find such spacious units these days.
Transactions
| Sold on | Address | Unit area (sqft) | Sale price (S$ psf) | Bought on | Purchase price (S$ psf) | Profit (S$) | Holding Period (Years) | Annualised (%) |
| 5 Nov 2024 | 168 Sixth Avenue #02-16 | 1,356 | $2,175 | 1 Nov 2021 | $1,987 | $255,000 | 3.0 | 3 |
| 11 Oct 2024 | 164 Sixth Avenue #02-10 | 1,636 | $2,200 | 28 Oct 2015 | $1,271 | $1,520,000 | 9.0 | 6.3 |
| 3 Sep 2024 | 168 Sixth Avenue #01-22 | 1,302 | $1,881 | 29 Nov 2010 | $1,497 | $500,000 | 13.8 | 1.7 |
| 15 Jul 2024 | 170 Sixth Avenue #03-27 | 969 | $2,323 | 18 Jun 2015 | $1,693 | $610,000 | 9.1 | 3.5 |
| 15 May 2024 | 172 Sixth Avenue #01-36 | 1,582 | $2,079 | 22 Feb 2018 | $1,490 | $930,888 | 6.2 | 5.5 |
| 13 Mar 2024 | 172 Sixth Avenue #04-30 | 1,356 | $2,175 | 8 Jun 2016 | $1,475 | $950,000 | 7.8 | 5.1 |
At Stacked, we like to look beyond the headlines and surface-level numbers, and focus on how things play out in the real world.
If you’d like to discuss how this applies to your own circumstances, you can reach out for a one-to-one consultation here.
And if you simply have a question or want to share a thought, feel free to write to us at stories@stackedhomes.com — we read every message.
Ryan J. Ong
A seasoned content strategist with over 17 years in the real estate and financial journalism sectors, Ryan has built a reputation for transforming complex industry jargon into accessible knowledge. With a track record of writing and editing for leading financial platforms and publications, Ryan's expertise has been recognised across various media outlets. His role as a former content editor for 99.co and a co-host for CNA 938's Open House programme underscores his commitment to providing valuable insights into the property market.Need help with a property decision?
Speak to our team →Read next from Editor's Pick

Property Advice I’m 55, Have No Income, And Own A Fully Paid HDB Flat—Can I Still Buy Another One Before Selling?
BTO Reviews February 2026 BTO Launch Review: Ultimate Guide To Choosing The Best Unit
Singapore Property News Narra Residences Sets a New Price Benchmark for Dairy Farm at $2,180 PSF — and the sales breakdown offers

Overseas Property Investing This Overlooked Property Market Could Deliver 12–20% Growth — But There’s a Catch
Latest Posts

Property Market Commentary Why Some Old HDB Flats Hold Value Longer Than Others
Overseas Property Investing What Under $200K Buys In Malaysia Today — From Freehold Apartments to Beachfront Suites

Singapore Property News When A “Common” Property Strategy Becomes A $180K Problem
