


2025 was a unique year for Singapore’s Core Central Region (CCR). Almost a quarter of the year’s new launches were located in this central region, which comprises several prime residential districts and developments that cater to affluent locals and well-heeled foreign investors.
Besides rolling out several new projects in and around the city centre, developers found renewed confidence from the strong sales of these launches despite a relatively higher $PSF. Meanwhile, prices in the resale flat market continued its climb to dizzying heights. Here’s the year in review:
The challenge for many buyers today isn't access to information.
It's interpreting that information in a way that makes sense for their finances, goals, and stage of life.
Over time, that's also why we decided to work with agents who shared the same data-driven and advisory-led approach behind our editorial, consultants who could help readers think through decisions more objectively, rather than simply push transactions.
Today, the team has worked with more than 2,000 clients across over $5B in property transactions.
Transaction volumes for private, non-landed homes (excluding Executive Condominiums)
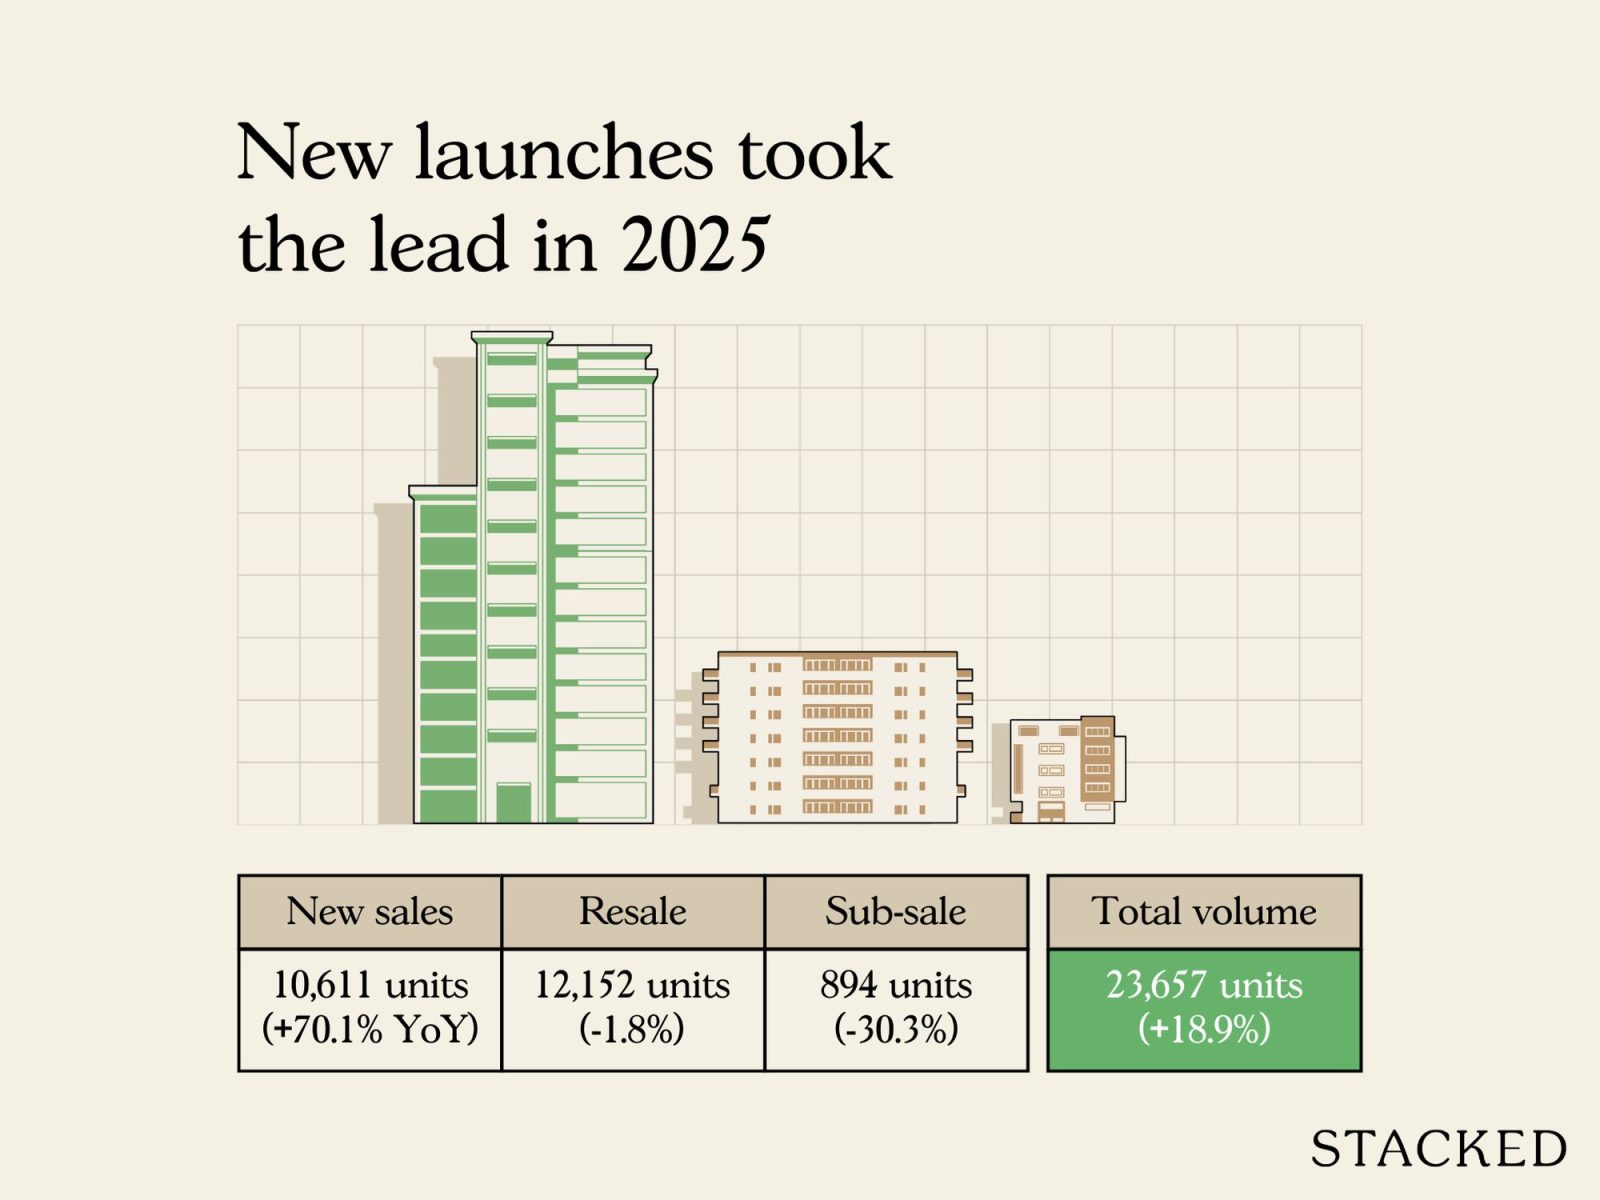
| Type of Sale | 2024 | 2025 | % Change |
| New Sale | 6,240 | 10,611 | 70.05% |
| Resale | 12,368 | 12,152 | -1.75% |
| Sub Sale | 1,282 | 894 | -30.27% |
| Total | 19,890 | 23,657 | 18.94% |
There was a significant increase in the number of new launch transactions compared to last year. It was quite the year marked with several successful launch weekends, such as Skye at Holland’s 98.8 per cent sell-out, a stunning outcome for a CCR condo which usually takes time to sell a majority of its units.
As for resale transactions, we’re seeing a continued trend from last year. Anecdotally, agents have noted that resale inventory is low, as some sellers are worried about the cost of replacement properties.
Volume by market segment (non-landed homes excluding EC)
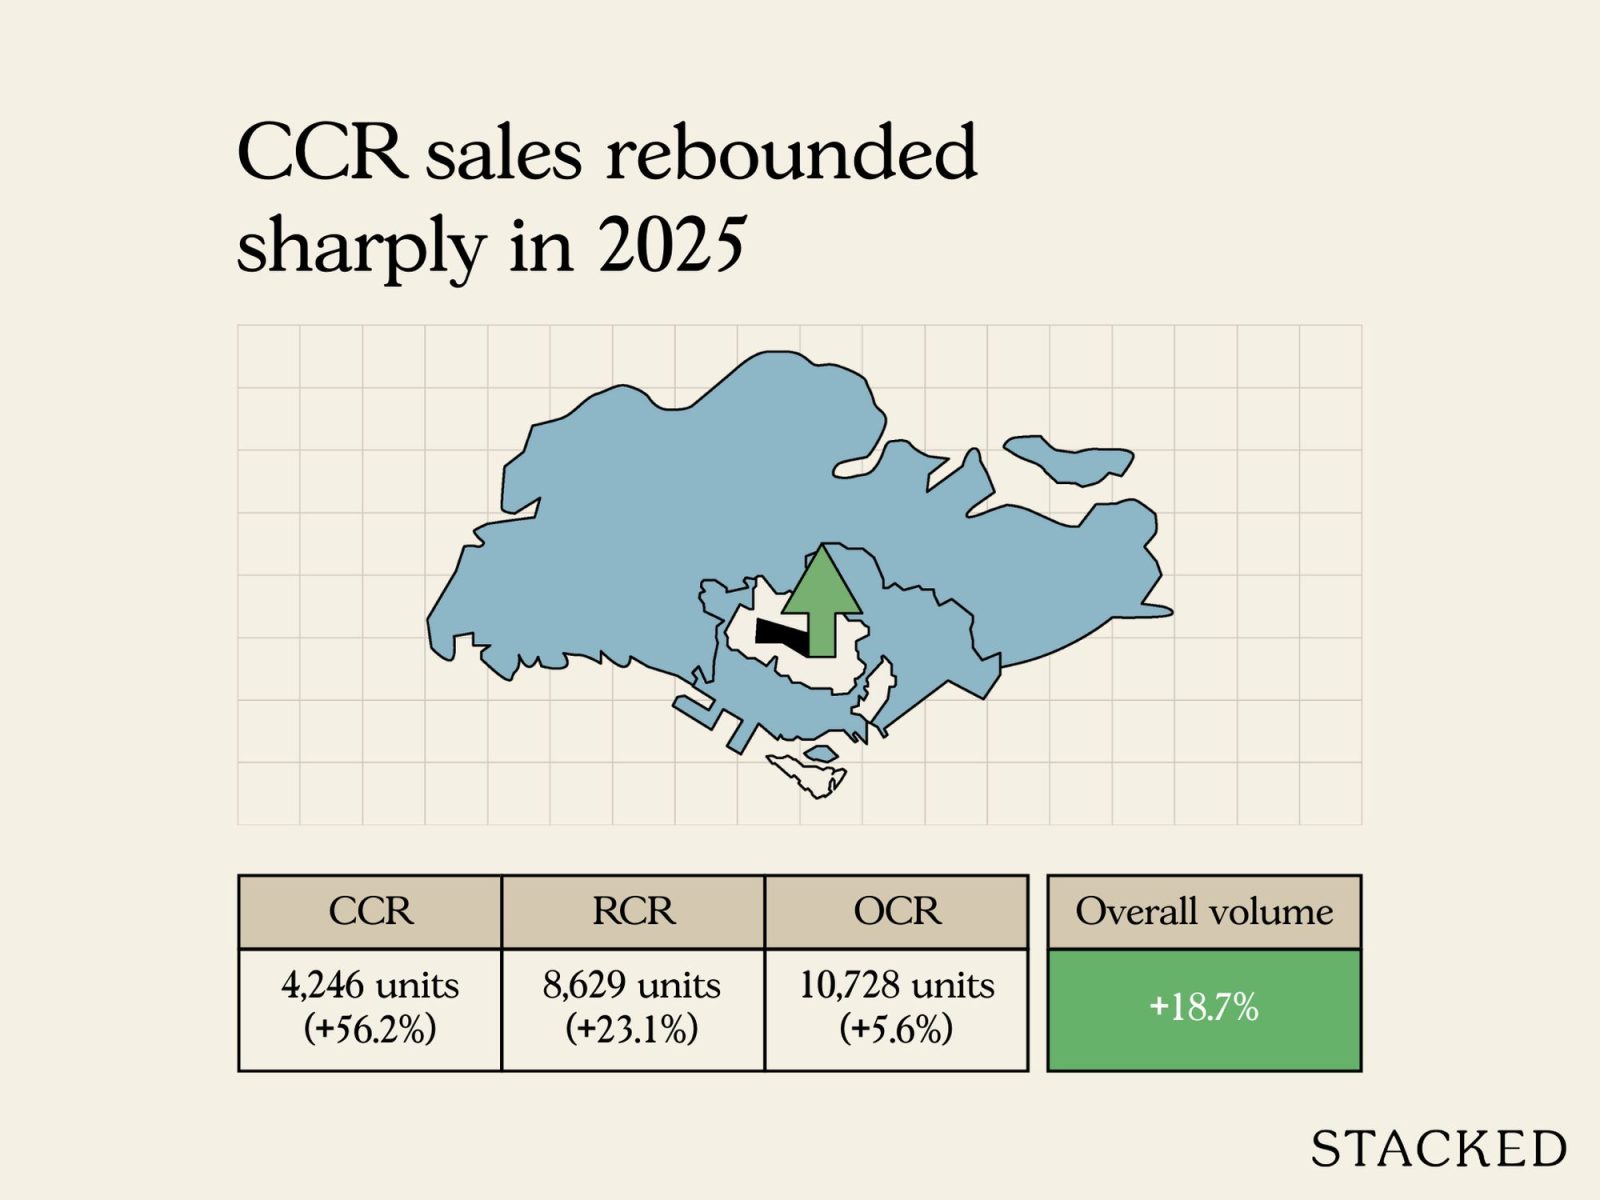
| Market Segment | 2024 | 2025 | % Change |
| CCR | 2,718 | 4,246 | 56.22% |
| OCR | 10,164 | 10,728 | 5.55% |
| RCR | 7,008 | 8,629 | 23.13% |
| Total | 19,890 | 23,603 | 18.67% |
The surge in sales volume in the CCR was due to the high number of launches there in 2025. Close to a quarter (23 per cent) of new launches in 2025 were in this region. You can read more about the reasons here. This was one of the few years when the OCR, the home of mass-market projects, actually took a backseat versus our most expensive region.
Meanwhile, the RCR also saw strong performers like Penrith (92 per cent sales and a near sell-out), and Promenade Peak (88 per cent of the units sold). While offerings in the OCR were more limited, Springleaf Residences surprised many by selling out 92 per cent, despite the relatively overlooked and underdeveloped location.
The big takeaway here is that we had a year of highly successful new launches, in spite of many of the developments being in Singapore’s most expensive region. This is mostly due to developers building smaller to keep the quantum manageable, but it seems many buyers are willing to fork out the cash for it if it means a stronger location.
Overall price movement for private non-landed homes excluding EC

| 2024 | $1,968 |
| 2025 | $2,165 |
| % Change | 10.04% |
Overall prices for private non-landed homes continued rising in 2025, with average values rising by 10.5 per cent year-on-year. However, this is on a $PSF basis rather than absolute price (quantum).
As developers are building smaller units - which tend to have a higher $PSF - it’s unsurprising that this number is increasing, and $2,100+ psf is largely a norm today even in the OCR.
Here’s how the prices moved based on region:
Price movement by region
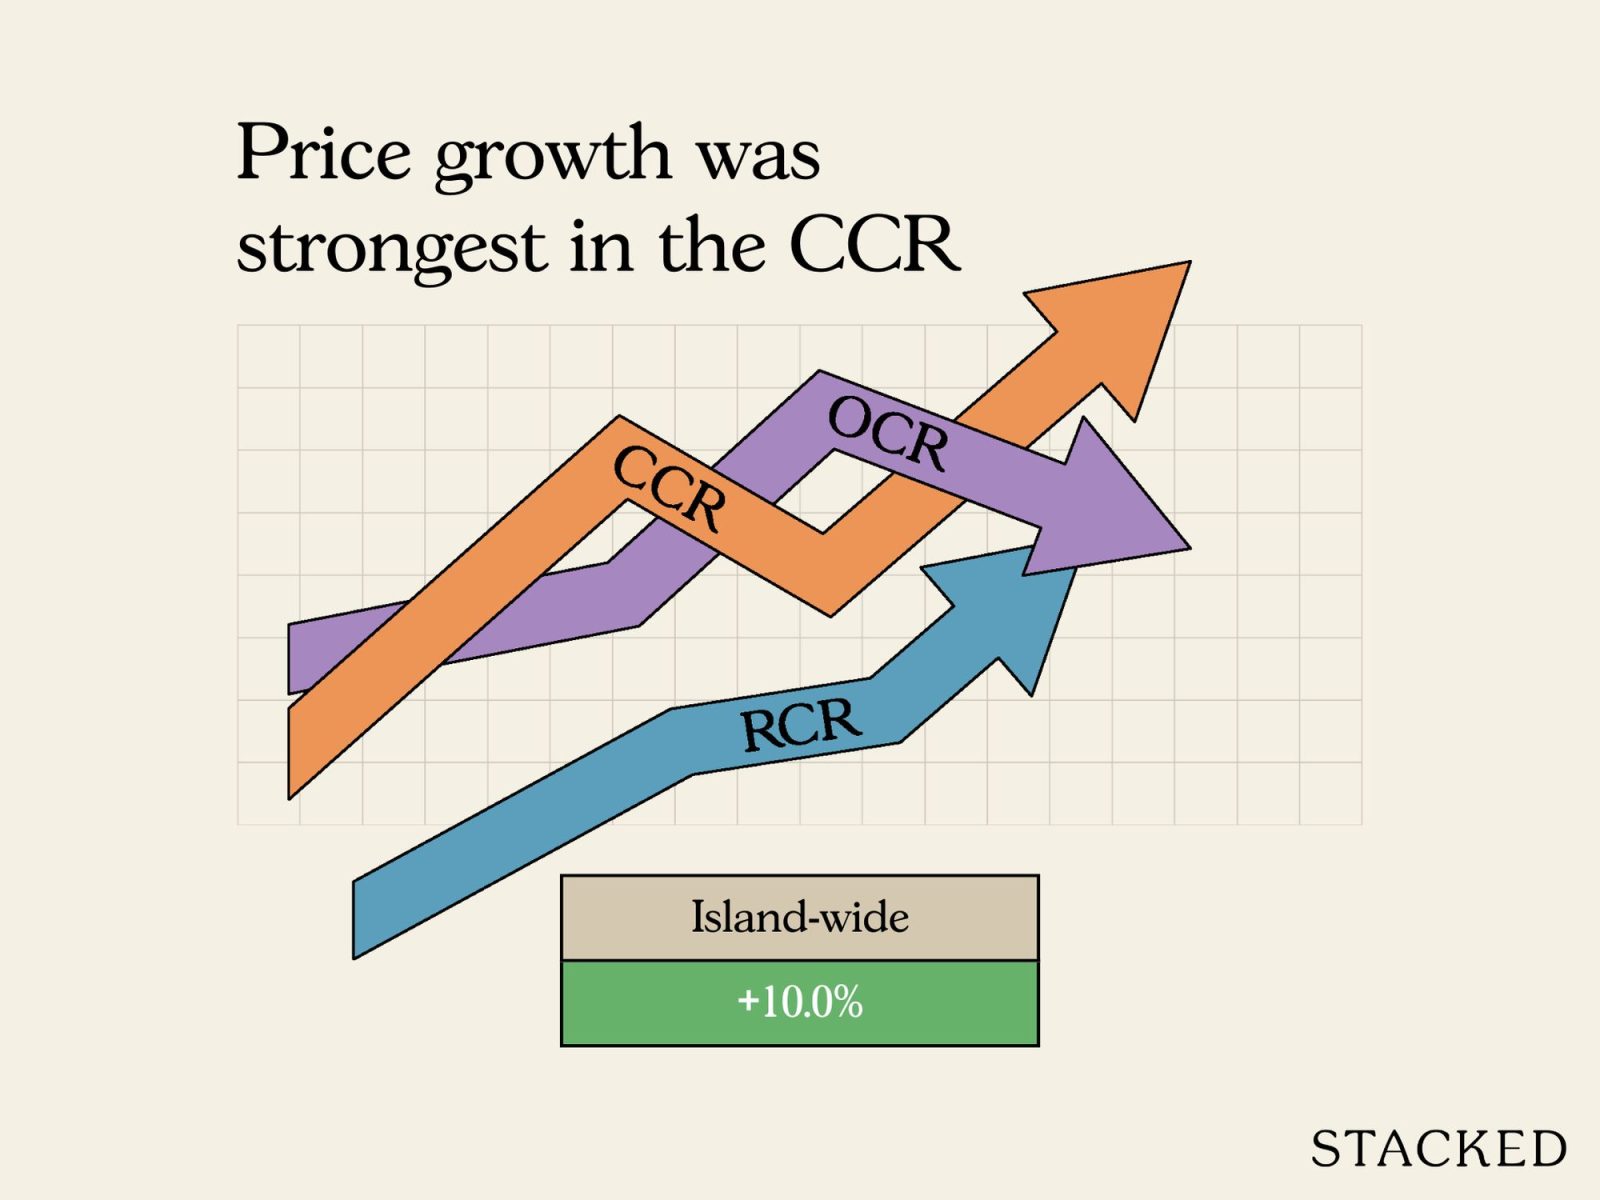
| Region | Sales volume (2024) | Average price psf (2024) | Sales volume (2025) | Average price psf (2025) | % Change in average price psf |
| Singapore | 19,890 | $1,968 | 23,559 | $2,165 | 10.04% |
| CCR | 2,718 | $2,332 | 4,246 | $2,683 | 15.07% |
| OCR | 10,164 | $1,738 | 10,728 | $1,858 | 6.92% |
| RCR | 7,008 | $2,160 | 8,629 | $2,428 | 12.42% |
The CCR bounced back from the declines it recorded in 2024. Between 2023 to 2024, the average $PSF in the CCR actually fell by 11.8 per cent. This happened due to the ABSD on foreigners being doubled to 60 per cent. But we can see that over the course of 2025, the CCR outperformed the other regions - partly because it came from a lower base in 2024, and partly because local buyers stepped in. Combined with the strong slate of new launches, this drove CCR price growth ahead of the broader market.
You might notice that the RCR, OCR, and even the Singapore-wide market posted a much stronger uptick compared to the 2023/24 period (see the link above.) Again, this is due to developers leaning into smaller unit configurations, and this kept the overall quantum low but also pushed up the average $PSF.
New launches of 2025
| Project Name | Total Number of Units in Project | Cumulative Units Sold to-date | Highest $PSF In 2025 | Lowest $PSF In 2025 | Median $PSF In 2025 | Take-Up Rate |
| 21 ANDERSON | 18 | 13 | $5,347 | $2,950 | $4,999 | 72.22% |
| AMBER HOUSE | 105 | 65 | $3,170 | $2,890 | $3,019 | 61.90% |
| ARINA EAST RESIDENCES | 107 | 24 | $3,241 | $2,561 | $2,941 | 22.43% |
| ARTISAN 8 | 34 | 19 | $2,657 | $2,105 | $2,394 | 55.88% |
| AUREA | 168 | 39 | $3,691 | $2,725 | $2,885 | 23.21% |
| BAGNALL HAUS | 113 | 101 | $2,769 | $2,325 | $2,500 | 89.38% |
| BLOOMSBURY RESIDENCES | 358 | 237 | $2,716 | $2,348 | $2,498 | 66.20% |
| CANBERRA CRESCENT RESIDENCES | 376 | 292 | $2,151 | $1,851 | $1,994 | 77.66% |
| ELTA | 501 | 356 | $2,881 | $2,200 | $2,546 | 71.06% |
| FABER RESIDENCE | 399 | 361 | $2,298 | $1,976 | $2,149 | 90.48% |
| LENTOR CENTRAL RESIDENCES | 477 | 477 | $2,586 | $1,914 | $2,214 | 100.00% |
| LYNDENWOODS | 343 | 341 | $2,700 | $2,192 | $2,464 | 99.42% |
| ONE MARINA GARDENS | 937 | 554 | $3,310 | $2,770 | $2,952 | 59.12% |
| PARKTOWN RESIDENCE | 1,193 | 1,115 | $2,605 | $2,146 | $2,363 | 93.46% |
| PENRITH | 462 | 448 | $3,087 | $2,347 | $2,793 | 96.97% |
| PROMENADE PEAK | 516 | 383 | $3,535 | $2,679 | $2,926 | 74.22% |
| RIVER GREEN | 524 | 481 | $3,591 | $2,759 | $3,125 | 91.79% |
| SKYE AT HOLLAND | 666 | 662 | $3,308 | $2,598 | $2,949 | 99.40% |
| SPRINGLEAF RESIDENCE | 941 | 904 | $2,400 | $2,004 | $2,168 | 96.07% |
| THE ORIE | 777 | 734 | $3,064 | $2,395 | $2,723 | 94.47% |
| THE ROBERTSON OPUS | 348 | 194 | $3,633 | $3,132 | $3,360 | 55.75% |
| THE SEN | 347 | 77 | $2,586 | $2,198 | $2,339 | 22.19% |
| UPPERHOUSE AT ORCHARD BOULEVARD | 301 | 217 | $3,833 | $2,945 | $3,286 | 72.09% |
| W RESIDENCES MARINA VIEW - SINGAPORE | 683 | 5 | $4,256 | $3,302 | $3,352 | 0.73% |
| ZYON GRAND | 706 | 608 | $3,907 | $2,678 | $3,039 | 86.12% |
A general trend in 2025 is that projects which kept their quantum in check - usually through smaller but more efficient layouts - were often the quickest to sell.
Even though many of these units were smaller, developments like Skye at Holland and River Green offered something that had long been out of reach for many Singaporeans: a realistic entry to prime neighbourhoods such as Holland Village and the Great World area. So they tended to see exceptionally quick sales, despite trading off spaciousness.
According to agents, a key concern in 2025 was keeping the quantum within the $1.8 million to $2 million range. Anything beyond this was a stretch for most HDB upgraders, which were the biggest buyer demographic.
We’ll see this in the breakdown of the top-selling projects:
Top selling projects for 2025
| Project Name | Sold In 2025 | Median $PSF In 2025 | Median Price In 2023 |
| PARKTOWN RESIDENCE | 1,115 | $2,363 | $1,825,000 |
| SPRINGLEAF RESIDENCE | 904 | $2,168 | $1,760,500 |
| THE ORIE | 734 | $2,723 | $2,190,000 |
| SKYE AT HOLLAND | 662 | $2,949 | $2,277,500 |
| ZYON GRAND | 608 | $3,039 | $2,499,000 |
Top selling CCR projects
| Project Name | Sold In 2025 | Median $PSF In 2025 | Median Price In 2023 |
| SKYE AT HOLLAND | 662 | $2,949 | $2,277,500 |
| RIVER GREEN | 481 | $3,125 | $1,857,000 |
| UPPERHOUSE AT ORCHARD BOULEVARD | 217 | $3,286 | $2,411,000 |
| THE ROBERTSON OPUS | 194 | $3,360 | $2,605,000 |
| ONE BERNAM | 102 | $2,523 | $1,998,500 |
Top selling RCR projects
| Project Name | Sold In 2025 | Median $PSF In 2025 | Median Price In 2023 |
| THE ORIE | 734 | $2,723 | $2,190,000 |
| ZYON GRAND | 608 | $3,039 | $2,499,000 |
| ONE MARINA GARDENS | 554 | $2,952 | $1,939,363 |
| PENRITH | 448 | $2,793 | $2,316,000 |
| PROMENADE PEAK | 383 | $2,926 | $2,048,000 |
Top selling OCR projects
| Project Name | Sold In 2025 | Median $PSF In 2025 | Median Price In 2023 |
| PARKTOWN RESIDENCE | 1,115 | $2,363 | $1,825,000 |
| SPRINGLEAF RESIDENCE | 904 | $2,168 | $1,760,500 |
| LENTOR CENTRAL RESIDENCES | 477 | $2,214 | $1,835,000 |
| FABER RESIDENCE | 361 | $2,149 | $1,821,000 |
| ELTA | 356 | $2,546 | $1,946,000 |
Resale project performance
An ongoing concern among agents is the limited resale inventory. Sellers are still concerned about the cost of getting a replacement property.
Of particular concern are older freehold units in the CCR since many of these were built in a different era, for less price-sensitive buyers. Today, however, the typical buyer profile has shifted. With more buyers being locals upgrading from the RCR (read: not a rich foreign investor), the high absolute quantum can make these units tougher to move.
Top 5 resale performers
| Project | Sale Date | Transacted price | Quantum Gains | % Gain | Holding Period (Years) |
| BOTANIC GARDENS MANSION | 08/01/2025 | $3,700,000 | $2,970,000 | 407% | 26 |
| MIMOSA PARK | 17/07/2025 | $2,500,000 | $1,980,000 | 381% | 20 |
| LAKEPOINT CONDOMINIUM | 07/07/2025 | $1,650,000 | $1,300,000 | 371% | 19.2 |
| MANDARIN GARDENS | 11/02/2025 | $4,880,000 | $3,830,000 | 365% | 21.6 |
| HORIZON TOWERS | 15/08/2025 | $6,600,000 | $5,100,000 | 340% | 21.5 |
Bottom 5 resale performers
| Project | Sale Date | Transacted price | Quantum Loss | % Loss | Holding Period (Years) |
| TURQUOISE | 26/06/2025 | $3,500,000 | -$3,129,280 | -47% | 17.7 |
| TURQUOISE | 08/09/2025 | $3,298,000 | -$2,925,490 | -47% | 17.9 |
| TURQUOISE | 05/08/2025 | $3,100,000 | -$2,357,270 | -43% | 17.8 |
| MARINA COLLECTION | 04/07/2025 | $4,950,000 | -$3,675,000 | -43% | 17.5 |
| CLIVEDEN AT GRANGE | 06/01/2025 | $4,800,000 | -$3,056,100 | -39% | 17.4 |
The top-performing resale units all had long holding periods of around two decades, sometimes more. As such, the top transactions are mainly just benefitting from long-term appreciation.
The bottom performers are dominated by Turquoise, and the main issue seems to be a very high entry price. However, Turquoise, the Marina Collection, and Cliveden at Grange are intended less as investments, and more as homebuyer indulgences anyway.
The rental situation in 2025
Volume of rental contracts - excluding ECs
| Market segment | 2024 | 2025 | % Change |
| CCR | 25,723 | 24,953 | -2.99% |
| OCR | 33,939 | 31,681 | -6.65% |
| RCR | 28,900 | 27,885 | -3.51% |
| Total | 88,562 | 84,519 | -4.57% |
Rental prices
| Market segment | 2024 (Median price psf) | 2025 (Median price psf) | % Change |
| CCR | $5.52 | $5.68 | 2.90% |
| OCR | $4.22 | $4.30 | 1.90% |
| RCR | $5.19 | $5.36 | 3.28% |
| Total | $4.87 | $4.99 | 2.46% |
The uptick in rental rates is coming from a low base, as the rental market softened in 2024. The number of leases signed continued to dip from last year but that isn’t always representative (it may be that fewer leases were signed because previously, tenants signed longer leases.)
Overall, what we saw this year was a continuation of the post-Covid-19 recovery. There was a sharp spike in rentals back in 2022 because foreign workers returned to Singapore; and the numbers then tapered off in 2023 and 2024. As of end-2025, the slight uptick shows a stabilisation of the market and a return to normalcy.
Notably, there was speculation that high ABSD rates on foreigners would drive many to rent instead of buy, but we haven’t yet seen any strong surge in rental rates or prices.
Top rental yield projects in 2025 (from squarefoot)
| District | Project | Tenure | Completion | Average Price | No. of Transactions | Average Rent ($PSF PM) | No. of Rental Contracts | Rental yield |
| 21 | THE HILLFORD | 60 YRS FROM 2013 | 2016 | $1,446 | 15 | $7.28 | 80 | 6% |
| 14 | PAVILION SQUARE | FREEHOLD | 2018 | $1,526 | 5 | $7.32 | 25 | 5.80% |
| 14 | # 1 SUITES | FREEHOLD | 2016 | $1,259 | 4 | $5.68 | 21 | 5.40% |
| 14 | WING FONG COURT | FREEHOLD | 1997 | $988 | 4 | $4.27 | 10 | 5.20% |
| 5 | PARC IMPERIAL | FREEHOLD | 2010 | $1,817 | 8 | $7.57 | 86 | 5% |
Lowest rental yield projects in 2025 (from squarefoot)
| District | Project | Tenure | Completion | Average Price | No. of Transactions | Average Rent ($PSF PM) | No. of Rental Contracts | Rental yield |
| 20 | FLAME TREE PARK | FREEHOLD | 1989 | $1,820 | 6 | $2.71 | 13 | 1.80% |
| 20 | SIN MING PLAZA | FREEHOLD | 1992 | $1,664 | 6 | $2.65 | 11 | 1.90% |
| 10 | FOUR SEASONS PARK | FREEHOLD | 1994 | $3,374 | 4 | $5.32 | 36 | 1.90% |
| 10 | ARDMORE PARK | FREEHOLD | 2001 | $4,197 | 7 | $6.62 | 52 | 1.90% |
| 10 | THE DRAYCOTT | FREEHOLD | 1980 | $2,240 | 8 | $3.52 | 23 | 1.90% |
The Hillford is a project with a 60-year lease and a lower cost, so it almost always tops the chart for gross rental yield.
That aside, the results are not exceptional. As we’d expect, the higher rental yields tend to come from the lowest-priced properties, and the inverse is also true. Many of the properties above are older projects, hence their lower cost and higher gross yield.
The HDB resale market for 2025
HDB resale volume
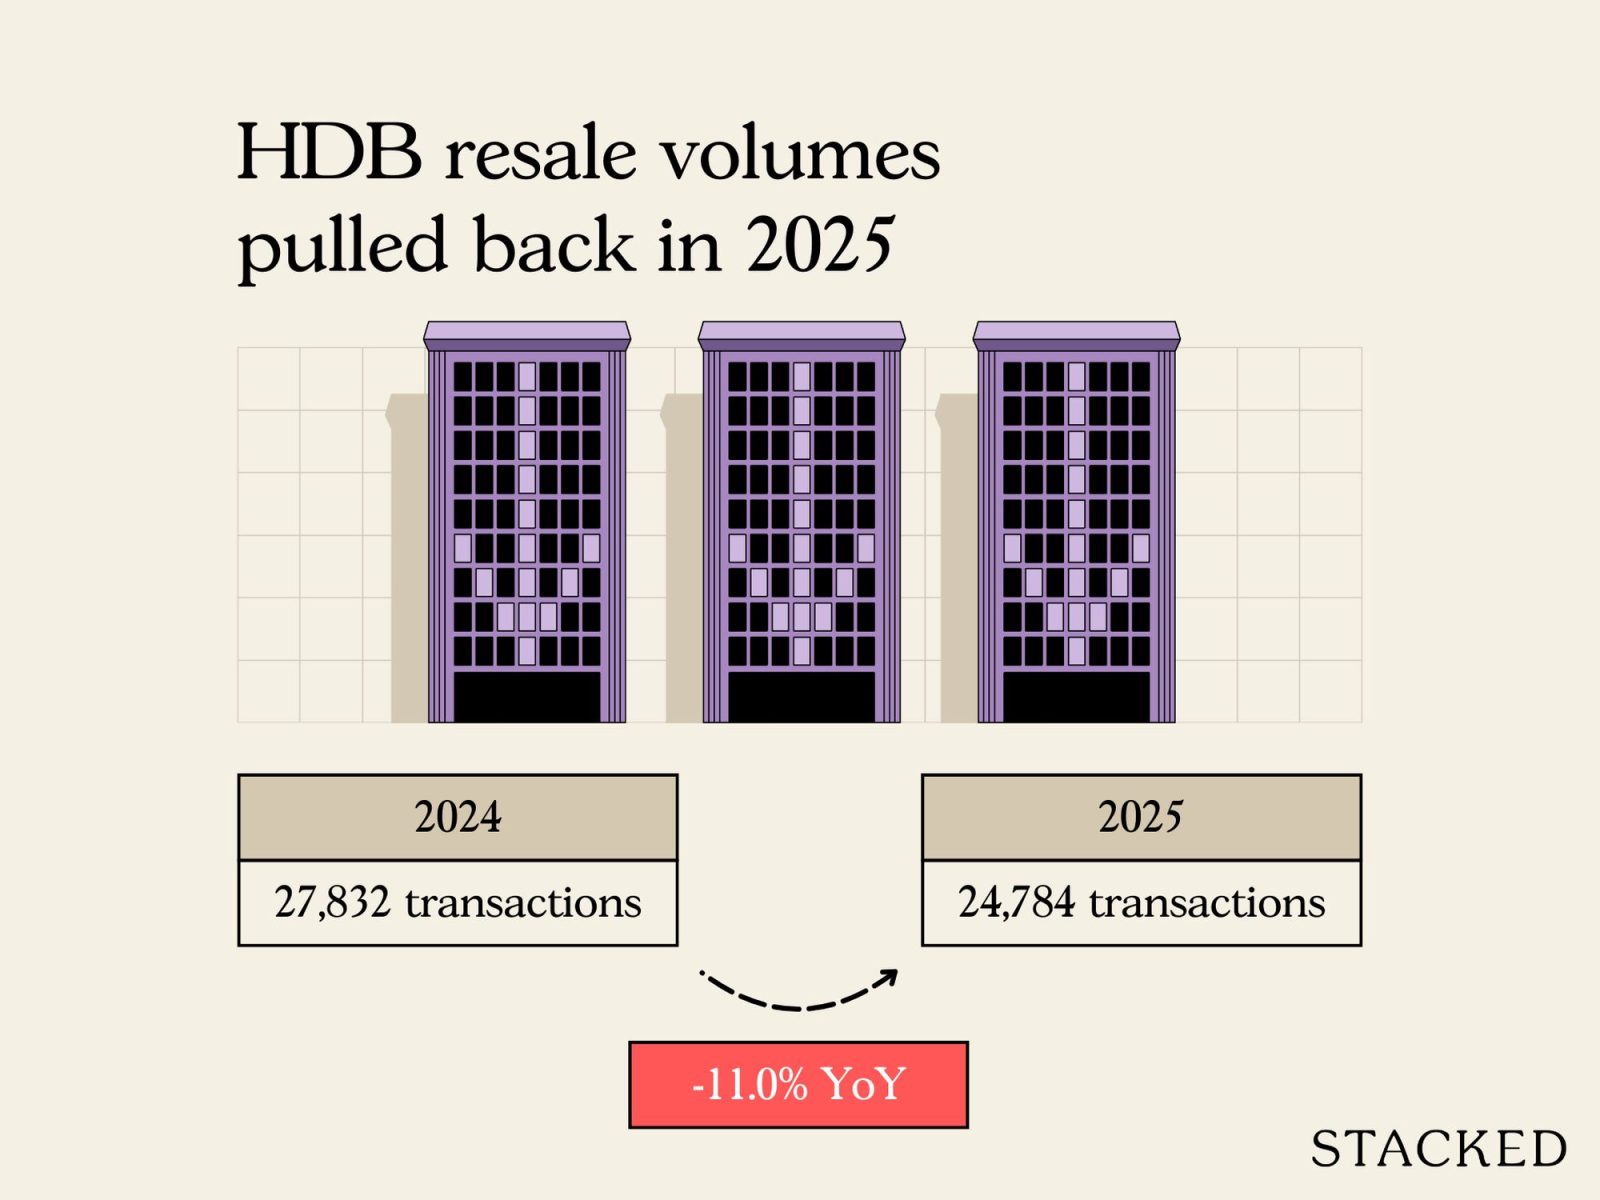
| 2024 | 27,832 |
| 2025 | 24,784 |
| % Change | -10.95% |
As we’ve mentioned earlier, resale options were more limited in 2025, and might continue to be in 2026 as well. An ongoing concern is the cost of replacement properties for HDB sellers, if they want to upgrade.
HDB price movement
| 2024 | 2025 | ||||
| Flat Type | Volume | Average price psf | Volume | Average price psf | % Change in average price psf |
| 1 ROOM | 11 | $759 | 5 | $804 | 5.85% |
| 2 ROOM | 798 | $703 | 824 | $748 | 6.32% |
| 3 ROOM | 6,793 | $601 | 6,078 | $642 | 6.85% |
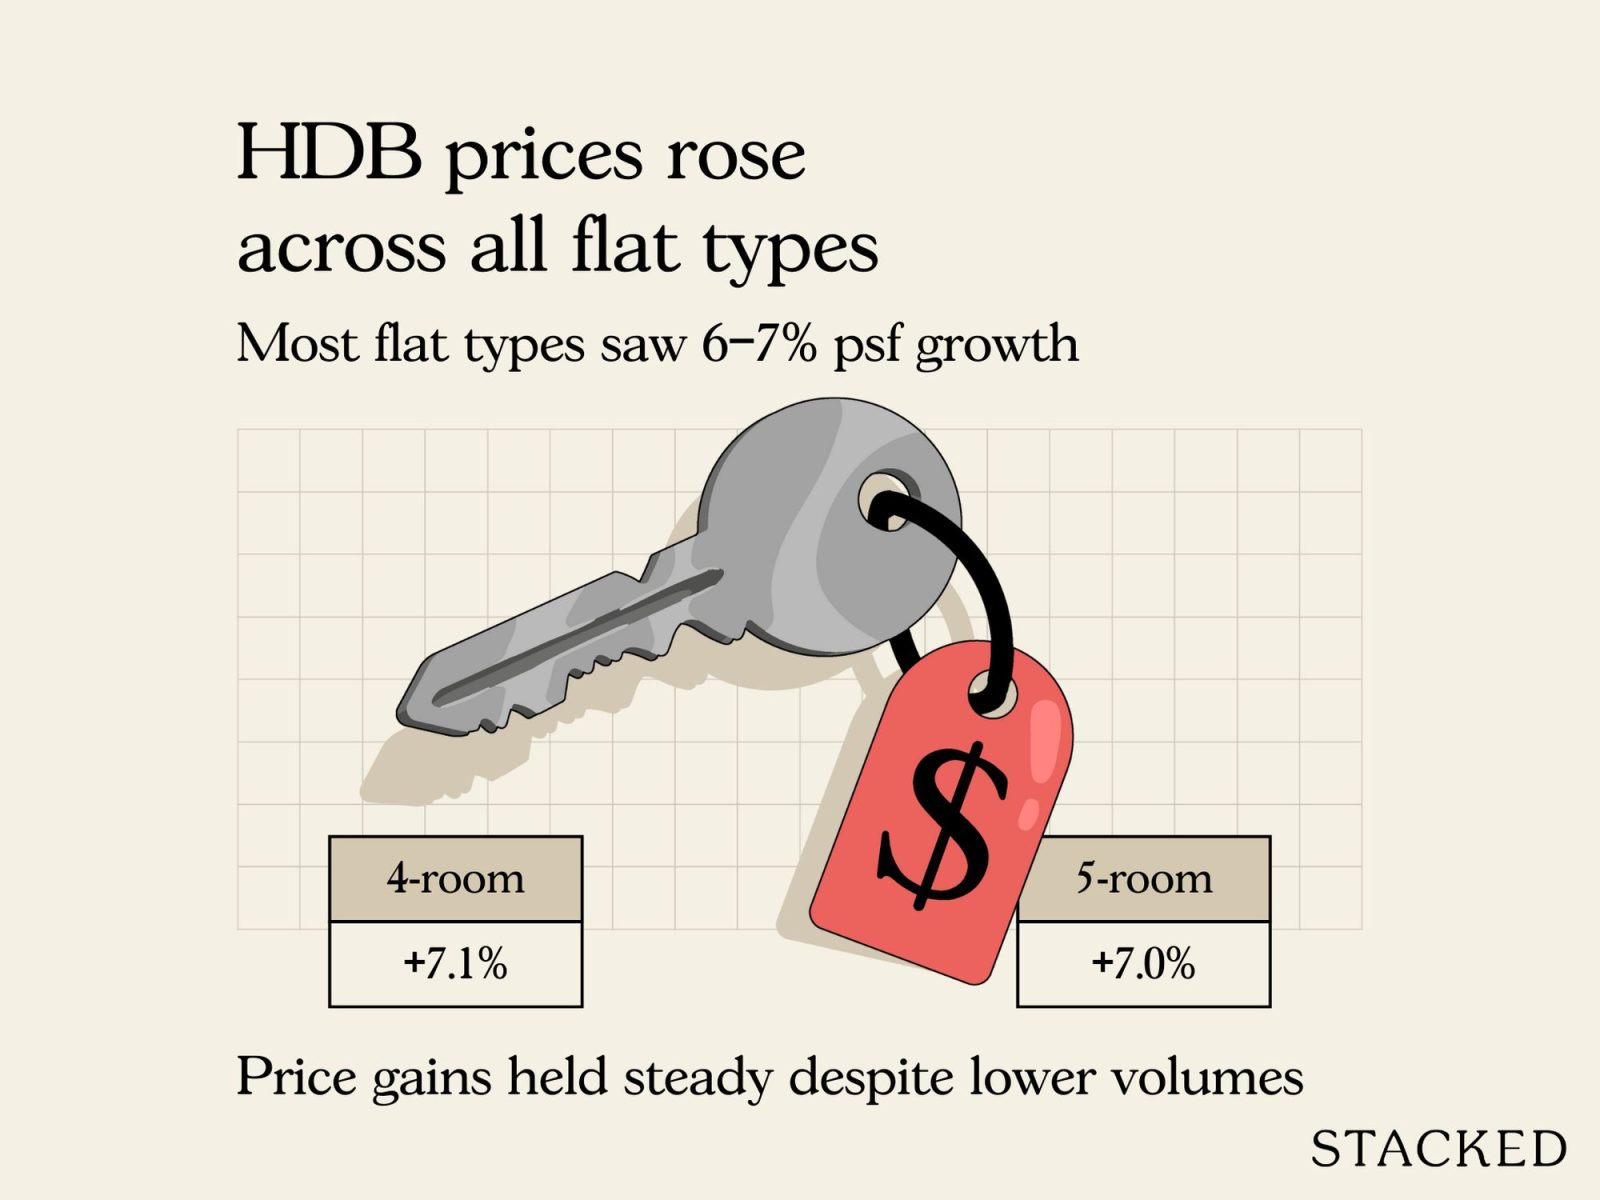
| 4 ROOM | 11,988 | $618 | 10,717 | $662 | 7.06% |
| 5 ROOM | 6,469 | $578 | 5,704 | $618 | 7.03% |
| EXECUTIVE | 1,767 | $560 | 1,452 | $593 | 5.97% |
| MULTI-GENERATION | 6 | $619 | 4 | $657 | 6.21% |
Across every flat type, prices continued to climb in 2025, with gains largely clustering between 5 and 7 per cent. Another key takeaway is that the strongest momentum continues to sit with larger flat types.
Just as we saw in last year’s report, 4- and 5-room flats once again posted the highest price increases. Given that many three-bedder or larger condos have crept outside the $1.8 million to $2 million comfort zone of HDB upgraders, we may be seeing said upgraders turn to larger resale flats as an alternative.
We do, however, expect to see a change here starting next year. This is because the end of SERS happened in 2025: there’s no more foreseeable SERS exercises for ageing flats, and hence no more “hope premium" - not even for old flats in top areas like Queenstown or Toa Payoh.
It’ll be interesting to see if this nudges resale prices down in the coming years.
New BTOs in 2025
| Estate | BTO Name | Launch Date | Est. Completion | Type | Units |
| Kallang/Whampoa | Tanjong Rhu Parc Front | February 2025 | 48 months | Prime | 812 |
| Queenstown | Stirling Horizon | February 2025 | 55 months | Plus | 1,126 |
| Woodlands | Woodlands North Verge | February 2025 | 47/48 months | Standard | 1,563 |
| Yishun | Chencharu Vines | February 2025 | 37 months | Standard | 848 |
| Yishun | Chencharu Green | February 2025 | 38 months | Standard | 683 |
| Bukit Merah | Alexandra Peaks | July 2025 | 56 months | Prime | 498 |
| Bukit Merah | Alexandra Vista | July 2025 | 47 months | Prime | 609 |
| Bukit Panjang | Bangkit Breeze | July 2025 | 35 months | Standard | 643 |
| Clementi | Clementi Emerald | July 2025 | 34 months | Prime | 753 |
| Sembawang | Sembawang Beacon | July 2025 | 36 months | Standard | 775 |
| Tampines | Simei Symphony | July 2025 | 42 months | Standard | 380 |
| Toa Payoh | Toa Payoh Ascent | July 2025 | 41 months | Prime | 741 |
| Woodlands | Woodlands North Grove | July 2025 | 55 months | Standard | 1,148 |
| Ang Mo Kio | Oak Ville @ AMK | October 2025 | 49 months | Plus | 1,425 |
| Bedok | Ping Yi Court | October 2025 | 33 months | Standard | 862 |
| Bishan | Bishan Terraces | October 2025 | 47 months | Plus | 538 |
| Bukit Merah | Berlayar Residences | October 2025 | 56 months | Prime | 880 |
| Bukit Merah | Redhill Peaks | October 2025 | 53 months | Prime | 1,021 |
| Jurong East | Teban Heights | October 2025 | 48 months | Standard | 638 |
| Sengkang | Fernvale Plains | October 2025 | 32 months | Prime | 1,037 |
| Toa Payoh | Mount Pleasant | October 2025 | 59 months | Prime | 1,348 |
| Yishun | Chencharu Grove | October 2025 | 31 months | Standard | 826 |
| Yishun | Yishun Glade | October 2025 | 31 months | Standard | 569 |
Now that the government has its tool to make mature-locations fairer (with the 10-year MOP and other eligibility restrictions of Plus and Prime), it’s less uncommon to see top areas like Toa Payoh, Bukit Merah, Clementi, and other hotspots receive new flats again.
There were only two EC launches in 2025. Due to the high prices of family-sized units in private condos, it’s not surprising that they sold out very quickly:
ECs launched in 2025
| Project | Units | Units Sold To Date | Lowest $PSF In 2025 | Highest $PSF In 2025 | Median $PSF In 2025 | Take-Up |
| AURELLE OF TAMPINES | 760 | 760 | $1,650 | $1,966 | $1,769 | 100.00% |
| OTTO PLACE | 600 | 586 | $1,621 | $1,926 | $1,754 | 97.67% |
2025 saw an interesting trend in the condo market. Rather than chasing spaciousness, buyers seemed to favour well-located homes; and they were willing to compromise on size for a more central and prestigious location.
We also saw a process of Singaporeans and Permanent Residents reclaiming the CCR; and while this is set to change in the coming year (more launches are back in the OCR for 2026), it will leave a mark: now, more than ever, there’s impetus to make districts like 9, 10, and 11 more balanced and family-oriented.
Follow us on Stacked as we track the ongoing changes, as well as what to expect in the coming year.
At Stacked, we like to look beyond the headlines and surface-level numbers, and focus on how things play out in the real world.
If you'd like to discuss how this applies to your own circumstances, you can reach out for a one-to-one consultation here.
And if you simply have a question or want to share a thought, feel free to write to us at stories@stackedhomes.com. We read every message.





0 Comments