


2024 was a year that came with several surprises toward its end. Besides the first post-GFA harmonisation condos, we also saw a record number of million-dollar resale flats hitting the $1 million mark. We even saw a particular flat reach $1.73 million, a new height for an HDB property. This year really showed how much purchasing power Singaporeans have, be it from generational wealth transfer or just an improving post-Covid economy. Here are some of the numbers in hindsight:
So many readers write in because they're unsure what to do next, and don't know who to trust.
If this sounds familiar, we offer structured 1-to-1 consultations where we walk through your finances, goals, and market options objectively.
No obligation. Just clarity.
Learn more here.
Transaction volumes for private, non-landed homes (excluding ECs)
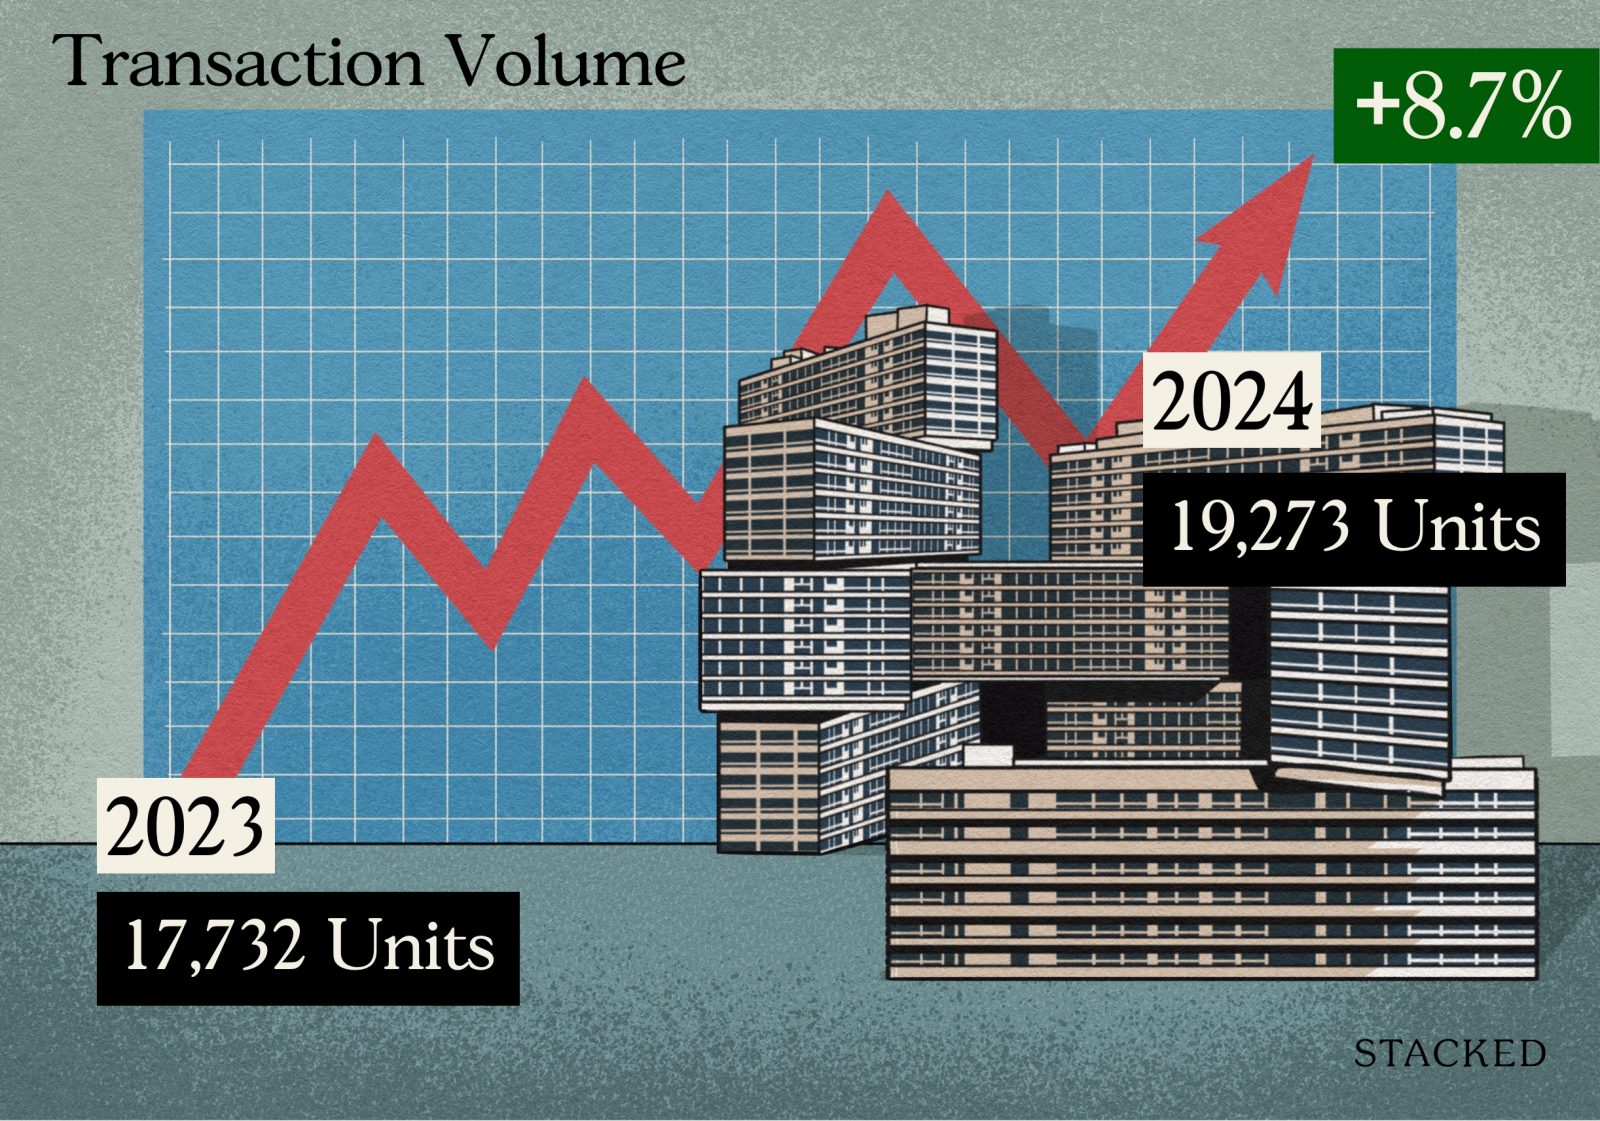
| Type of Sale | 2023 | 2024 | Change |
| New Sale | 6,244 | 6,290 | +0.7% |
| Resale | 10,233 | 11,758 | +14.9% |
| Sub Sale | 1,255 | 1,225 | -2.4% |
| Total | 17,732 | 19,273 | +8.7% |
Transaction volumes trended upward, ending the year up by 8.7 per cent from 2023.
Resale non-landed homes made up most transactions, but we saw almost no change for new launches. There was also a slight dip in the number of sub-sales.
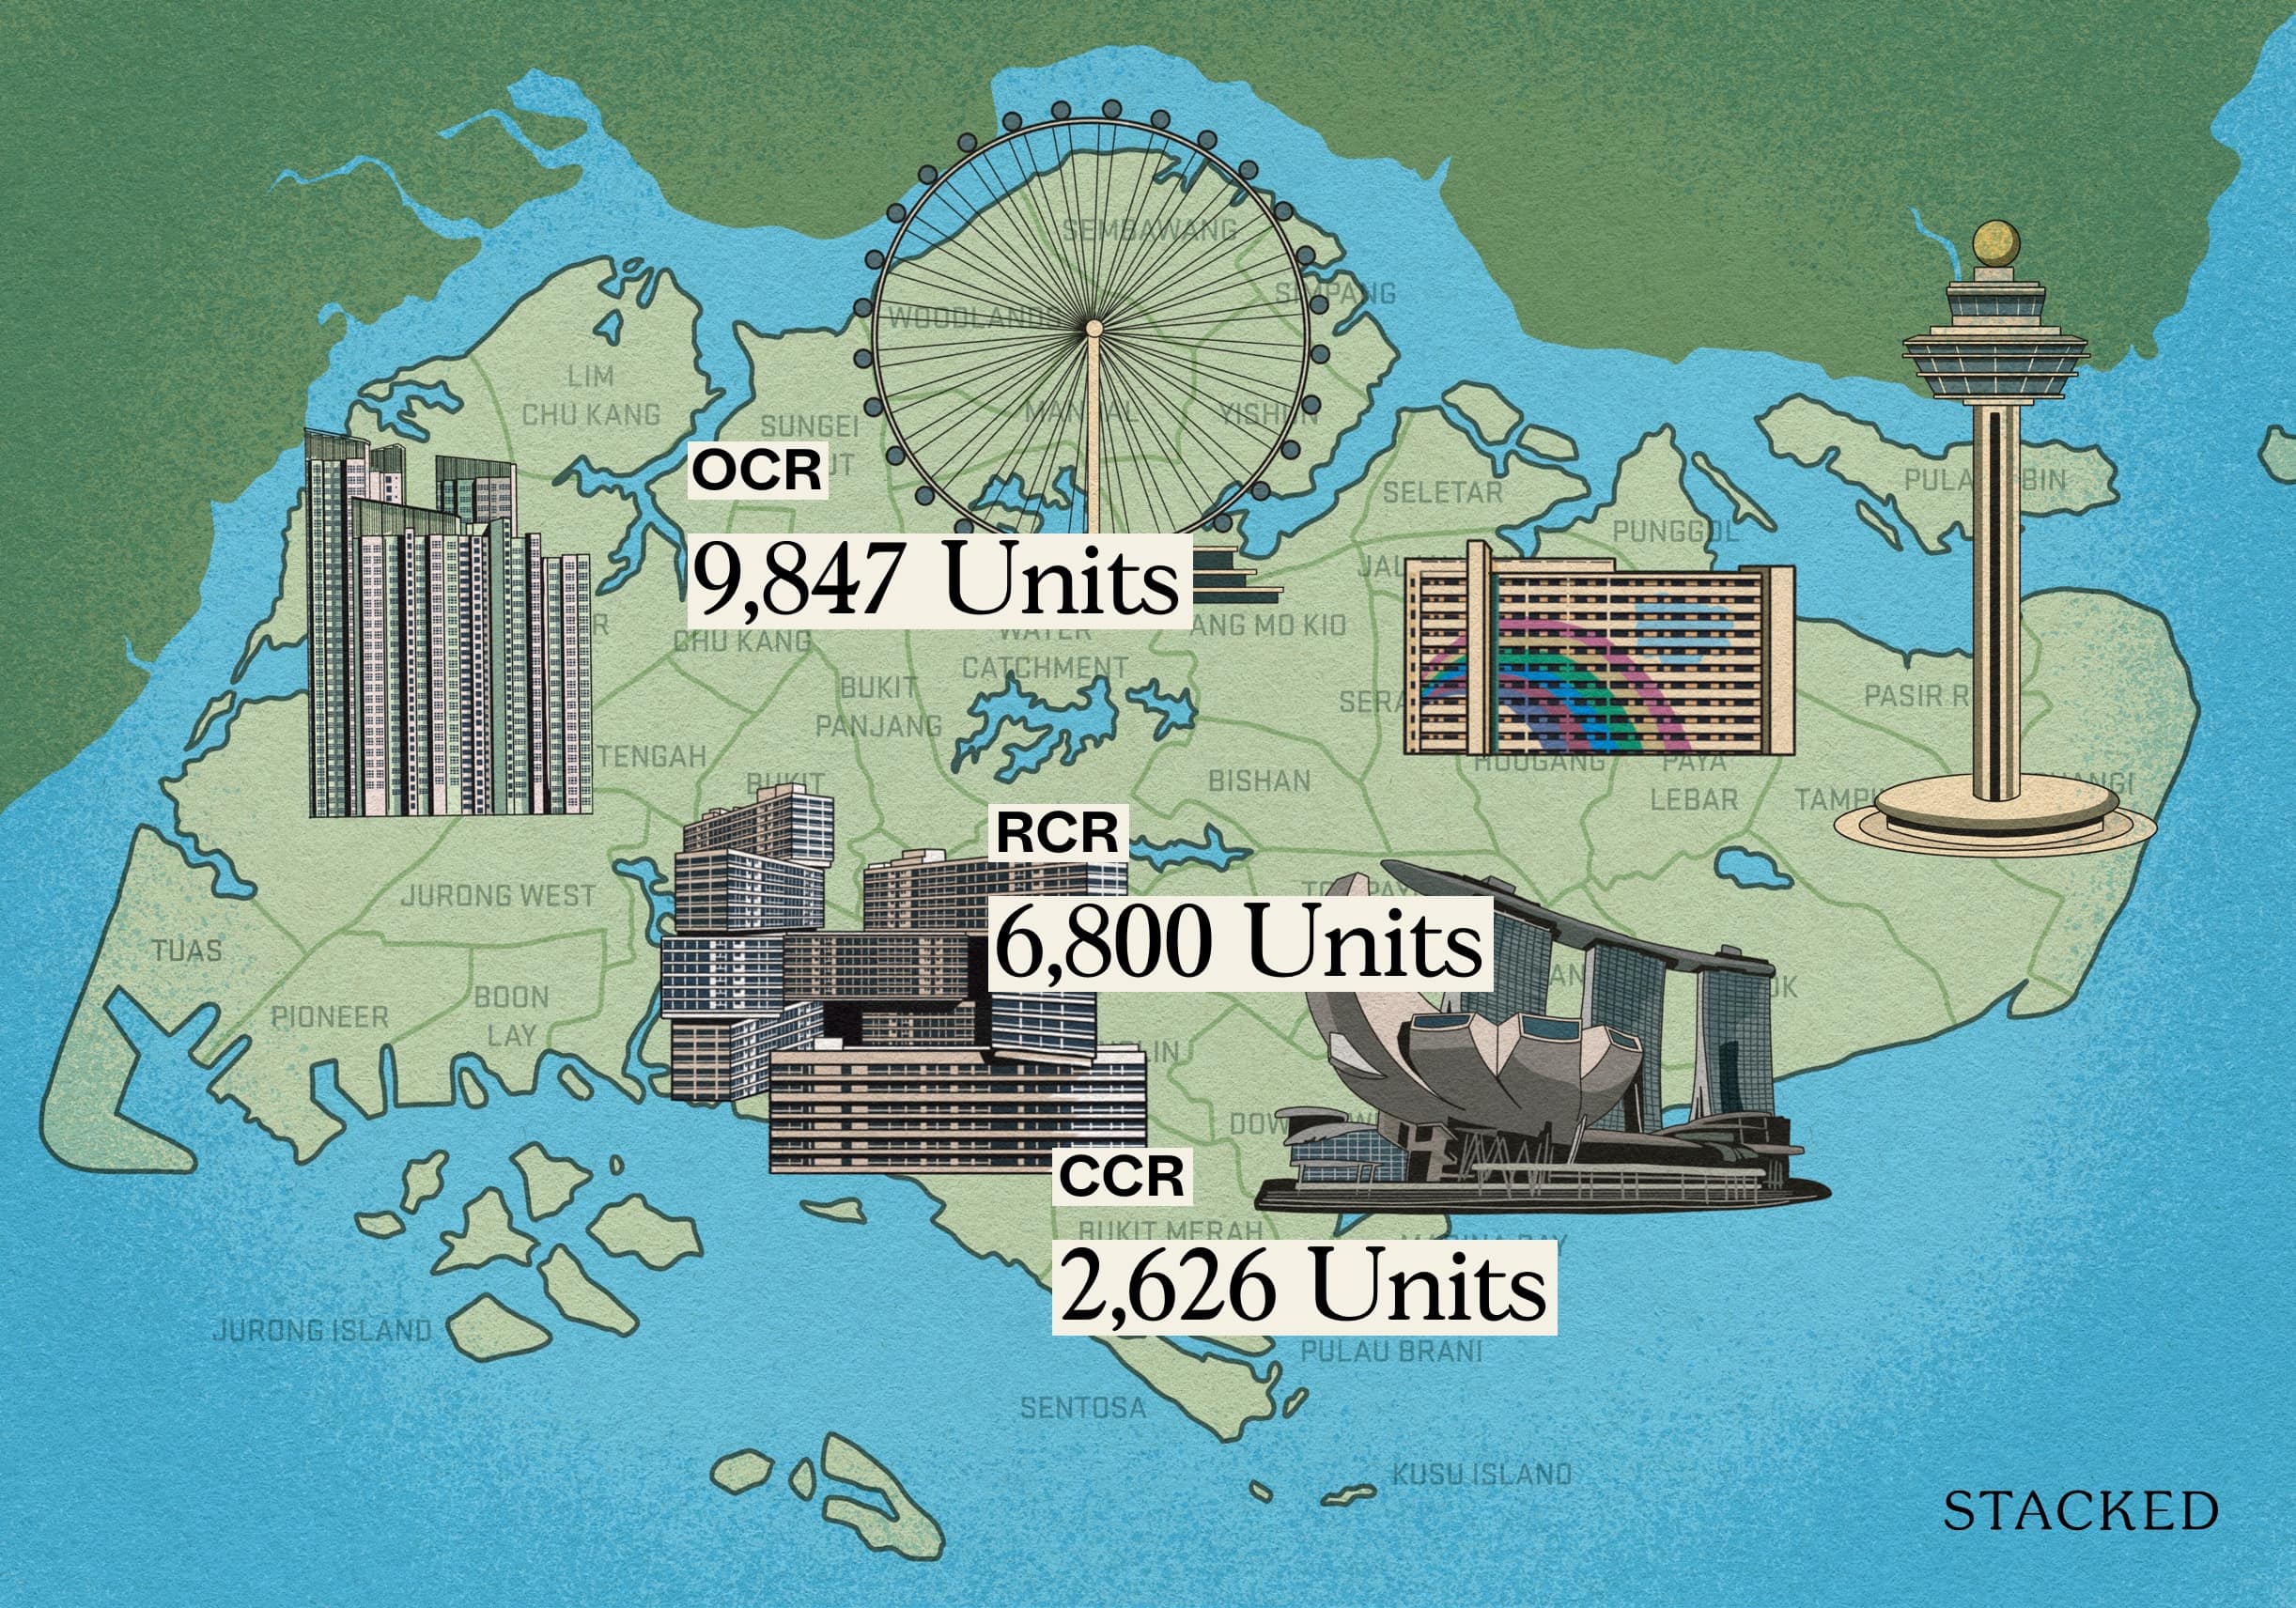
Transaction volumes for private, non-landed homes by region (excluding ECs)
| Market Segment | 2023 | 2024 | Total |
| Core Central Region | 3,304 | 2,626 | -20.5% |
| Outside Central Region | 7,769 | 9,847 | +26.7% |
| Rest of Central Region | 6,659 | 6,800 | +2.1% |
| Total | 17,732 | 19,273 | +8.7% |
Transaction volumes fell in the CCR, as expected. This is due to ABSD hikes from the previous year (2023), raising the ABSD on foreigners to 60 per cent. As foreigners make up a significant buyer demographic for prime region properties, it’s no surprise that the region bears the brunt of such cooling measures.
Transaction volumes in the RCR also saw just a small increase, likely driven up by four notable new launches in District 15: The Continuum, Tembusu Grand, Grand Dunman, and the very fast-selling Emerald of Katong (this almost sold out in just two days).
The OCR made up the bulk of private, non-landed transactions, with one notably strong mover being Chuan Park. Another strong showing in the OCR came from Norwood Grand, which moved 84 per cent of its units on launch day. This was partly due to Norwood being the first new condo launch in its vicinity in about 12 years.
Overall price movement for private non-landed homes
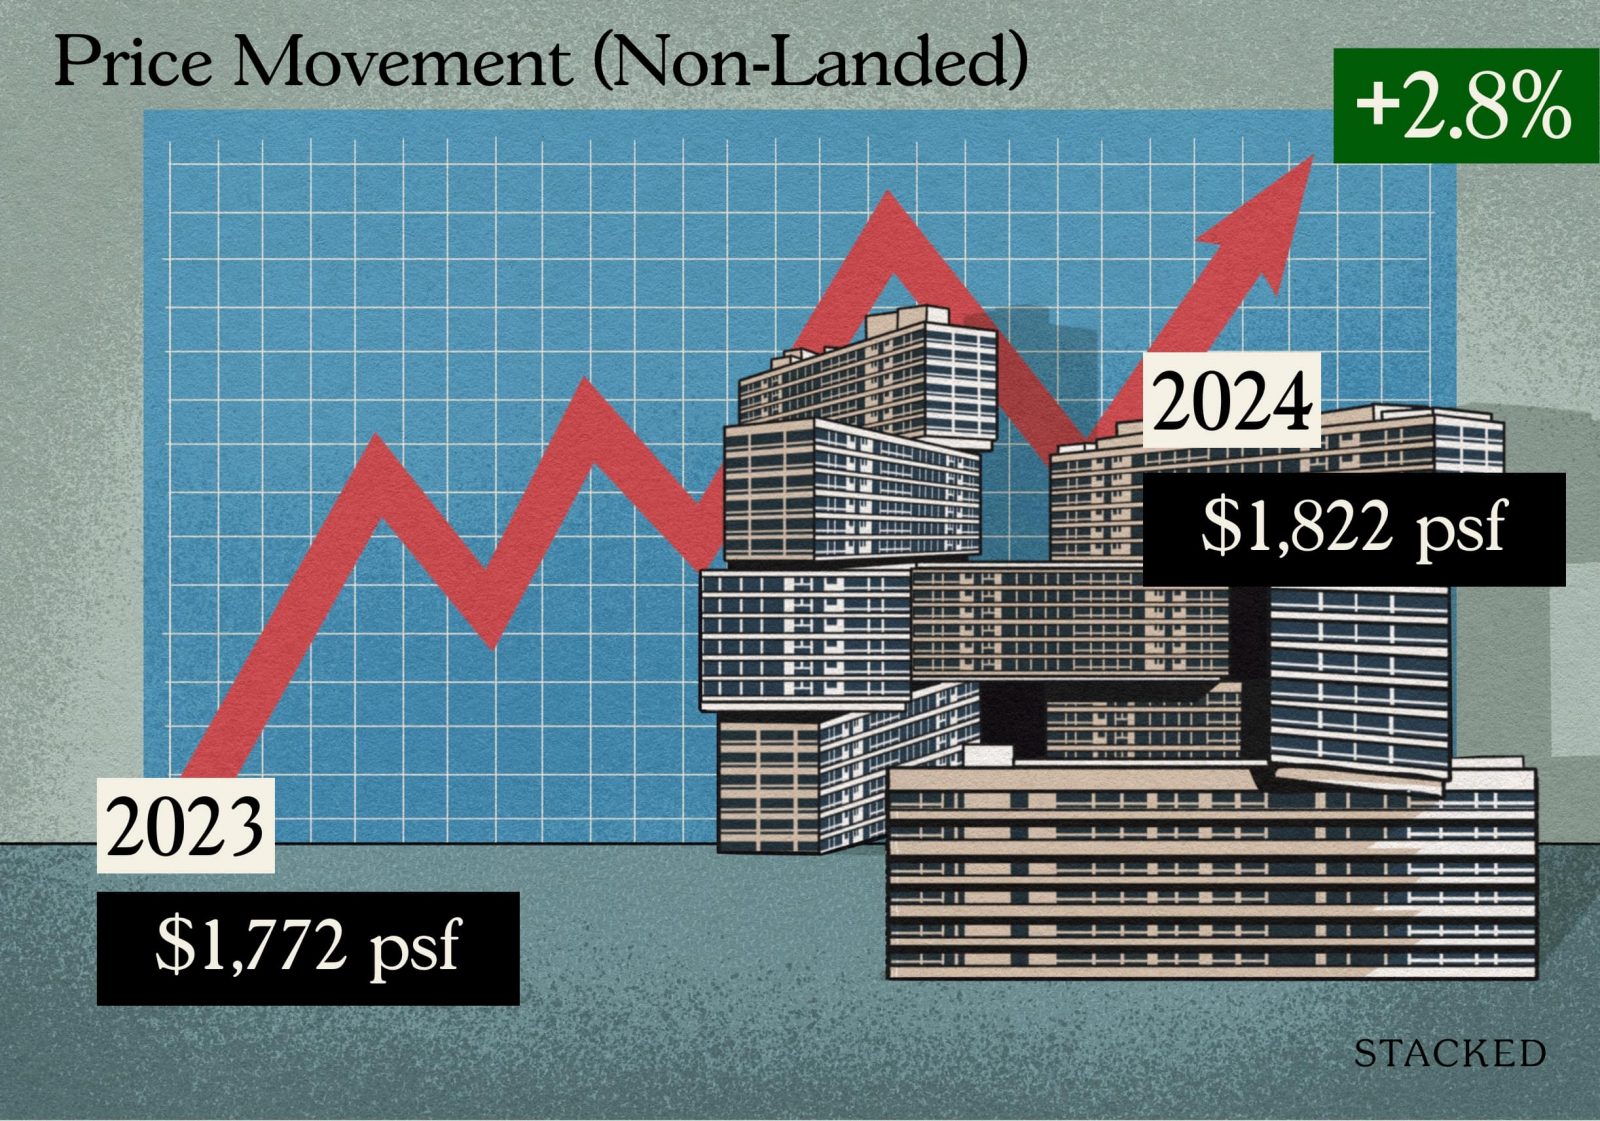
| Year | Median Unit Price ($ PSF) |
| 2023 | 1,772 |
| 2024 | 1,822 |
| Change | +2.8% |
Overall, private non-landed prices rose by 2.8 per cent from the previous year. While they’re still climbing, we can see the pace has slowed from the aftermath of Covid. Back then, between 2021 to 2022, prices rose 7.4 per cent.
Here’s how the prices moved based on region:
| Market Segment | 2023 $PSF | 2023 Volume | 2024 $PSF | 2024 Volume | Approx Gain/Loss |
| Core Central Region | $2,502 | 3,304 | $2,206 | 2,626 | -11.8% |
| Outside Central Region | $1,431 | 10,452 | $1,571 | 13,035 | +9.8% |
| Rest of Central Region | $2,168 | 6,668 | $2,213 | 6,809 | +2.1% |
| Singapore | $1,772 | 20,424 | $1,822 | 22,470 | +2.8% |
Again, we see the CCR taking the brunt of the cooling measures, with a dip of 11.8 per cent over the year. This has resulted in a narrowing price gap between the RCR and CCR, and may represent an ongoing opportunity for Singaporean buyers, or foreign buyers who pay the same tax rates as citizens (e.g., US citizens).
Prices are climbing noticeably in the OCR, though, with a rise of 9.8 per cent. HDB upgraders at the end of 2024 – and perhaps in the coming year – may be encouraged by a recent drop in home loan rates.
This is not something within our control: the US Federal Reserve tends to lower interest rates as the country’s inflation issues stabilise, which has a knock-on effect on our SORA-pegged home loans. The US is undergoing a political shift, though, and it’s uncertain how 2025 will play out. If the US engages in tariffs that ramp up its inflation, the Fed may have to raise rates again.
In any event, HDB upgraders remain the dominant buyer demographic, and their preferred area is the more affordable OCR.
New launches of 2024
| Project Name | Total Number of Units in Project | Cumulative Units Sold to-date | Highest $PSF In 2024 | Average $PSF In 2024 | Lowest $PSF In 2024 | Take-Up Rate |
| 19 NASSIM | 101 | 66 | $3,819 | $3,392 | $2,957 | 65.3% |
| 32 GILSTEAD | 14 | 9 | $3,505 | $3,455 | $3,431 | 64.3% |
| 8@BT | 158 | 84 | $3,033 | $2,748 | $2,527 | 53.2% |
| ALTURA | 360 | 353 | $1,549 | $1,491 | $1,417 | 98.1% |
| ARDOR RESIDENCE | 35 | 7 | $2,497 | $2,439 | $2,375 | 20.0% |
| ATLASSIA | 31 | 27 | $2,238 | $2,224 | $2,188 | 87.1% |
| BARTLEY VUE | 115 | 111 | $2,158 | $2,043 | $1,876 | 96.5% |
| BLOSSOMS BY THE PARK | 275 | 254 | $2,673 | $2,520 | $2,241 | 92.4% |
| CANNINGHILL PIERS | 696 | 684 | $3,567 | $2,969 | $2,802 | 98.3% |
| CHUAN PARK | 916 | 733 | $2,765 | $2,587 | $2,269 | 80.0% |
| CLAYDENCE | 28 | 6 | $2,301 | $2,292 | $2,251 | 21.4% |
| EMERALD OF KATONG | 846 | 840 | $2,967 | $2,637 | $2,387 | 99.3% |
| ENCHANTÉ | 25 | 22 | $3,246 | $2,869 | $2,735 | 88.0% |
| GEMS VILLE | 24 | 7 | $2,226 | $2,003 | $1,849 | 29.2% |
| GRAND DUNMAN | 1008 | 736 | $2,977 | $2,588 | $2,285 | 73.0% |
| GRANGE 1866 | 60 | 45 | $3,393 | $3,184 | $2,989 | 75.0% |
| HILL HOUSE | 72 | 30 | $3,378 | $3,146 | $2,963 | 41.7% |
| HILLHAVEN | 341 | 265 | $2,354 | $2,102 | $1,858 | 77.7% |
| HILLOCK GREEN | 474 | 364 | $2,555 | $2,208 | $1,764 | 76.8% |
| IKIGAI | 16 | 14 | $2,327 | $2,320 | $2,314 | 87.5% |
| IRWELL HILL RESIDENCES | 540 | 538 | $2,638 | $2,638 | $2,638 | 99.6% |
| J’DEN | 368 | 341 | $2,832 | $2,571 | $2,363 | 92.7% |
| JANSEN HOUSE | 21 | 5 | $2,121 | $2,061 | $2,023 | 23.8% |
| K SUITES | 19 | 8 | $2,443 | $2,165 | $2,052 | 42.1% |
| KASSIA | 276 | 183 | $2,225 | $2,030 | $1,821 | 66.3% |
| KLIMT CAIRNHILL | 138 | 138 | $3,863 | $3,408 | $3,162 | 100.0% |
| KOON SENG HOUSE | 17 | 6 | $2,410 | $2,322 | $2,284 | 35.3% |
| KOVAN JEWEL | 34 | 15 | $2,228 | $2,120 | $1,954 | 44.1% |
| LAVENDER RESIDENCE | 17 | 17 | $2,307 | $2,049 | $1,626 | 100.0% |
| LENTOR HILLS RESIDENCES | 598 | 591 | $2,443 | $2,146 | $1,922 | 98.8% |
| LENTOR MANSION | 533 | 498 | $2,476 | $2,271 | $2,104 | 93.4% |
| LENTOR MODERN | 605 | 604 | $2,468 | $2,250 | $1,986 | 99.8% |
| LENTORIA | 267 | 180 | $2,516 | $2,183 | $1,965 | 67.4% |
| LUMINA GRAND | 512 | 447 | $1,590 | $1,514 | $1,326 | 87.3% |
| MEYER BLUE | 226 | 132 | $3,569 | $3,243 | $2,984 | 58.4% |
| MIDTOWN BAY | 219 | 138 | $4,108 | $3,546 | $3,090 | 63.0% |
| MIDTOWN MODERN | 558 | 558 | $3,939 | $3,439 | $2,659 | 100.0% |
| MORI | 137 | 137 | $1,963 | $1,848 | $1,757 | 100.0% |
| NAVA GROVE | 552 | 386 | $2,703 | $2,452 | $2,209 | 69.9% |
| NORTH GAIA | 616 | 592 | $1,459 | $1,326 | $1,221 | 96.1% |
| NORWOOD GRAND | 348 | 292 | $2,252 | $2,080 | $1,895 | 83.9% |
| NOVO PLACE | 504 | 446 | $1,754 | $1,655 | $1,506 | 88.5% |
| ONE BERNAM | 351 | 259 | $3,351 | $2,768 | $2,289 | 73.8% |
| ORCHARD SOPHIA | 78 | 45 | $3,004 | $2,886 | $2,782 | 57.7% |
| PARC GREENWICH | 496 | 496 | $1,559 | $1,456 | $1,359 | 100.0% |
| PARQ BELLA | 20 | 17 | $2,359 | $2,325 | $2,282 | 85.0% |
| PASIR RIS 8 | 487 | 487 | $1,891 | $1,789 | $1,742 | 100.0% |
| PERFECT TEN | 230 | 230 | $3,589 | $3,476 | $3,372 | 100.0% |
| PINETREE HILL | 520 | 378 | $2,763 | $2,504 | $2,139 | 72.7% |
| POLLEN COLLECTION | 132 | 103 | $2,434 | $2,227 | $1,477 | 78.0% |
| PROVENCE RESIDENCE | 413 | 412 | $1,551 | $1,492 | $1,454 | 99.8% |
| ROYAL HALLMARK | 32 | 31 | $2,304 | $2,304 | $2,304 | 96.9% |
| SANCTUARY@NEWTON | 38 | 10 | $2,835 | $2,673 | $2,589 | 26.3% |
| SCENECA RESIDENCE | 268 | 246 | $2,200 | $2,061 | $1,829 | 91.8% |
| SKY EDEN@BEDOK | 158 | 158 | $2,190 | $2,094 | $1,929 | 100.0% |
| SKYWATERS RESIDENCES | 190 | 1 | $6,100 | $6,100 | $6,100 | 0.5% |
| SORA | 440 | 134 | $2,502 | $2,168 | $1,851 | 30.5% |
| STRAITS AT JOO CHIAT | 16 | 8 | $2,170 | $2,107 | $2,059 | 50.0% |
| TEMBUSU GRAND | 638 | 583 | $2,725 | $2,445 | $2,193 | 91.4% |
| TENET | 618 | 618 | $1,651 | $1,531 | $1,397 | 100.0% |
| TERRA HILL | 270 | 120 | $2,844 | $2,683 | $2,238 | 44.4% |
| THE ARCADY AT BOON KENG | 172 | 64 | $2,754 | $2,578 | $2,357 | 37.2% |
| THE ARDEN | 105 | 79 | $1,904 | $1,786 | $1,620 | 75.2% |
| THE BOTANY AT DAIRY FARM | 386 | 382 | $2,345 | $2,025 | $1,805 | 99.0% |
| THE CARRARA | 6 | 4 | $3,179 | $3,113 | $3,063 | 66.7% |
| THE COLLECTIVE AT ONE SOPHIA | 367 | 64 | $2,917 | $2,740 | $2,561 | 17.4% |
| THE CONTINUUM | 816 | 545 | $3,091 | $2,853 | $2,641 | 66.8% |
| THE HILL @ONE-NORTH | 142 | 55 | $2,708 | $2,582 | $2,272 | 38.7% |
| THE HILLSHORE | 59 | 3 | $2,670 | $2,592 | $2,508 | 5.1% |
| THE LAKEGARDEN RESIDENCES | 306 | 199 | $2,556 | $2,179 | $1,899 | 65.0% |
| THE LANDMARK | 396 | 396 | $3,100 | $2,805 | $2,338 | 100.0% |
| THE MYST | 408 | 308 | $2,402 | $2,123 | $1,877 | 75.5% |
| THE REEF AT KING’S DOCK | 429 | 429 | $2,777 | $2,665 | $2,462 | 100.0% |
| THE RESERVE RESIDENCES | 732 | 716 | $3,154 | $2,567 | $2,304 | 97.8% |
| THE SHOREFRONT | 23 | 7 | $1,901 | $1,897 | $1,889 | 30.4% |
| UNION SQUARE RESIDENCES | 366 | 106 | $3,752 | $3,166 | $2,856 | 29.0% |
| WATTEN HOUSE | 180 | 156 | $3,576 | $3,273 | $3,118 | 86.7% |
| ZYANYA | 34 | 28 | $2,089 | $1,996 | $1,903 | 82.4% |
One notable change for 2024 is GFA harmonisation. Some launches in 2024, such as Emerald of Katong, have their square footage measured by post-GFA harmonisation rules (see the link above). This means that certain parts of the unit, such as air-con ledges, are not counted in the total square footage. This can raise the price psf, although actual livable space – along with the overall price – is unchanged.
2024 top-selling projects in the Core Central Region (CCR)
| Project Name | Sold In 2024 | Median $PSF In 2024 | Median Price In 2024 | Tenure |
| THE COLLECTIVE AT ONE SOPHIA | 64 | $2,734 | $1,213,500 | 99 yrs from 06/12/2023 |
| 19 NASSIM | 54 | $3,386 | $3,382,140 | 99 yrs from 17/06/2019 |
| ONE BERNAM | 54 | $2,738 | $2,266,410 | 99 yrs from 10/12/2019 |
| KLIMT CAIRNHILL | 48 | $3,377 | $3,124,000 | Freehold |
| WATTEN HOUSE | 43 | $3,246 | $5,022,000 | Freehold |
2024 top-selling projects in the Rest of Central Region (RCR)
| Project Name | Number of Units | Median $PSF In 2024 | Median Price In 2024 | Tenure |
| EMERALD OF KATONG | 840 | $2,627 | $2,357,000 | 99 yrs from 07/11/2023 |
| NAVA GROVE | 386 | $2,445 | $1,965,800 | 99 yrs from 13/02/2024 |
| THE CONTINUUM | 240 | $2,869 | $2,542,000 | Freehold |
| TEMBUSU GRAND | 206 | $2,424 | $2,814,000 | 99 yrs from 25/04/2022 |
| PINETREE HILL | 195 | $2,511 | $2,079,000 | 99 yrs from 12/09/2022 |
2024 top-selling projects in the Outside of Central Region (OCR)
| Project Name | Number of Units | Median $PSF In 2024 | Median Price In 2024 | Tenure |
| CHUAN PARK | 724 | $2,587 | $2,327,361 | 99 yrs from 25/07/2024 |
| LENTOR MANSION | 492 | $2,266 | $1,790,500 | 99 yrs from 11/07/2023 |
| LUMINA GRAND | 447 | $1,525 | $1,520,000 | 99 yrs from 27/12/2022 |
| NOVO PLACE | 445 | $1,651 | $1,526,000 | 99 yrs from 11/12/2023 |
| NORWOOD GRAND | 291 | $2,081 | $1,522,000 | 99 yrs from 18/12/2023 |
Resale project performance in 2024
Continuing on from last year, realtors have expressed that the price gap between resale and new launch condos was still a challenge. Finding sellers was still tougher than finding buyers in 2024, with some potential sellers deterred by the high cost of a replacement property.
Top resale performers
| Project | Quantum Gains | % Gain | Sale Date | Transacted | Holding Period (Years) |
| LAGUNA PARK | +$2,410,000 | 438% | 4/11/24 | $2,960,000 | 25 |
| HAWAII TOWER | +$3,225,000 | 416% | 2/2/24 | $4,000,000 | 24.9 |
| SHERWOOD TOWER | +$1,243,888 | 395% | 7/8/24 | $1,558,888 | 18.8 |
| RISING COURT | +$1,645,000 | 383% | 17/7/24 | $2,075,000 | 22 |
| BOTANIC GARDENS VIEW | +$3,265,700 | 379% | 9/9/24 | $4,128,000 | 26.2 |
Bottom resale performers
| Project | Quantum Loss | % Loss | Sale Date | Transacted | Holding Period (Years) |
| SUN COURT | -$343,367 | -41% | 19/8/24 | $492,633 | 28 |
| THE BERTH BY THE COVE | -$1,929,310 | -35% | 29/11/24 | $3,600,000 | 17.3 |
| THE SAIL @ MARINA BAY | -$1,165,392 | -31% | 25/4/24 | $2,550,000 | 12.9 |
| OUE TWIN PEAKS | -$552,530 | -31% | 21/5/24 | $1,239,070 | 7.3 |
| ORCHARD SCOTTS | -$1,643,340 | -30% | 9/7/24 | $3,900,000 | 15 |
Some people may be surprised to see Hawaii Tower here, as this ’80s-era condo has an unpopular layout. Units here have a curved layout that – whilst providing panoramic views – also makes for awkward interior design, and depending on how you handle the windows, the layout can also draw more heat from increased sun exposure. Nonetheless, the unit sizes are gigantic by today’s standards (over 2,200+ sq.ft.). Also, the prestigious Meyer Road location might more than compensate.
The bottom performers may be dragged down by the CCR’s issues from cooling measures. For Sun Court, the performance may be due to age (built in 1985) and volatility (only 19 units), so we wouldn’t read too much into that.
The rental situation in 2024
2024 rental contract volume
| Market Segment | 2023 | 2024 | Change |
| Core Central Region | 24,330 | 23,545 | -3.2% |
| Outside Central Region | 31,718 | 30,984 | -2.3% |
| Rest of Central Region | 28,062 | 26,448 | -5.8% |
| Total | 84,110 | 80,977 | -3.7% |
2024 rental prices
| Market Segment | 2023 | 2024 | Change |
| Core Central Region | 5.72 | 5.52 | -3.5% |
| Outside Central Region | 4.25 | 4.22 | -0.7% |
| Rest of Central Region | 5.26 | 5.18 | -1.5% |
| Total | 4.97 | 4.87 | -2.0% |
2024 saw a softening rental market, which was in line with expectations. This was a correction following the aftermath of COVID-19 when housing was still in short supply. The completion of more mega-projects, along with the completion of HDB projects previously delayed by COVID-19, continues to lower demand and rental rates.
Top rental yield projects in 2024
| PostalDistrict | Project Name | Tenure | CompletionDate | AveragePrice($psf) | #Transactions | AverageRent($psf pm) | #RentalContracts | RentalYield(%) |
| 21 | THE HILLFORD | 60 yrs FROM 2013 | 2016 | 1,429 | 14 | 7.33 | 86 | 6.2 |
| 19 | KOVAN GRANDEUR | 99 yrs FROM 2010 | 2011 | 1,187 | 4 | 5.89 | 19 | 6 |
| 14 | LE REGAL | Freehold | 2015 | 1,399 | 4 | 6.64 | 31 | 5.7 |
| 14 | # 1 SUITES | Freehold | 2016 | 1,250 | 8 | 5.83 | 18 | 5.6 |
| 19 | SUITES @ PAYA LEBAR | Freehold | 2013 | 1,516 | 8 | 6.64 | 34 | 5.3 |
Note that The Hillford is “cheating” a bit, as it’s a 60-year lease property with an unusually low price. This makes it easy for The Hillford to beat other condos for gross rental yield.
| Postal District | Project Name | Tenure | Completion Date | Average Price ($psf) | # Transactions | Average Rent ($psf pm) | # Rental Contracts | Rental Yield (%) |
| 20 | FABER GARDEN CONDOMINIUM | Freehold | 1984 | 1,782 | 5 | 2.73 | 33 | 1.8 |
| 15 | KING’S MANSION | Freehold | 1982 | 1,926 | 7 | 3.13 | 33 | 1.9 |
| 10 | ARDMORE PARK | Freehold | 2001 | 4,229 | 6 | 6.56 | 75 | 1.9 |
| 9 | LEONIE TOWERS | Freehold | 1976 | 1,921 | 5 | 3.24 | 17 | 2 |
| 9 | KIM SIA COURT | Freehold | – | 2,073 | 7 | 3.71 | 52 | 2.1 |
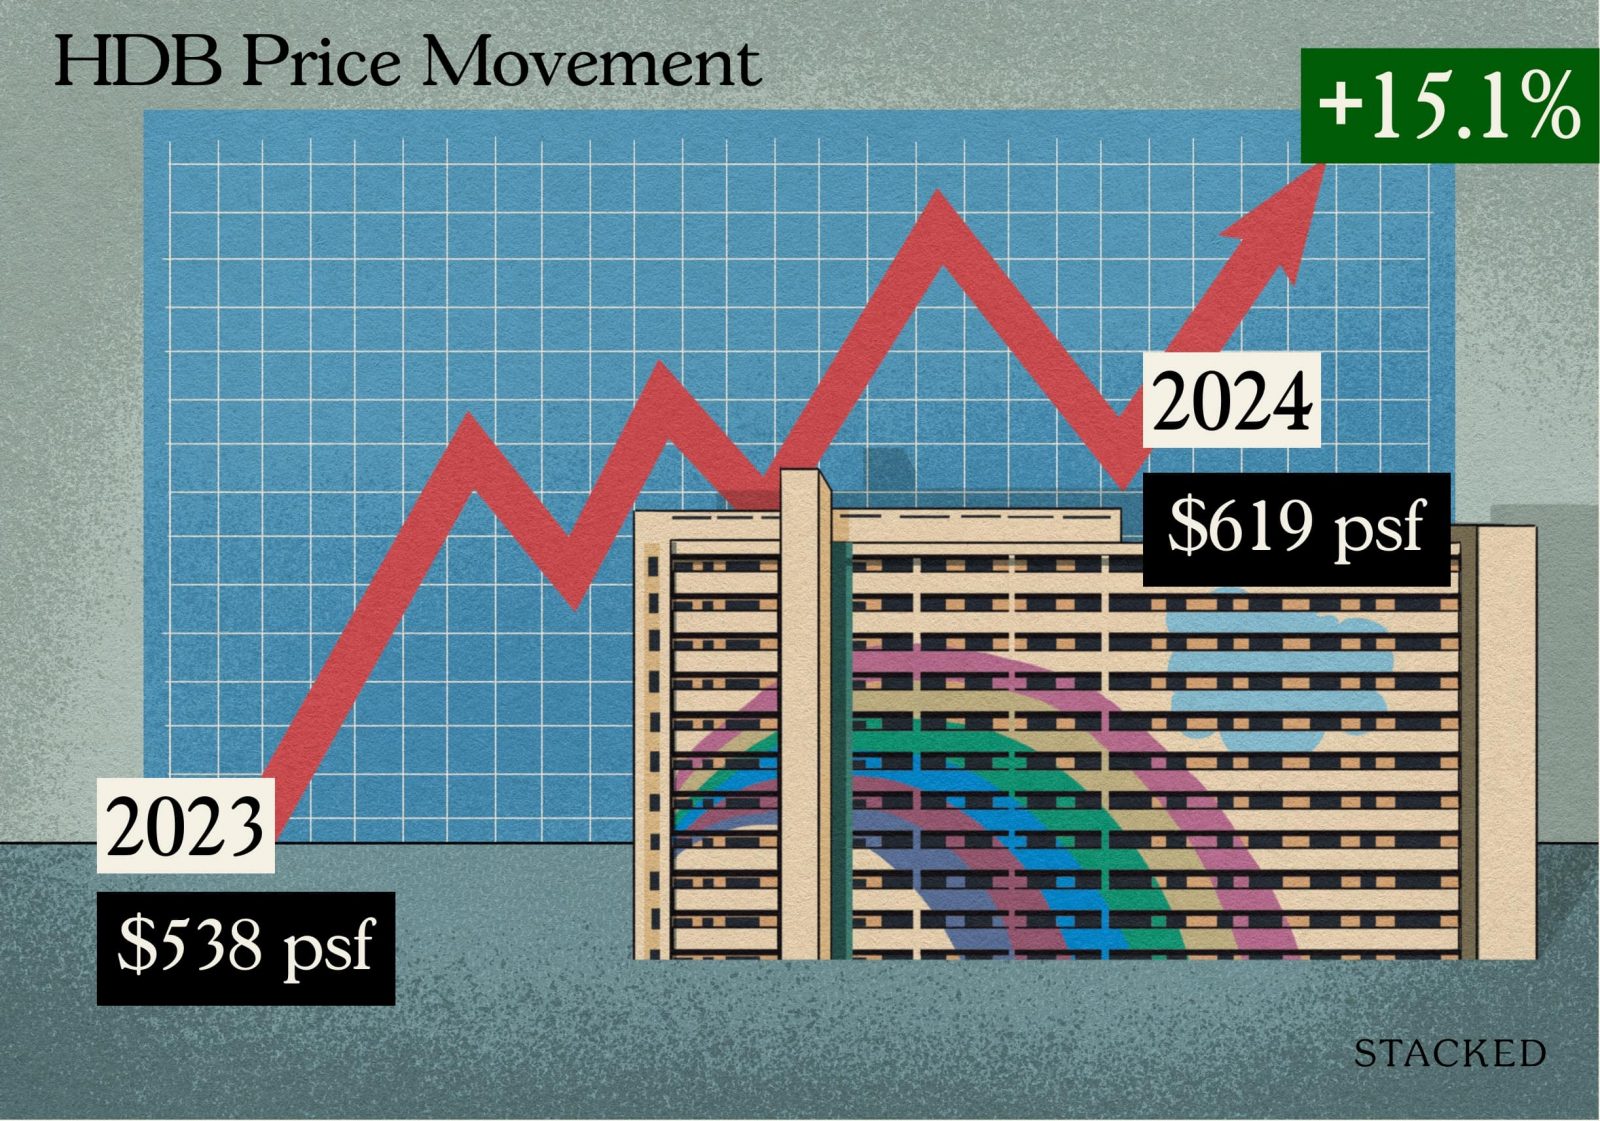
The HDB resale market for 2024
We suspect HDB is quite unhappy with what they’re seeing, as resale flat prices remain frighteningly high. The number of flats priced at $1 million reached the 1,000 mark in 2024, while we’ve started seeing $1.5 million becoming the new milestone/aspiration for HDB sellers. SkyOasis @ Dawson also saw the most expensive HDB flat ever in 2024, at $1.73 million.
We also did see an increase in resale flat transactions:
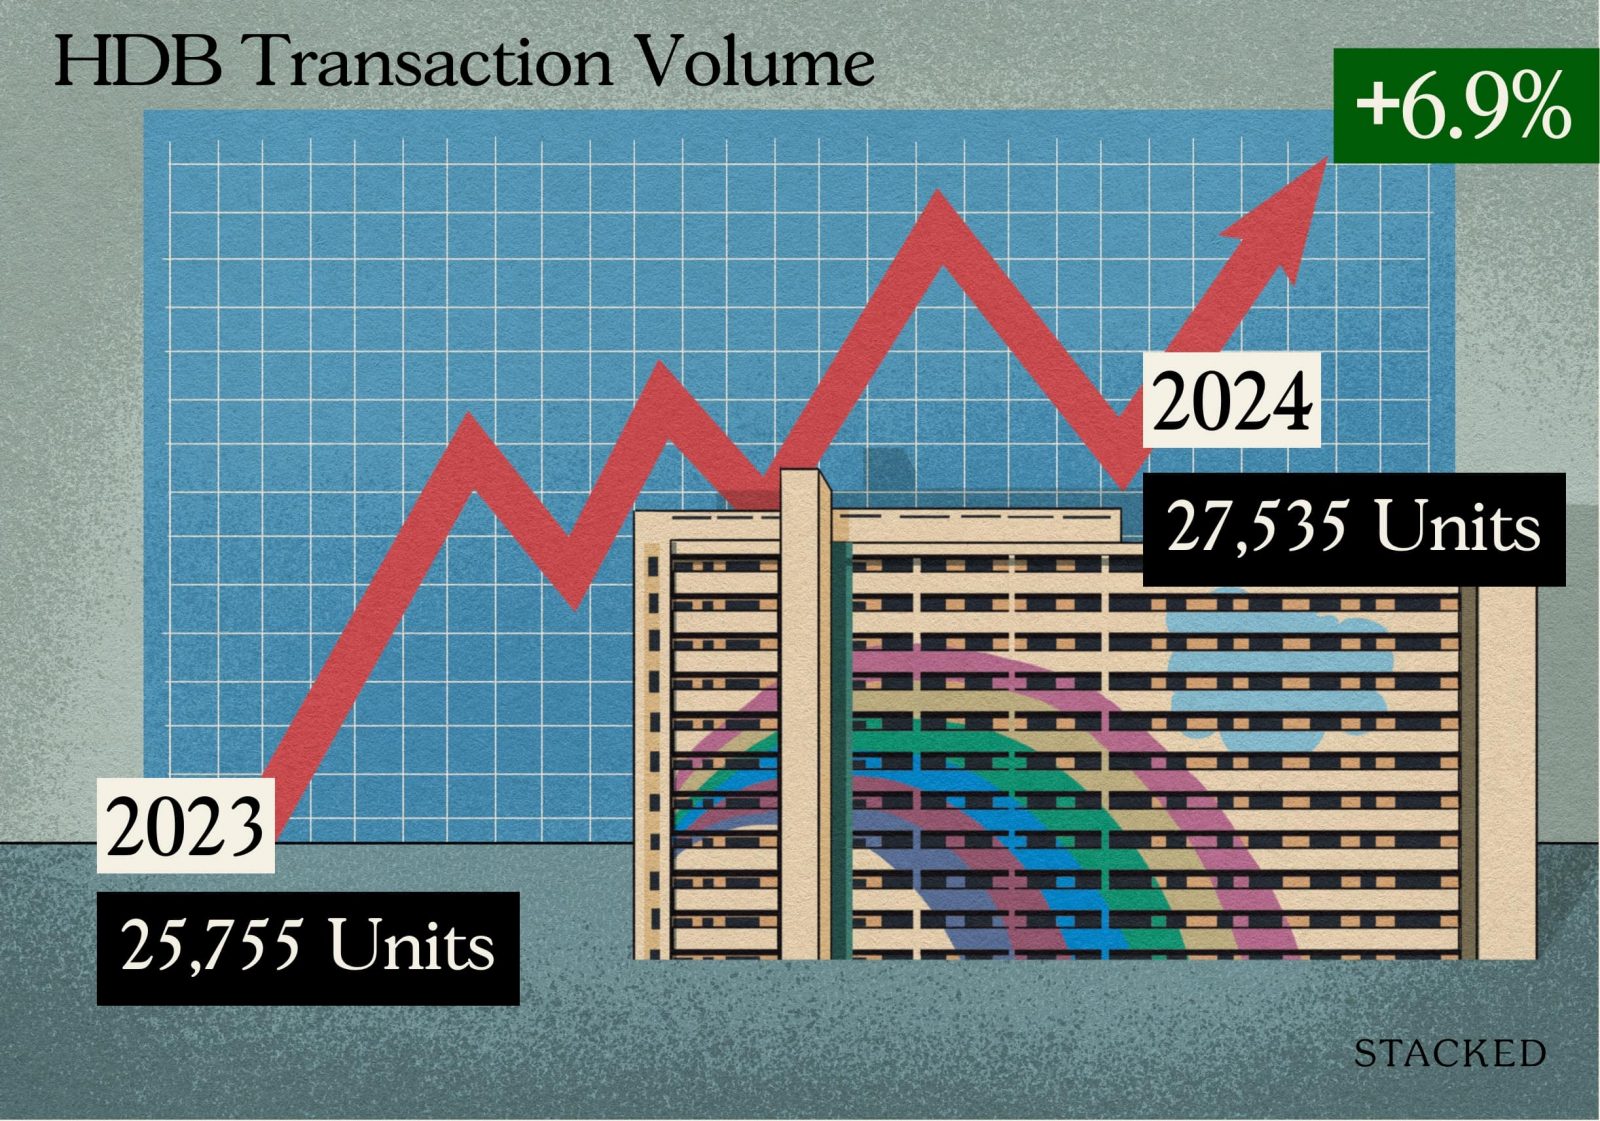
| Year | Volume |
| 2023 | 25,755 |
| 2024 | 27,535 |
| Change | +6.9% |
The price movements, as well as the increase in volumes, may reflect on more buyers opting for a larger or prime resale flat in light of higher condo prices. Here’s how prices have moved up:
| 2023 | 2024 | ||||
| Flat Type | Volume | Average $PSF | Volume | Average $PSF | Approx Gain/Loss |
| 1 ROOM | 6 | $728 | 11 | $763 | +4.8% |
| 2 ROOM | 688 | $659 | 795 | $703 | +6.7% |
| 3 ROOM | 6,355 | $563 | 6,721 | $600 | +6.7% |
| 4 ROOM | 11,357 | $574 | 11,862 | $617 | +7.5% |
| 5 ROOM | 5,843 | $543 | 6,398 | $577 | +6.3% |
| EXECUTIVE | 1,503 | $530 | 1,742 | $560 | +5.7% |
| MULTI-GENERATION | 3 | $538 | 6 | $619 | +15.1% |
Putting aside 3G flats (because just six transactions aren’t enough to draw many conclusions), it’s 4-room flats that saw the biggest uptick in price. Unsurprising as these are the most common flat sizes, but you can see resale flats continued to pick up in price across all sizes.
New BTO launches in 2024
| Estate | BTO Name | Launch Date | Est. Completion | Type | Units |
| Bedok | Bedok North Springs | 21 Feb 2024 | 38 months | Mature | 433 |
| Bedok | Bedok South Bloom | 21 Feb 2024 | 40 months | Mature | 528 |
| Punggol | Matilda Riverside | 21 Feb 2024 | 37 months | Non Mature | 962 |
| Choa Chu Kang | Rail Garden @ CCK | 21 Feb 2024 | 45 months | Non Mature | 465 |
| Queenstown | Tanglin Halt Courtyard | 21 Feb 2024 | 58 months | PLH | 251 |
| Hougang | Tanjong Tree Residences @ Hougang | 21 Feb 2024 | 39 months | Non Mature | 360 |
| Woodlands | Woodgrove Edge | 21 Feb 2024 | 38/39 months | Non Mature | 1127 |
| Yishun | Chencharu Hills | 19 Jun 2024 | 44 / 45 months | Non Mature | 1277 |
| Queenstown | Holland Vista | 19 Jun 2024 | 57 months | PLH | 342 |
| Woodlands | Marsiling Peak I & II | 19 Jun 2024 | 35 / 54 months | Non Mature | 1609 |
| Tampines | Tampines GreenTopaz | 19 Jun 2024 | 37 months | mature | 561 |
| Kallang/Whampoa | Tanjong Rhu Riverfront I & II | 19 Jun 2024 | 48 / 55 months | PLH | 2063 |
| Jurong West | Teban Breeze | 19 Jun 2024 | 54 months | Non Mature | 1086 |
| Bedok | Bayshore Palms | 16 Oct 2024 | 47 months | Plus | 710 |
| Bedok | Bayshore Vista | 16 Oct 2024 | 45 months | Plus | 734 |
| Ang Mo Kio | Central Trio @ AMK | 16 Oct 2024 | 59 months | Plus | 422 |
| Pasir Ris | Costa Riviera I & II | 16 Oct 2024 | 37 / 38 months | Standard | 767 |
| Kallang/Whampoa | Crawford Heights | 16 Oct 2024 | 50 months | Prime | 312 |
| Sengkang | Fernvale Oasis | 16 Oct 2024 | 33 months | Standard | 851 |
| Sengkang | Fernvale Sails | 16 Oct 2024 | 27 months | Standard | 545 |
| Kallang/Whampoa | Kallang View | 16 Oct 2024 | 43 months | Plus | 271 |
| Bedok | Kembangan Wave | 16 Oct 2024 | 41 months | Plus | 348 |
| Woodlands | Marsiling Ridge | 16 Oct 2024 | 43 months | Standard | 292 |
| Geylang | Merpati Alcove | 16 Oct 2024 | 44 months | Plus | 433 |
| Jurong West | Taman Jurong Skyline | 16 Oct 2024 | 52 months | Standard | 1844 |
| Kallang/Whampoa | Towner Breeze | 16 Oct 2024 | 48 months | Plus | 355 |
| Bukit Batok | West BrickVille @ Bukit Batok | 16 Oct 2024 | 24 months | Standard | 689 |
2024 was the first time we saw the launch of Plus model flats. These come with the same restrictions as Prime flats, but the cost is lower; they’re near the neighbourhood hub (usually the place with the mall and train station) but not necessarily close to the city centre. The first of these will be the Bayshore enclave.
There were only two EC launches in 2024, with predictably high take-up rates:
| Project | Units | Units Sold To Date | Lowest $PSF In 2024 | Highest $PSF In 2024 | Median $PSF In 2024 | Take-Up |
| Novo Place | 504 | 445 | 1,506 | 1,754 | 1,651 | 88.3% |
| Lumina Grand | 512 | 447 | 1,326 | 1,590 | 1,525 | 87.3% |
The prices probably come as a relief to upgraders, who are struggling with new, family-sized condo units often breaching the $2 million mark. Novo Place, in particular, was an interesting launch, as it’s a true example of first-mover advantage: there’s no other EC in Tengah yet, so its performance will be closely studied.
Overall, 2024 did see the private non-landed market calm down a bit. However, the decrease in home loan rates, coupled with surging interest in new launches toward the end of the year, warns of another potential wave of exuberance in 2025.
For more updates over the year, follow us on Stacked. If you would like to review your next steps in your property journey, feel free to reach out to us here for a consultation.
At Stacked, we like to look beyond the headlines and surface-level numbers, and focus on how things play out in the real world.
If you’d like to discuss how this applies to your own circumstances, you can reach out for a one-to-one consultation here.
And if you simply have a question or want to share a thought, feel free to write to us at stories@stackedhomes.com — we read every message.
0 Comments