Why This Large-Unit Condo in the Jervois Enclave Isn’t Keeping Up With the Market
Get The Property Insights Serious Buyers Read First: Join 50,000+ readers who rely on our weekly breakdowns of Singapore’s property market.
A seasoned content strategist with over 17 years in the real estate and financial journalism sectors, Ryan has built a reputation for transforming complex industry jargon into accessible knowledge. With a track record of writing and editing for leading financial platforms and publications, Ryan's expertise has been recognised across various media outlets. His role as a former content editor for 99.co and a co-host for CNA 938's Open House programme underscores his commitment to providing valuable insights into the property market.
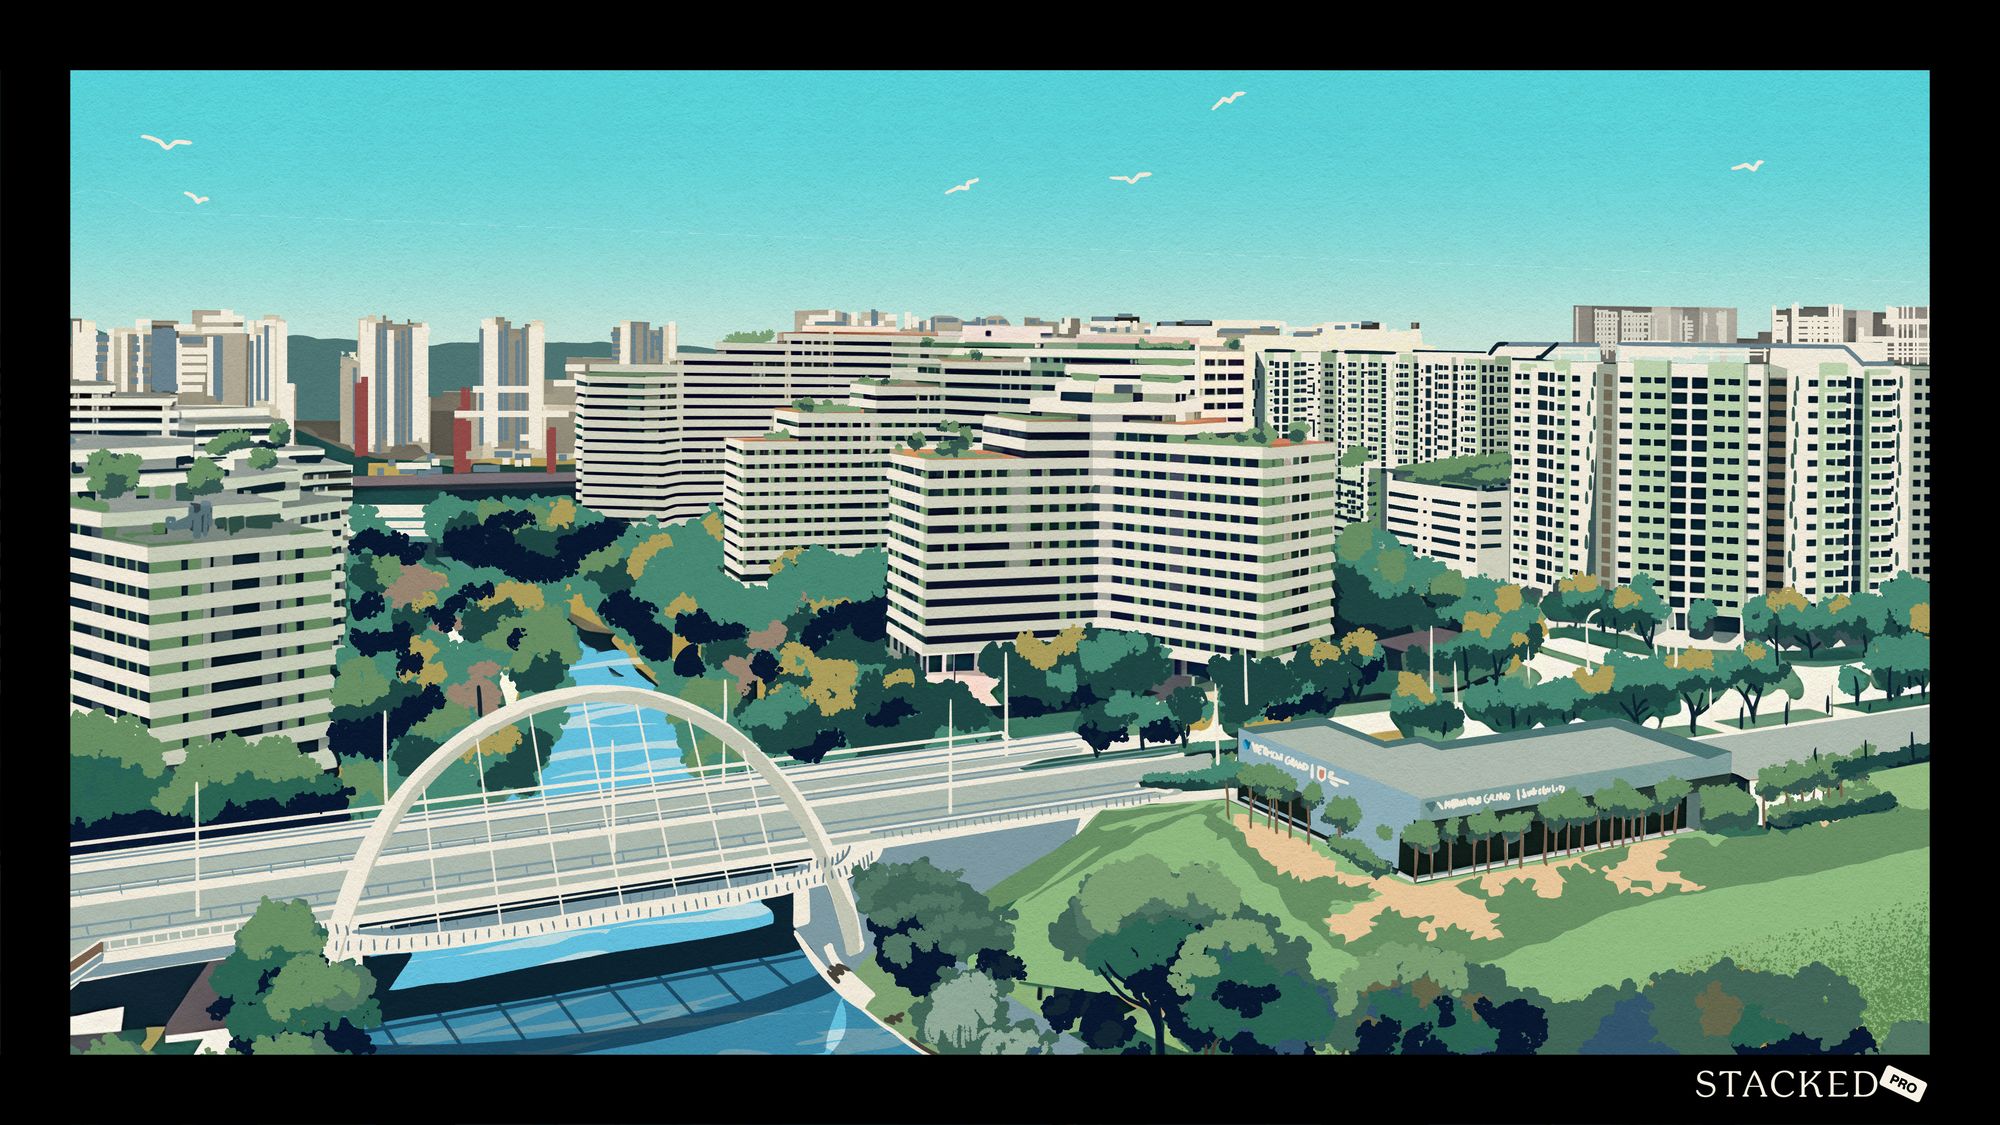
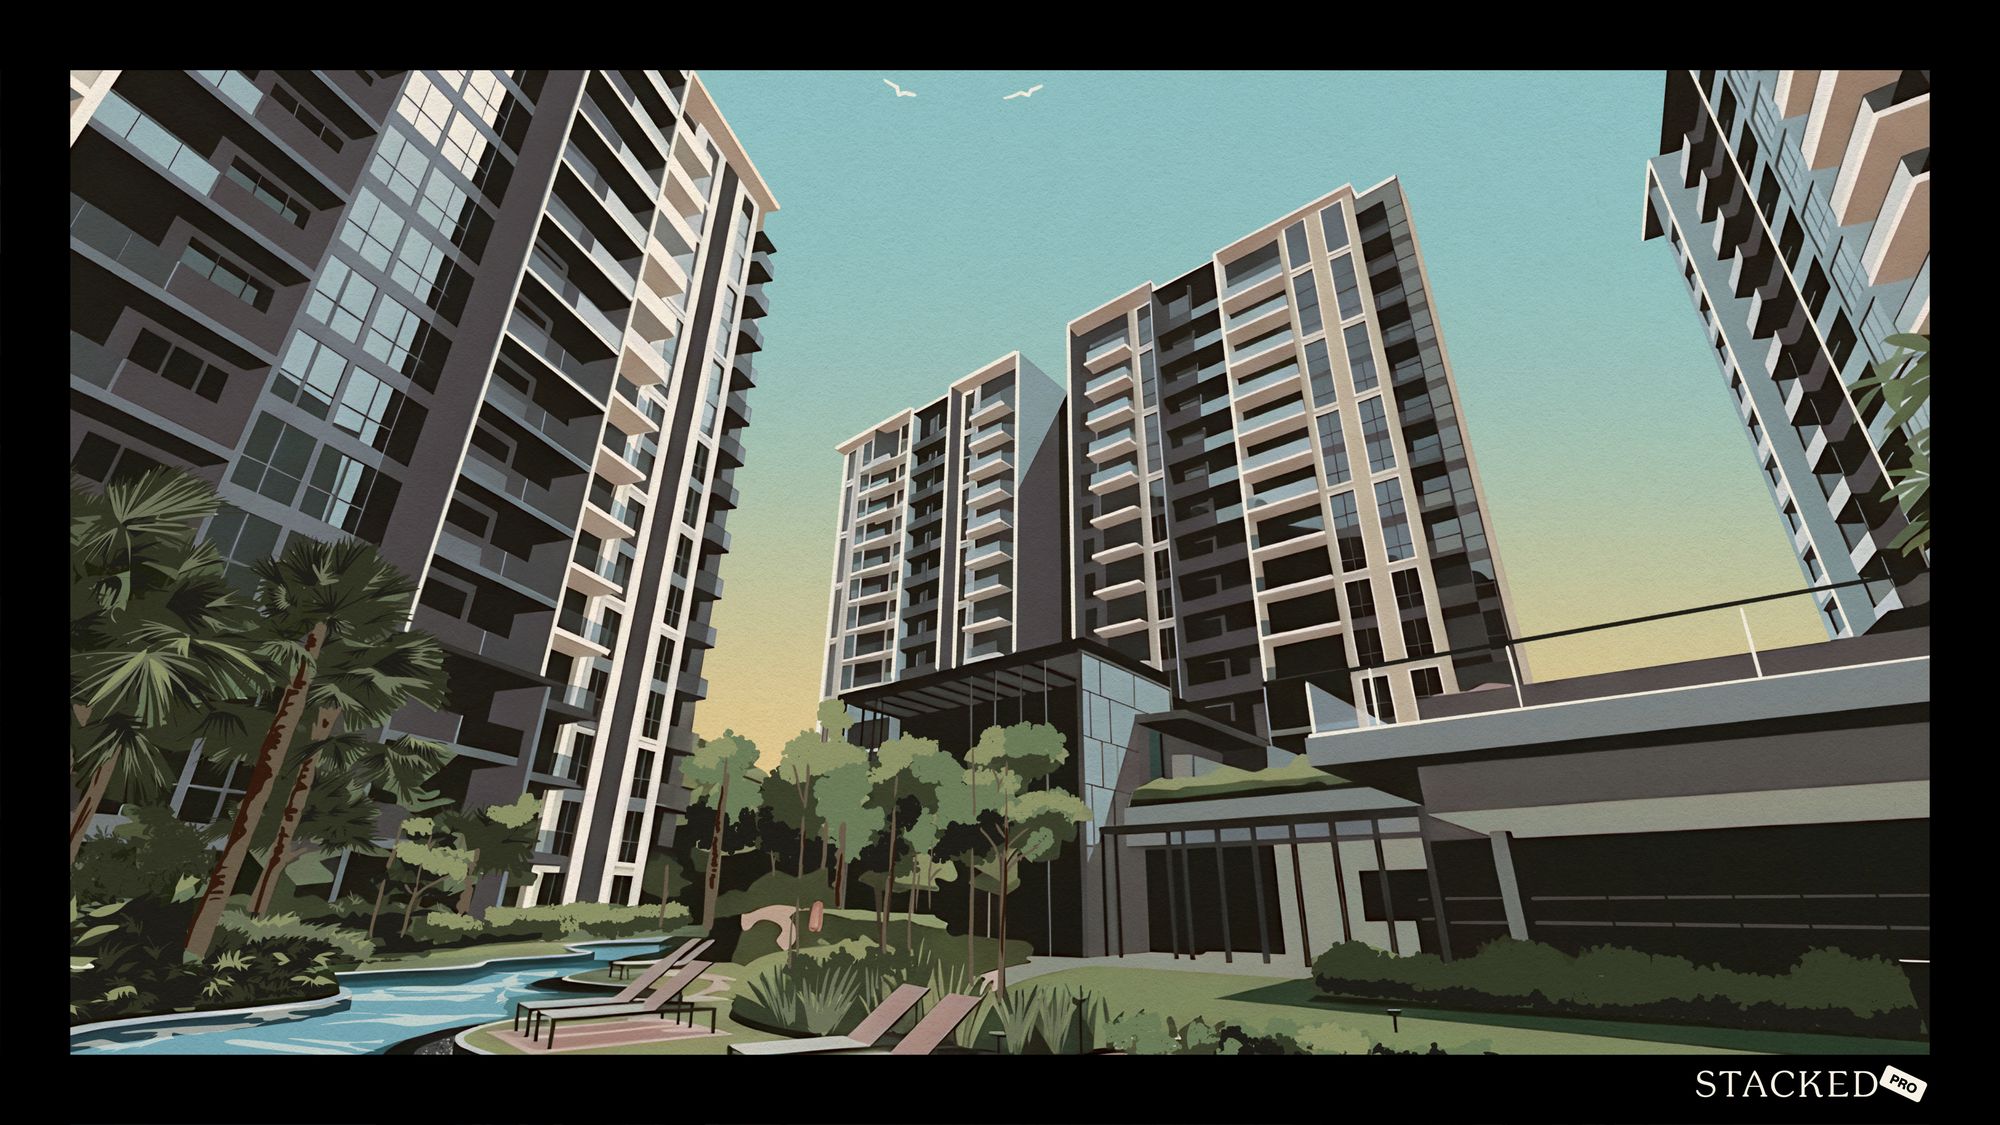
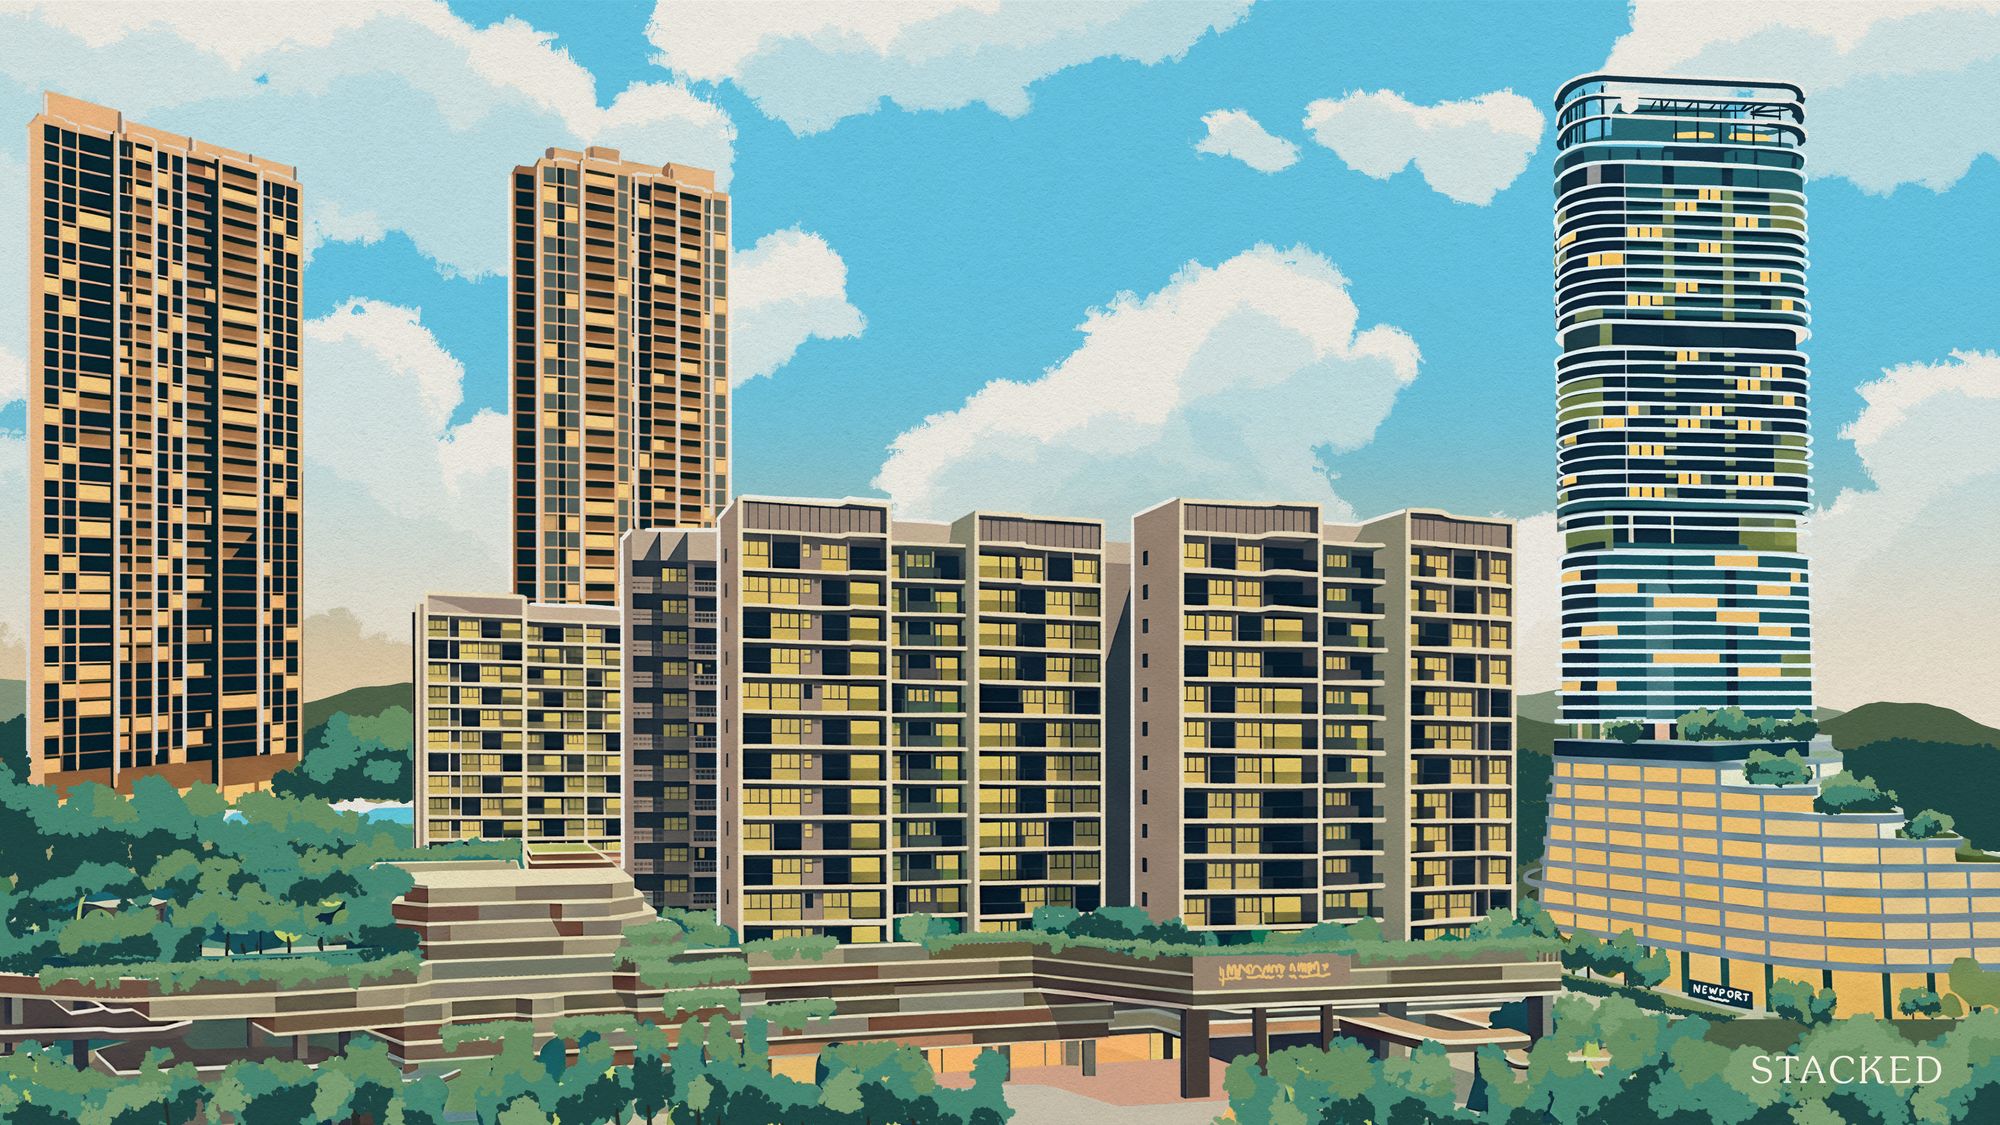
The Crest was a headline development when it launched, and its architecture is iconic: it was designed by Pritzker Prize laureate Toyo Ito from Japan. Its “blooming flower” facade and sweeping views of the landed Jervois estate make it one of the more recognisable RCR condos. It’s also especially known for its generously sized units, as we’ll cover below. But The Crest, which was completed in 2017, has been trailing its neighbours and the wider market. Let’s take a deep dive and find out why:
And cases like this show just how differently projects can age, even when they start with similar advantages. If you’d like help understanding what drives those differences before you make your next move, reach out here and we’ll link you with a trusted partner agent who can break it down clearly.
The overall performance of The Crest
This is the price movement of The Crest from its launch year to Q3 2025:
| Year | Average $PSF |
| 2014 | $1,762 |
| 2015 | $1,703 |
| 2016 | $1,706 |
| 2017 | $1,724 |
| 2018 | $1,998 |
| 2019 | $2,016 |
| 2020 | $1,955 |
| 2021 | $1,915 |
| 2022 | $1,936 |
| 2023 | $1,935 |
| 2024 | $1,918 |
| 2025 (Up to Q3) | $1,959 |
| Annualised | 0.97% |

An increase of around a single percentage point isn’t a good start. However, let’s measure The Crest against other leasehold condos in Singapore, as The Crest itself is leasehold. We’ll also compare The Crest to other leasehold condos in District 3 (D3), specifically, where The Crest is located:
| Year | The Crest | All 99y projects | 99y projects in D3 |
| 2014 | $1,762 | $1,196 | $1,661 |
| 2015 | $1,703 | $1,104 | $1,582 |
| 2016 | $1,706 | $1,166 | $1,626 |
| 2017 | $1,724 | $1,230 | $1,702 |
| 2018 | $1,998 | $1,359 | $1,771 |
| 2019 | $2,016 | $1,474 | $1,973 |
| 2020 | $1,955 | $1,453 | $2,018 |
| 2021 | $1,915 | $1,517 | $2,075 |
| 2022 | $1,936 | $1,595 | $2,312 |
| 2023 | $1,935 | $1,783 | $2,296 |
| 2024 | $1,918 | $1,854 | $2,214 |
| 2025 (Up to Q3) | $1,959 | $2,114 | $2,750 |
| Annualised | 0.97% | 5.31% | 4.69% |

The Crest underperforms both the wider leasehold market and the leasehold market in D3. The gap in performance is very significant, and its price appears to have barely moved since launch.
Next, we’ll look at performance based on subsale and resale transactions only. This will allow us to see The Crest’s performance without the distortion of developer discounts.
The Crest began transacting on the secondary market from 2017, so we’ll look at transactions from 2017 to Q3 2025.
| Year | The Crest | All 99y projects | 99y projects in D3 |
| 2017 | $1,840 | $1,123 | $1,346 |
| 2018 | $1,998 | $1,164 | $1,697 |
| 2019 | $2,016 | $1,189 | $1,653 |
| 2020 | $1,955 | $1,159 | $1,641 |
| 2021 | $1,915 | $1,227 | $1,697 |
| 2022 | $1,936 | $1,370 | $1,917 |
| 2023 | $1,935 | $1,516 | $2,050 |
| 2024 | $1,918 | $1,616 | $2,137 |
| 2025 (Up to Q3) | $1,959 | $1,679 | $2,204 |
| Annualised | 0.39% | 7.02% | 4.75% |

The results worsened as expected. This is because the earliest buyers, who received developer discounts, would have bought at a lower price and seen better gains. Those who bought later in the secondary market would have bought at higher prices, thus seeing even weaker gains.
Now let’s get more specific, and compare The Crest to its closest neighbouring projects
We do run into a bit of a problem here, as the Alexandra-Prince Charles Crescent area has several boutique condos near The Crest. These are projects with a very low unit count. This can distort comparisons, as these boutique projects tend to have very low transaction volumes, which leads to volatile pricing.
So, for a fairer comparison, we should compare like-for-like. We’ll only be including nearby projects with more than 150 units. Also, because project data before 1995 is unavailable, some of the projects won’t have prices shown before this date, even if they have transactions in ‘95 or earlier. In any case, transactions from so far back have little relevance to the current comparison.
| Project | Tanglin Regency | Tanglin View | One Jervois | The Metropolitan | Ascentia Sky | Alex Residences | Echelon | The Crest | Principal Garden | ARTRA |
| Tenure | 99-year | 99-year | Freehold | 99-year | 99-year | 99-year | 99-year | 99-year | 99-year | 99-year |
| Launch year | 1995 | 1998 | 2006 | 2006 | 2009 | 2013 | 2013 | 2014 | 2015 | 2017 |
| Completion year | 1998 | 2001 | 2009 | 2009 | 2013 | 2017 | 2016 | 2017 | 2018 | 2020 |
| No. of units | 210 | 384 | 275 | 382 | 373 | 429 | 508 | 469 | 663 | 400 |
| Year | TANGLIN REGENCY | TANGLIN VIEW | ONE JERVOIS | THE METROPOLITAN CONDOMINIUM | ASCENTIA SKY | ALEX RESIDENCES | ECHELON | THE CREST | PRINCIPAL GARDEN | ARTRA |
| 1995 | $782 | |||||||||
| 1996 | $929 | |||||||||
| 1997 | $981 | |||||||||
| 1998 | $751 | $787 | ||||||||
| 1999 | $765 | $761 | ||||||||
| 2000 | $783 | $809 | ||||||||
| 2001 | $746 | $750 | ||||||||
| 2002 | $674 | $686 | ||||||||
| 2003 | $579 | $668 | ||||||||
| 2004 | $577 | $659 | ||||||||
| 2005 | $544 | $646 | ||||||||
| 2006 | $583 | $693 | $1,004 | $782 | ||||||
| 2007 | $874 | $975 | $1,235 | $867 | ||||||
| 2008 | $964 | $1,029 | $1,233 | $926 | ||||||
| 2009 | $921 | $1,014 | $1,216 | $981 | $1,248 | |||||
| 2010 | $1,029 | $1,129 | $1,504 | $1,158 | $1,323 | |||||
| 2011 | $1,203 | $1,233 | $1,572 | $1,319 | $1,386 | |||||
| 2012 | $1,286 | $1,331 | $1,627 | $1,327 | $1,488 | |||||
| 2013 | $1,305 | $1,331 | $1,743 | $1,409 | $1,608 | $1,699 | $1,794 | |||
| 2014 | $1,328 | $1,279 | $1,655 | $1,388 | $1,576 | $1,689 | $1,762 | |||
| 2015 | $1,291 | $1,210 | $1,533 | $1,334 | $1,469 | $1,743 | $1,531 | $1,703 | $1,628 | |
| 2016 | $1,277 | $1,191 | $1,560 | $1,292 | $1,444 | $1,949 | $1,594 | $1,706 | $1,621 | |
| 2017 | $1,288 | $1,172 | $1,629 | $1,268 | $1,431 | $1,956 | $1,845 | $1,724 | $1,703 | $1,672 |
| 2018 | $1,400 | $1,284 | $1,751 | $1,401 | $1,458 | $1,908 | $1,793 | $1,998 | $1,823 | $1,815 |
| 2019 | $1,292 | $1,298 | $1,728 | $1,480 | $1,513 | $1,812 | $1,836 | $2,016 | $1,896 | $1,946 |
| 2020 | $1,379 | $1,311 | $1,753 | $1,457 | $1,471 | $1,811 | $1,742 | $1,955 | $1,904 | $2,019 |
| 2021 | $1,430 | $1,379 | $1,897 | $1,497 | $1,509 | $1,909 | $1,872 | $1,915 | $1,914 | $1,934 |
| 2022 | $1,579 | $1,524 | $2,049 | $1,615 | $1,692 | $1,979 | $1,988 | $1,936 | $1,969 | $2,094 |
| 2023 | $1,665 | $1,617 | $2,143 | $1,708 | $1,767 | $2,079 | $2,132 | $1,935 | $2,066 | $2,272 |
| 2024 | $1,705 | $1,723 | $2,116 | $1,798 | $1,885 | $2,152 | $2,184 | $1,918 | $2,167 | $2,349 |
| 2025 (Up to Q3) | $1,705 | $1,880 | $2,276 | $1,918 | $1,955 | $2,235 | $2,130 | $1,959 | $2,170 | $2,378 |
| Annualised | 2.63% | 3.28% | 4.40% | 4.84% | 2.85% | 2.31% | 1.44% | 0.97% | 2.91% | 4.50% |
The majority of The Crest’s neighbours are also leasehold, so it’s not significantly disadvantaged for this reason.
We can also see that, even compared just to its neighbours, The Crest had seen the weakest annualised gains since launch.
But as before, let’s compare using resale and sub sale transactions only, to avoid developer pricing distortions:
| Year | TANGLIN REGENCY | TANGLIN VIEW | ONE JERVOIS | THE METROPOLITAN CONDOMINIUM | ASCENTIA SKY | ALEX RESIDENCES | ECHELON | THE CREST | PRINCIPAL GARDEN | ARTRA |
| 2017 | $1,288 | $1,172 | $1,629 | $1,268 | $1,431 | $1,478 | $1,834 | $1,840 | ||
| 2018 | $1,400 | $1,284 | $1,751 | $1,401 | $1,458 | $1,908 | $1,793 | $1,998 | $1,796 | |
| 2019 | $1,292 | $1,298 | $1,728 | $1,480 | $1,513 | $1,812 | $1,836 | $2,016 | $1,896 | |
| 2020 | $1,379 | $1,311 | $1,753 | $1,457 | $1,471 | $1,811 | $1,742 | $1,955 | $1,904 | $1,871 |
| 2021 | $1,430 | $1,379 | $1,897 | $1,497 | $1,509 | $1,909 | $1,872 | $1,915 | $1,914 | $1,934 |
| 2022 | $1,579 | $1,524 | $2,049 | $1,615 | $1,692 | $1,979 | $1,988 | $1,936 | $1,969 | $2,094 |
| 2023 | $1,665 | $1,617 | $2,143 | $1,708 | $1,767 | $2,079 | $2,132 | $1,935 | $2,066 | $2,272 |
| 2024 | $1,705 | $1,723 | $2,116 | $1,798 | $1,885 | $2,152 | $2,184 | $1,918 | $2,167 | $2,349 |
| 2025 (Up to Q3) | $1,705 | $1,880 | $2,276 | $1,918 | $1,955 | $2,235 | $2,130 | $1,959 | $2,170 | $2,378 |
| Annualised | 3.57% | 6.08% | 4.27% | 5.31% | 3.98% | 5.31% | 1.89% | 0.79% | 2.74% (2018 to 2025) | 4.92% (2020 to 2025) |
| 2.74% | 4.92% |
Note: As Principal Garden and Artra were completed later than The Crest, we need to account for their shorter holding periods. To provide a fairer assessment, we calculated their annualised growth based on the periods when all three projects were concurrently in the resale market: 2018 to 2025 for Principal Garden, and 2020 to 2025 for Artra.
But anyway, even with the adjusted comparison, The Crest is in the same position: it’s still the bottom performer among its neighbours.
Let’s dive into the specific unit sizes and layouts of The Crest, to see if any specific category behaved differently:
1-bedroom units
As there were no 1-bedders sold in The Crest in 2017, we will look at 2018 to Q3 2025
| Year | ONE JERVOIS | ALEX RESIDENCES | ECHELON | THE CREST | PRINCIPAL GARDEN |
| 2018 | $1,913 | $2,168 | $2,079 | ||
| 2019 | $2,263 | $2,070 | $1,955 | ||
| 2020 | $1,699 | $1,965 | $1,827 | ||
| 2021 | $1,885 | $2,035 | $1,838 | ||
| 2022 | $1,973 | $2,115 | $2,054 | $1,851 | |
| 2023 | $1,979 | $2,124 | $1,972 | $1,932 | |
| 2024 | $2,062 | $2,161 | $1,891 | $1,939 | |
| 2025 (Up to Q3) | $2,004 | $2,015 | $1,708 | $1,944 | |
| Annualised | – | 0.67% | -1.04% | -2.77% | -0.09% (2019 to 2025) |
| -0.09% |
2-bedroom units
| Year | TANGLIN REGENCY | TANGLIN VIEW | ONE JERVOIS | THE METROPOLITAN CONDOMINIUM | ASCENTIA SKY | ALEX RESIDENCES | ECHELON | THE CREST | PRINCIPAL GARDEN | ARTRA |
| 2017 | $1,301 | $1,300 | $1,656 | $1,284 | $1,400 | $1,858 | $1,936 | |||
| 2018 | $1,406 | $1,758 | $1,471 | $1,574 | $1,904 | $1,990 | $2,084 | $1,796 | ||
| 2019 | $1,320 | $1,297 | $1,729 | $1,504 | $1,586 | $1,987 | $2,082 | $1,887 | ||
| 2020 | $1,408 | $1,370 | $1,765 | $1,513 | $1,564 | $1,864 | $1,909 | $2,001 | $1,901 | $1,782 |
| 2021 | $1,412 | $1,432 | $1,876 | $1,517 | $1,612 | $1,964 | $1,945 | $1,892 | $1,938 | $1,900 |
| 2022 | $1,578 | $1,447 | $2,237 | $1,642 | $1,778 | $2,055 | $2,106 | $2,057 | $2,033 | $2,079 |
| 2023 | $1,655 | $1,643 | $2,150 | $1,749 | $1,796 | $2,120 | $2,256 | $1,947 | $2,147 | $2,304 |
| 2024 | $1,688 | $2,192 | $1,804 | $1,978 | $2,135 | $2,265 | $1,946 | $2,203 | $2,325 | |
| 2025 (Up to Q3) | $1,700 | $1,692 | $2,220 | $1,847 | $2,027 | $2,273 | $2,198 | $1,969 | $2,220 | $2,359 |
| Annualised | 3.40% | 3.35% | 3.73% | 4.65% | 4.73% | – | 2.12% | 0.21% | 3.08% (2018 to 2025) | 5.77% (2020 to 2025) |
| 3.08% | 5.77% |
3-bedroom units
| Year | TANGLIN REGENCY | TANGLIN VIEW | ONE JERVOIS | THE METROPOLITAN CONDOMINIUM | ASCENTIA SKY | ALEX RESIDENCES | ECHELON | THE CREST | PRINCIPAL GARDEN | ARTRA |
| 2017 | $1,263 | $1,161 | $1,584 | $1,295 | $1,481 | $1,478 | $1,745 | $1,799 | ||
| 2018 | $1,380 | $1,295 | $1,719 | $1,373 | $1,341 | $1,890 | $1,691 | $1,920 | ||
| 2019 | $1,271 | $1,321 | $1,817 | $1,436 | $1,467 | $1,812 | $1,787 | $1,918 | ||
| 2020 | $1,361 | $1,308 | $1,742 | $1,411 | $1,461 | $1,794 | $1,774 | $1,899 | $1,959 | $1,901 |
| 2021 | $1,452 | $1,369 | $1,898 | $1,480 | $1,455 | $1,877 | $1,805 | $1,918 | $1,952 | $1,986 |
| 2022 | $1,586 | $1,559 | $1,922 | $1,579 | $1,638 | $1,963 | $1,988 | $1,837 | $2,082 | $2,212 |
| 2023 | $1,695 | $1,603 | $2,110 | $1,716 | $1,763 | $2,111 | $2,020 | $1,906 | $2,230 | $2,251 |
| 2024 | $1,741 | $1,742 | $2,160 | $1,854 | $1,874 | $2,192 | $2,139 | $1,909 | $2,424 | $2,388 |
| 2025 (Up to Q3) | $1,720 | $1,920 | $2,501 | $2,009 | $1,922 | $2,241 | $2,210 | $1,980 | $2,428 | $2,394 |
| Annualised | 3.94% | 6.49% | 5.87% | 5.64% | 3.31% | 5.34% | 3.00% | 1.20% | 4.38% (2020 to 2025) | 4.72% (2020 to 2025) |
| 4.38% | 4.72% |
4-bedroom units
| Year | TANGLIN VIEW | ONE JERVOIS | THE METROPOLITAN CONDOMINIUM | ASCENTIA SKY | ECHELON | THE CREST | PRINCIPAL GARDEN |
| 2017 | $1,107 | $1,505 | $1,199 | $1,466 | $1,750 | $1,853 | |
| 2018 | $1,233 | $1,813 | $1,433 | $1,457 | $1,780 | $2,001 | |
| 2019 | $1,237 | $1,548 | $1,497 | $1,352 | $1,336 | $2,085 | |
| 2020 | $1,280 | $1,485 | $1,396 | $1,500 | $2,064 | $1,921 | |
| 2021 | $1,349 | $1,926 | $1,478 | $1,351 | $1,814 | $1,923 | $1,992 |
| 2022 | $1,516 | $1,987 | $1,621 | $1,625 | $1,804 | $1,968 | $2,141 |
| 2023 | $1,745 | $2,198 | $1,640 | $1,717 | $1,941 | $1,978 | |
| 2024 | $1,671 | $1,756 | $1,753 | $1,803 | $2,046 | $1,904 | $2,389 |
| 2025 (Up to Q3) | $1,811 | $1,899 | $1,935 | $1,979 | $1,946 | $2,446 | |
| Annualised | 6.35% | – | 5.92% | 3.54% | 1.55% | 0.62% | 4.95% (2020 to 2025) |
| 4.95% |
Note: There were no five-bedder transactions during this period, so we’re unable to make comparisons for that size category.
Unfortunately, none of the unit sizes managed to buck the trend. From one-bedders to four-bedders, the Crest consistently ranks at the bottom compared to its neighbours.
More from Stacked
The First New Launch Condo In 15 Years In Upper East Coast Priced From $1.2m: A Bagnall Haus Preview
Offering 113 freehold units, Bagnall Haus is the first new launch in District 16’s Upper East Coast area in 15…
For one-bedroom units, The Crest shows negative annualised growth from 2018 to Q3 2025, which we don’t see in any other project.
Among two-bedroom units, The Crest ranks at the bottom with an annualised growth rate of around 0.21 per cent, and we note that Principal Garden and Artra, which are the most similar in age, outperform by a wide margin across the same period. We also see this for three-bedders, where The Crest is outpaced by Principal Garden and Artra.
For four-bedders, there are admittedly low transaction volumes, so we can’t read too much into it; but even so, The Crest is at the bottom of what we do have.
To understand why this has happened, we will next examine the overall quantum, unit sizes, and number of resale / subsale transactions.
Average 1-bedroom prices
| Year | ONE JERVOIS | ALEX RESIDENCES | ECHELON | THE CREST | PRINCIPAL GARDEN |
| 2018 | $922,250 | $980,000 | $1,334,773 | ||
| 2019 | $1,023,000 | $1,281,280 | $968,000 | ||
| 2020 | $1,280,000 | $1,279,000 | $904,000 | ||
| 2021 | $892,625 | $920,000 | $899,077 | ||
| 2022 | $934,375 | $956,143 | $1,260,000 | $907,650 | |
| 2023 | $937,167 | $960,143 | $1,380,000 | $957,647 | |
| 2024 | $976,667 | $977,000 | $1,178,000 | $950,423 | |
| 2025 (Up to Q3) | $949,000 | $910,925 | $1,140,000 | $949,800 |
Average 1-bedroom sizes (based on transactions done)
| Year | ONE JERVOIS | ALEX RESIDENCES | ECHELON | THE CREST | PRINCIPAL GARDEN |
| 2018 | 482 | 452 | 642 | ||
| 2019 | 452 | 619 | 495 | ||
| 2020 | 753 | 651 | 495 | ||
| 2021 | 474 | 452 | 489 | ||
| 2022 | 474 | 452 | 614 | 490 | |
| 2023 | 474 | 452 | 700 | 496 | |
| 2024 | 474 | 452 | 625 | 490 | |
| 2025 (Up to Q3) | 474 | 452 | 667 | 488 |
No. of transactions
| Year | ONE JERVOIS | ALEX RESIDENCES | ECHELON | THE CREST | PRINCIPAL GARDEN |
| 2018 | 4 | 1 | 11 | ||
| 2019 | 1 | 4 | 1 | ||
| 2020 | 1 | 2 | 2 | ||
| 2021 | 4 | 2 | 13 | ||
| 2022 | 8 | 7 | 1 | 20 | |
| 2023 | 6 | 7 | 1 | 17 | |
| 2024 | 3 | 5 | 2 | 13 | |
| 2025 (Up to Q3) | 2 | 3 | 1 | 13 |
The Crest has a lower average $PSF than its peers, but its one-bedders are significantly larger. As a result, its quantum (overall price) is much higher. One-bedders at Alex Residences average around 452 sq ft, and those at One Jervois are about 474 sq ft, but most one-bedders transacted at The Crest fall between 485 and 500 sq ft. Some years see even larger units.
This could explain why The Crest lags behind its neighbours in this size segment: buyers of one-bedders tend to focus on a lower quantum, as it translates to better rental yields and meets affordability expectations.
Average 2-bedroom prices
| Year | TANGLIN REGENCY | TANGLIN VIEW | ONE JERVOIS | THE METROPOLITAN CONDOMINIUM | ASCENTIA SKY | ALEX RESIDENCES | ECHELON | THE CREST | PRINCIPAL GARDEN | ARTRA |
| 2017 | $1,070,833 | $1,133,333 | $1,710,300 | $1,243,333 | $1,366,400 | $1,360,000 | $1,808,000 | |||
| 2018 | $1,153,400 | $1,830,432 | $1,265,000 | $1,551,650 | $1,250,000 | $1,456,450 | $1,875,150 | $1,450,000 | ||
| 2019 | $1,170,000 | $1,261,000 | $1,777,600 | $1,453,750 | $1,562,857 | $1,454,722 | $1,829,243 | $1,472,500 | ||
| 2020 | $1,084,000 | $1,194,444 | $1,806,000 | $1,427,222 | $1,548,333 | $1,264,000 | $1,397,000 | $1,660,020 | $1,511,750 | $1,400,000 |
| 2021 | $1,095,667 | $1,248,333 | $1,925,833 | $1,429,091 | $1,603,000 | $1,307,857 | $1,423,750 | $1,702,500 | $1,554,100 | $1,520,000 |
| 2022 | $1,349,688 | $1,395,000 | $2,216,000 | $1,528,833 | $1,748,833 | $1,380,000 | $1,541,250 | $1,969,333 | $1,610,833 | $1,690,375 |
| 2023 | $1,445,000 | $1,432,667 | $2,313,500 | $1,449,978 | $1,746,333 | $1,402,000 | $1,651,364 | $1,691,700 | $1,718,507 | $1,839,555 |
| 2024 | $1,367,500 | $2,237,667 | $1,712,543 | $1,908,333 | $1,434,841 | $1,657,864 | $1,578,333 | $1,756,442 | $1,896,145 | |
| 2025 (Up to Q3) | $1,494,815 | $1,710,000 | $2,240,000 | $1,573,722 | $1,969,333 | $1,528,364 | $1,608,686 | $1,717,517 | $1,764,071 | $1,896,857 |
Average 2-bedroom sizes (based on transactions done)
| Year | TANGLIN REGENCY | TANGLIN VIEW | ONE JERVOIS | THE METROPOLITAN CONDOMINIUM | ASCENTIA SKY | ALEX RESIDENCES | ECHELON | THE CREST | PRINCIPAL GARDEN | ARTRA |
| 2017 | 825 | 872 | 1034 | 966 | 975 | 732 | 934 | |||
| 2018 | 821 | 1042 | 856 | 987 | 657 | 732 | 899 | 807 | ||
| 2019 | 883 | 980 | 1029 | 966 | 987 | 732 | 878 | 781 | ||
| 2020 | 775 | 872 | 1024 | 942 | 990 | 678 | 732 | 831 | 795 | 786 |
| 2021 | 778 | 872 | 1028 | 936 | 995 | 666 | 732 | 899 | 802 | 800 |
| 2022 | 857 | 980 | 990 | 931 | 985 | 671 | 732 | 958 | 791 | 813 |
| 2023 | 874 | 872 | 1077 | 831 | 972 | 662 | 732 | 868 | 800 | 798 |
| 2024 | 813 | 1022 | 946 | 965 | 672 | 732 | 811 | 797 | 816 | |
| 2025 (Up to Q3) | 879 | 1034 | 1009 | 853 | 972 | 672 | 732 | 870 | 794 | 804 |
No. of transactions
| Year | TANGLIN REGENCY | TANGLIN VIEW | ONE JERVOIS | THE METROPOLITAN CONDOMINIUM | ASCENTIA SKY | ALEX RESIDENCES | ECHELON | THE CREST | PRINCIPAL GARDEN | ARTRA |
| 2017 | 6 | 3 | 10 | 9 | 5 | 3 | 4 | |||
| 2018 | 10 | 9 | 4 | 10 | 1 | 4 | 48 | 1 | ||
| 2019 | 3 | 3 | 5 | 4 | 7 | 4 | 19 | 2 | ||
| 2020 | 2 | 2 | 8 | 4 | 3 | 2 | 4 | 6 | 8 | 1 |
| 2021 | 6 | 3 | 6 | 11 | 16 | 7 | 12 | 4 | 30 | 6 |
| 2022 | 8 | 3 | 3 | 6 | 6 | 3 | 4 | 3 | 21 | 8 |
| 2023 | 6 | 3 | 2 | 5 | 6 | 9 | 11 | 5 | 14 | 7 |
| 2024 | 4 | 3 | 7 | 9 | 7 | 11 | 3 | 20 | 13 | |
| 2025 (Up to Q3) | 6 | 2 | 4 | 4 | 3 | 11 | 7 | 11 | 21 | 7 |
Notably, The Crest saw a surge of two-bedder sales in 2018 with 48 transactions. This was due to the developer offering a Deferred Payment Scheme (DPS), which helped to drive sales at the time.
For two-bedroom units, The Crest is roughly in the middle of the pack. This is for both quantum and size. Two-bedders here are larger than at Alex Residences or Echelon (around 660 to 732 sq ft), but smaller than the oversized layouts at One Jervois, which often exceed 1,000 sq ft.
However, being in the middle hasn’t translated to better performance for The Crest, and price growth still trails its neighbours.
Average 3-bedroom prices
| Year | TANGLIN REGENCY | TANGLIN VIEW | ONE JERVOIS | THE METROPOLITAN CONDOMINIUM | ASCENTIA SKY | ALEX RESIDENCES | ECHELON | THE CREST | PRINCIPAL GARDEN | ARTRA |
| 2017 | $1,480,000 | $1,373,247 | $2,383,333 | $1,797,000 | $2,184,333 | $1,525,000 | $2,272,500 | $2,493,650 | ||
| 2018 | $1,598,333 | $1,499,056 | $2,662,000 | $1,969,438 | $1,978,000 | $1,750,000 | $1,708,182 | $2,514,004 | ||
| 2019 | $1,561,491 | $1,539,353 | $2,405,000 | $1,990,000 | $2,163,500 | $1,827,500 | $1,928,252 | $2,398,687 | ||
| 2020 | $1,633,333 | $1,545,000 | $2,256,000 | $1,978,648 | $2,154,000 | $1,728,333 | $2,131,148 | $2,273,054 | $2,322,667 | $2,196,667 |
| 2021 | $1,607,000 | $1,574,407 | $2,775,993 | $2,130,555 | $2,145,600 | $1,729,320 | $2,138,588 | $2,444,410 | $2,239,378 | $2,111,500 |
| 2022 | $1,705,000 | $1,818,714 | $3,126,667 | $2,209,600 | $2,694,000 | $1,870,000 | $2,220,273 | $2,303,000 | $2,520,000 | $2,310,000 |
| 2023 | $1,815,000 | $1,928,533 | $2,929,000 | $2,494,000 | $2,599,286 | $1,998,571 | $2,174,789 | $2,426,000 | $2,707,143 | $2,712,444 |
| 2024 | $2,035,000 | $1,994,375 | $2,950,000 | $2,589,722 | $2,763,400 | $2,125,889 | $2,054,025 | $2,420,153 | $2,645,714 | $2,570,736 |
| 2025 (Up to Q3) | $2,325,000 | $2,233,637 | $3,230,000 | $2,751,250 | $2,833,750 | $2,114,099 | $2,715,972 | $2,559,361 | $2,876,700 | $2,776,444 |
Average 3-bedroom sizes (based on transactions done)
| Year | TANGLIN REGENCY | TANGLIN VIEW | ONE JERVOIS | THE METROPOLITAN CONDOMINIUM | ASCENTIA SKY | ALEX RESIDENCES | ECHELON | THE CREST | PRINCIPAL GARDEN | ARTRA |
| 2017 | 1170 | 1187 | 1511 | 1389 | 1475 | 1034 | 1303 | 1386 | ||
| 2018 | 1159 | 1157 | 1570 | 1437 | 1475 | 926 | 1013 | 1312 | ||
| 2019 | 1230 | 1166 | 1324 | 1385 | 1475 | 1009 | 1088 | 1255 | ||
| 2020 | 1206 | 1181 | 1295 | 1403 | 1475 | 964 | 1213 | 1198 | 1184 | 1166 |
| 2021 | 1107 | 1150 | 1476 | 1451 | 1475 | 921 | 1196 | 1275 | 1147 | 1063 |
| 2022 | 1077 | 1166 | 1661 | 1399 | 1630 | 952 | 1124 | 1254 | 1209 | 1044 |
| 2023 | 1071 | 1207 | 1389 | 1461 | 1475 | 944 | 1083 | 1276 | 1213 | 1207 |
| 2024 | 1168 | 1145 | 1367 | 1397 | 1475 | 971 | 963 | 1266 | 1093 | 1076 |
| 2025 (Up to Q3) | 1351 | 1164 | 1292 | 1370 | 1475 | 944 | 1230 | 1293 | 1187 | 1162 |
No. of transactions
| Year | TANGLIN REGENCY | TANGLIN VIEW | ONE JERVOIS | THE METROPOLITAN CONDOMINIUM | ASCENTIA SKY | ALEX RESIDENCES | ECHELON | THE CREST | PRINCIPAL GARDEN | ARTRA |
| 2017 | 3 | 23 | 3 | 10 | 3 | 2 | 4 | 12 | ||
| 2018 | 3 | 18 | 8 | 16 | 10 | 1 | 11 | 66 | ||
| 2019 | 4 | 17 | 2 | 3 | 4 | 4 | 11 | 24 | ||
| 2020 | 3 | 7 | 3 | 6 | 5 | 6 | 6 | 13 | 3 | 3 |
| 2021 | 5 | 12 | 10 | 7 | 10 | 9 | 17 | 10 | 5 | 4 |
| 2022 | 2 | 7 | 3 | 5 | 7 | 11 | 11 | 6 | 3 | 1 |
| 2023 | 2 | 15 | 2 | 7 | 7 | 7 | 10 | 5 | 7 | 11 |
| 2024 | 2 | 8 | 3 | 4 | 7 | 10 | 11 | 11 | 7 | 8 |
| 2025 (Up to Q3) | 2 | 11 | 1 | 4 | 4 | 9 | 4 | 8 | 4 | 9 |
We see the apparent rush to exit after TOP happened with three-bedders as well, with 66 transactions in 2018; the volumes then moderated afterwards, to about four to 12 transactions a year.
The Crest’s three-bedroom units are in the upper-middle range in terms of pricing at $2.3 million to $2.56 million; above projects like Tanglin Regency and Tanglin View, but below One Jervois or Artra.
The higher-end pricing is because three-bedders at The Crest consistently reach 1,250 and 1,390 sq ft, making them larger than many neighbouring counterparts. Only One Jervois and Ascentia Sky regularly exceed The Crest in size.
Average 4-bedroom prices
| Year | TANGLIN VIEW | ONE JERVOIS | THE METROPOLITAN CONDOMINIUM | ASCENTIA SKY | ECHELON | THE CREST | PRINCIPAL GARDEN |
| 2017 | $2,269,000 | $2,560,000 | $2,363,500 | $2,625,000 | $2,750,000 | $3,050,724 | |
| 2018 | $2,390,000 | $3,729,333 | $2,490,000 | $2,672,778 | $2,796,667 | $3,341,769 | |
| 2019 | $2,216,250 | $3,800,000 | $2,720,000 | $2,454,000 | $2,100,000 | $3,621,533 | |
| 2020 | $2,570,000 | $2,700,000 | $2,613,333 | $2,356,667 | $3,584,338 | $3,019,000 | |
| 2021 | $2,308,000 | $3,340,000 | $2,965,018 | $2,482,143 | $2,850,000 | $3,230,705 | $3,988,888 |
| 2022 | $3,125,000 | $4,156,667 | $2,905,000 | $2,902,500 | $2,835,000 | $3,420,000 | $3,364,222 |
| 2023 | $3,700,000 | $3,810,000 | $2,846,250 | $3,136,667 | $3,050,000 | $3,450,000 | |
| 2024 | $3,360,000 | $4,158,888 | $3,407,500 | $3,380,000 | $3,215,000 | $3,280,000 | $3,754,444 |
| 2025 (Up to Q3) | $3,100,000 | $3,300,750 | $3,700,000 | $3,110,000 | $3,500,000 | $3,843,333 |
Average 4-bedroom sizes (based on transactions done)
| Year | TANGLIN VIEW | ONE JERVOIS | THE METROPOLITAN CONDOMINIUM | ASCENTIA SKY | ECHELON | THE CREST | PRINCIPAL GARDEN |
| 2017 | 2051 | 1701 | 1970 | 1792 | 1572 | 1647 | |
| 2018 | 1938 | 2085 | 1737 | 1833 | 1572 | 1669 | |
| 2019 | 1792 | 2454 | 1819 | 1819 | 1572 | 1736 | |
| 2020 | 2009 | 1819 | 1862 | 1572 | 1738 | 1572 | |
| 2021 | 1711 | 1736 | 1985 | 1837 | 1572 | 1681 | 2002 |
| 2022 | 2056 | 2124 | 1790 | 1787 | 1572 | 1741 | 1572 |
| 2023 | 2121 | 1733 | 1736 | 1826 | 1572 | 1744 | |
| 2024 | 2013 | 2368 | 1947 | 1873 | 1572 | 1722 | 1572 |
| 2025 (Up to Q3) | 1711 | 1739 | 1908 | 1572 | 1798 | 1572 |
No. of transactions
| Year | TANGLIN VIEW | ONE JERVOIS | THE METROPOLITAN CONDOMINIUM | ASCENTIA SKY | ECHELON | THE CREST | PRINCIPAL GARDEN |
| 2017 | 2 | 1 | 6 | 2 | 1 | 8 | |
| 2018 | 4 | 3 | 5 | 9 | 3 | 26 | |
| 2019 | 4 | 1 | 2 | 2 | 1 | 13 | |
| 2020 | 3 | 2 | 3 | 3 | 4 | 1 | |
| 2021 | 1 | 4 | 5 | 7 | 1 | 8 | 1 |
| 2022 | 2 | 3 | 3 | 2 | 4 | 4 | 4 |
| 2023 | 1 | 1 | 4 | 3 | 1 | 1 | |
| 2024 | 3 | 1 | 6 | 5 | 2 | 1 | 2 |
| 2025 (Up to Q3) | 1 | 4 | 4 | 3 | 2 | 3 |
The Crest is not particularly distinctive here. The price and size are once again in the middle of the pack; and we again see a pattern with sellers exiting soon after TOP (26 transactions in 2018, before dying down afterward).
Now let’s look at the profitability of the neighbouring projects, to make a comparison
| Project | Gains | Loss | Tnx proportion | |||||||
| Average ROI | Average gains | Average holding period (years) | No. of tnx | Average ROI | Average losses | Average holding period (years) | No. of tnx | % of profitable tnx | % of unprofitable tnx | |
| The Metropolitan | 91.07% | $963,431 | 14 | 151 | ||||||
| Tanglin Regency | 86.55% | $640,966 | 24 | 76 | ||||||
| Tanglin View | 82.02% | $756,651 | 19 | 142 | -11.72% | -$305,064 | 8 | 12 | 92.21% | 7.79% |
| One Jervois | 73.61% | $1,005,588 | 14 | 98 | ||||||
| Ascentia Sky | 26.42% | $452,612 | 11 | 139 | -5.01% | -$117,038 | 7 | 16 | 89.68% | 10.32% |
| ARTRA | 25.98% | $438,201 | 6 | 78 | ||||||
| Principal Garden | 22.49% | $326,208 | 6 | 236 | -3.85% | -$36,000 | 4 | 1 | 99.58% | 0.42% |
| Alex Residences | 15.12% | $207,819 | 8 | 113 | -2.64% | -$34,094 | 5 | 8 | 93.39% | 6.61% |
| Echelon | 12.59% | $218,428 | 9 | 153 | -4.94% | -$107,896 | 8 | 33 | 82.26% | 17.74% |
| The Crest | 10.74% | $215,595 | 7 | 58 | -5.21% | -$126,379 | 5 | 35 | 62.37% | 37.63% |
The Crest has the lowest average ROI among the major projects in the area, and also the highest proportion of unprofitable transactions.
This is all the more glaring when compared to Principal Garden and Artra. Both projects have shorter average holding periods, yet they still achieve higher profitability and fewer loss-making sales.
The unit-level comparisons also hint at buyers’ value perceptions in the area. For one and two-bedders, The Crest’s average prices are higher than or equal to Principal Garden, even though Principal Garden is a newer project. Possibly, potential buyers considering The Crest viewed Principal Garden as an appealing alternative.
A similar pattern appears for the three- and four-bedroom units. The Crest’s average prices in these categories are higher than or close to Echelon, despite Echelon being only a year older (and still having a stronger transaction profit). This could also explain why prospective buyers lean toward other nearby projects. Simply put, The Crest was rarely the most affordable, but also never the most premium option. This middle-of-the-road quality may have left it looking mediocre, as it can’t draw buyers with either the most cost-efficient price or the most compelling luxury angle.
Now let’s look at floor plan comparisons, to see if layout is a factor.

Both projects offer one-bedders in a range of sizes, and the two examples here are in the mid-range for each project.
The Crest’s unit is notably larger than the one at Principal Garden, which means a higher quantum; not always an advantage for compact builds.
In The Crest, the living and dining areas are better segregated, whereas in Principal Garden, they share a combined space. Also note that The Crest’s one-bedder entrance doesn’t open directly into the living room, which some buyers may prefer.
Both layouts include a balcony and an open kitchen, and in both cases, the bathroom is outside the bedroom without direct ensuite access.
The Crest’s unit also incorporates two additional features: a secondary balcony accessed from the master bedroom and a walk-in closet. A second balcony is inefficient for a compact unit though, and could be seen as a drawback.
Overall, given the size difference and the extra spatial features, it makes sense that The Crest commands a higher quantum for its one-bedders. However, these enhancements aren’t the most efficient use of space, which may give the edge to Principal Garden.

Both projects offer two-bedroom units in a wide range of sizes, and the examples here are the smaller three-bedders. We are using units of a comparable size here, but do note that in some layouts, The Crest does have two-bedders with more regular and squarish designs.
Both are two-bedroom, two-bathroom units of the same size. In both units, the living and dining areas are segregated, and each includes a balcony connected to the living room. At The Crest, however, the balcony extends across to the adjacent bedroom, which increases the outdoor area but reduces wall space and flexibility in the second bedroom.
The Crest places its dining area within the open-concept kitchen, which is uncommon but workable. Principal Garden, by contrast, offers an enclosed kitchen, which many buyers prefer these days.
The bedroom sizes also differ. Principal Garden’s common bedrooms are large enough to accommodate double beds comfortably. In The Crest, the common bedroom in this specific layout is better for a single bed. This gives Principal Garden a functional advantage overall.
Overall, while these two units share the same floor area, Principal Garden’s layout makes more efficient use of the available space. Price-wise, the unit at Principal Garden is about $151,000 more, but this is mainly due to it being on a higher floor; if you compare average prices for two-bedders between these two projects, it’s only around $50,000.

Both projects offer three-bedders in a range of sizes. The 1,184 sq ft unit in The Crest sits at the smaller end of its range, while the 861 sq ft unit in Echelon is the smallest three-bedder configuration in that development.
Both are three-bedroom, two-bathroom units. The Crest’s unit has living and dining areas segregated, whereas in Echelon, these spaces sit side by side. Both units include a balcony along the living area, but Echelon’s balcony stretches across both the living and dining areas, giving it a longer frontage.
At The Crest, the kitchen is fully enclosed and includes a yard, utility room, and WC; features that appeal to buyers today. Echelon’s kitchen is partially open, though it can easily be enclosed if preferred.
In both units, one common bedroom fits a single bed more realistically. In The Crest, this smaller bedroom also has a tiny balcony, which is an inefficiency. The master bedroom in The Crest includes a walk-in closet, whereas Echelon’s master does not (but Echelon’s layout does appear to have room for a potential walk-in if you choose to have one). Echelon also separates the vanity from the main bathing area in the master, which some buyers find more efficient.
One recurring issue in The Crest is unit geometry. Because of the building’s architectural design, the two common bedrooms in this layout – and in many of the project’s three-bedroom types – tend to be irregularly shaped. It doesn’t drastically affect functionality, but it can lead to pockets of wasted space.
Given the difference in size and floor levels between these two units, The Crest’s unit transacts higher, but the price gap is quite substantial. In the broader 2025 averages, three-bedders in Echelon actually cost around $150,000 more than those in The Crest, despite having smaller average sizes.
While The Crest offers larger spaces and more auxiliary areas, the prevalence of irregular shapes is a bit of a drawback.

Both projects offer four-bedroom units in a range of sizes. The 1,722 sq ft layout in The Crest sits on the larger end of its four-bedder range, while the 1,572 sq ft layout in Echelon is the largest four-bedder type it has.
The Crest’s unit is a four-bedroom, three-bathroom configuration, compared to Echelon’s four-bedroom, two-bathroom layout.
In both layouts, the living and dining areas are segregated, and each comes with a balcony. The Crest’s balcony is especially expansive, stretching across the living area and the two adjacent bedrooms, while Echelon’s balcony is more modest in scale.
Kitchen spaces in both units are split into wet and dry zones, and each includes a yard, utility room, and WC, offering strong practicality for families with larger households or domestic help.
Both layouts incorporate two ensuite bedrooms. The Crest’s two remaining common rooms are smaller, and both include small balconies. In Echelon, only one of the common rooms is compact, with the other three comfortably fitting double beds. Echelon also has a clear advantage in its master suite, which is especially spacious and comes with a walk-in closet and a dedicated study area.
A recurring issue to point out is the irregular shape of The Crest: its smaller bedrooms tend to be irregular and create pockets of wasted space.
The prices between these two specific units are almost the same, with The Crest costing a little bit more ($20,000). But if we look at average prices for four-bedders, for 2025, we can see that four-bedders in Echelon average almost $400,000 less (although bear in mind they are smaller).
Overall, the smaller common bedrooms and irregular layout seem to be one of the main concerns at The Crest.
Next, let’s look at the rental yields of the units to check out possible appeal to landlords
1-bedroom units
| Project | Average price (2024 to Q3 2025) | Average rent (Q3 2024 to Q3 2025) | Rental yield |
| THE CREST | $1,165,333 | $3,800 | 3.91% |
| PRINCIPAL GARDEN | $950,111 | $3,377 | 4.26% |
| ALEX RESIDENCES | $965,600 | $3,578 | 4.45% |
| ECHELON | $952,222 | $3,714 | 4.68% |
2-bedroom units
| Project | Average price (2024 to Q3 2025) | Average rent (Q3 2024 to Q3 2025) | Rental yield |
| ONE JERVOIS | $2,239,000 | $5,330 | 2.86% |
| PRINCIPAL GARDEN | $1,760,350 | $4,713 | 3.21% |
| TANGLIN VIEW | $1,710,000 | $4,650 | 3.26% |
| TANGLIN REGENCY | $1,443,889 | $4,090 | 3.40% |
| ASCENTIA SKY | $1,923,583 | $5,590 | 3.49% |
| THE CREST | $1,687,692 | $5,001 | 3.56% |
| THE METROPOLITAN CONDOMINIUM | $1,662,063 | $4,976 | 3.59% |
| ECHELON | $1,638,739 | $4,907 | 3.59% |
| ALEX RESIDENCES | $1,491,994 | $4,511 | 3.63% |
| ARTRA | $1,896,394 | $5,891 | 3.73% |
3-bedroom units
| Project | Average price (2024 to Q3 2025) | Average rent (Q3 2024 to Q3 2025) | Rental yield |
| ONE JERVOIS | $3,020,000 | $6,848 | 2.72% |
| TANGLIN REGENCY | $2,180,000 | $5,473 | 3.01% |
| PRINCIPAL GARDEN | $2,729,709 | $6,905 | 3.04% |
| TANGLIN VIEW | $2,132,895 | $5,576 | 3.14% |
| THE METROPOLITAN CONDOMINIUM | $2,670,486 | $7,128 | 3.20% |
| THE CREST | $2,478,767 | $6,773 | 3.28% |
| ASCENTIA SKY | $2,788,982 | $7,681 | 3.30% |
| ARTRA | $2,679,640 | $7,913 | 3.54% |
| ECHELON | $2,230,544 | $6,679 | 3.59% |
| ALEX RESIDENCES | $2,120,304 | $6,387 | 3.61% |
4-bedroom units
| Project | Average price (2024 to Q3 2025) | Average rent (Q3 2024 to Q3 2025) | Rental yield |
| ONE JERVOIS | $4,158,888 | $8,970 | 2.59% |
| PRINCIPAL GARDEN | $3,807,778 | $9,263 | 2.92% |
| THE CREST | $3,426,667 | $8,915 | 3.12% |
| ASCENTIA SKY | $3,522,222 | $9,171 | 3.12% |
| TANGLIN VIEW | $3,295,000 | $8,850 | 3.22% |
| ECHELON | $3,152,000 | $8,525 | 3.25% |
| THE METROPOLITAN CONDOMINIUM | $3,364,800 | $9,165 | 3.27% |
There isn’t much to say here. The Crest has a lower rental yield than most neighbours for its one-bedders, but that’s because it has the highest average prices for one-bedders.
In other regards, rental yield is in the mid-range of the pack. As a whole, the yields shown are typical of condos in the wider RCR.
Next, let’s look at the performance of other projects that launched the same year as The Crest. This is to check for market factors that may have impacted its performance, which we should also see in most other projects in the same cohort.
| Project | MARINA ONE RESIDENCES | SOPHIA HILLS | THE CREST | KALLANG RIVERSIDE | THE SANTORINI | COMMONWEALTH TOWERS | RIVERTREES RESIDENCES | THE PANORAMA | COCO PALMS |
| Tenure | 99-year | 99-year | 99-year | Freehold | 99-year | 99-year | 99-year | 99-year | 99-year |
| District | 1 | 9 | 3 | 12 | 18 | 3 | 28 | 20 | 18 |
| No. of units | 1042 | 493 | 469 | 212 | 597 | 845 | 487 | 698 | 944 |
| Completion year | 2017 | 2018 | 2017 | 2018 | 2017 | 2017 | 2017 | 2017 | 2018 |
| Year | MARINA ONE RESIDENCES | SOPHIA HILLS | THE CREST | KALLANG RIVERSIDE | THE SANTORINI | COMMONWEALTH TOWERS | RIVERTREES RESIDENCES | THE PANORAMA | COCO PALMS |
| 2014 | $2,243 | $2,239 | $1,762 | $2,128 | $1,123 | $1,632 | $1,109 | $1,289 | $1,024 |
| 2015 | $2,315 | $1,910 | $1,703 | $2,025 | $1,136 | $1,738 | $1,050 | $1,229 | $1,016 |
| 2016 | $2,318 | $1,932 | $1,706 | $2,447 | $1,080 | $1,702 | $1,064 | $1,234 | $1,054 |
| 2017 | $2,423 | $2,008 | $1,724 | $2,260 | $1,037 | $1,735 | $1,073 | $1,307 | $1,078 |
| 2018 | $2,539 | $2,186 | $1,998 | $2,288 | $1,159 | $1,917 | $1,233 | $1,524 | $1,241 |
| 2019 | $2,443 | $2,030 | $2,016 | $2,414 | $1,135 | $1,852 | $1,204 | $1,516 | $1,222 |
| 2020 | $2,367 | $1,992 | $1,955 | $2,362 | $1,151 | $1,836 | $1,177 | $1,468 | $1,227 |
| 2021 | $2,451 | $1,959 | $1,915 | $2,440 | $1,171 | $1,895 | $1,221 | $1,536 | $1,251 |
| 2022 | $2,474 | $2,020 | $1,936 | $2,608 | $1,253 | $1,970 | $1,301 | $1,759 | $1,359 |
| 2023 | $2,297 | $2,101 | $1,935 | $2,541 | $1,373 | $2,091 | $1,408 | $1,901 | $1,497 |
| 2024 | $2,098 | $2,132 | $1,918 | $2,341 | $1,397 | $2,200 | $1,478 | $1,974 | $1,634 |
| 2025 (Up to Q3) | $2,065 | $2,121 | $1,959 | $2,392 | $1,461 | $2,227 | $1,562 | $2,023 | $1,654 |
| Annualised | -0.75% | -0.49% | 0.97% | 1.07% | 2.42% | 2.86% | 3.17% | 4.19% | 4.45% |
Overall, the results are mixed. The Crest is the third lowest performer but not the worst, with Marina One Residences and Sophia Hills showing negative annualised growth.
By comparison, mass-market projects such as The Santorini, Rivertrees Residences, The Panorama, and Coco Palms all saw stronger gains, with annualised growth ranging from 2.4 per cent to over 4.4 per cent. Notably, Commonwealth Towers, which is also located in D3 and shares a similar launch period and 99-year tenure, achieved a much higher growth rate of 2.86 per cent.
While some projects in the same cohort underperformed, nothing here suggests market factors that would have substantially impacted The Crest.
Conclusion
The Crest’s annualised growth rate trails leasehold projects islandwide, as well as those in D3. Among neighbouring developments, its resale performance has also been the weakest from 2023 to Q3 2025, with the caveat that it has had a relatively short holding period.
The Crest’s one-bedders may have an issue because they have the largest average sizes and hence the highest quantum compared to neighbours. Again, larger sizes may not be an advantage in this segment, where lower capital commitment (for investors) and lower prices (for singles trying to buy a home on a single income) take precedence.
Meanwhile, the rest of its unit types tend to sit in the mid-range compared to nearby projects. Some may even call that expensive, though: for three- and four-bedders, average prices in The Crest are higher or on par with those in Echelon, which is only a year older. Besides this, it may have a middle-of-the-road effect where it’s not cost-efficient enough to be sold on price, but also not positioned as a peak offering, where it can be sold on aspirational luxury.
Another issue is the irregularity of the unit shapes. The architecture of The Crest is unique, elegant, and creative – but unfortunately, the Singapore market doesn’t always reward that. We can be ruthlessly practical, so buyers may simply see wasted corners or units that need more custom work in renovations.
That said, The Crest has had a rather short window to prove itself, so there’s still time for a course correction – and with newer projects shrinking rapidly, the larger units at The Crest may have an allure for buyers who loathe the current trend.
Follow us on Stacked Pro as we continue to take deep dives into underperforming projects and why they may be struggling.
Ryan J
A seasoned content strategist with over 17 years in the real estate and financial journalism sectors, Ryan has built a reputation for transforming complex industry jargon into accessible knowledge. With a track record of writing and editing for leading financial platforms and publications, Ryan's expertise has been recognised across various media outlets. His role as a former content editor for 99.co and a co-host for CNA 938's Open House programme underscores his commitment to providing valuable insights into the property market.Read next from Property Investment Insights
Property Investment Insights These 5 Condos In Singapore Sold Out Fast in 2018 — But Which Ones Really Rewarded Buyers?
Property Investment Insights Why This New Condo in a Freehold-Dominated Enclave Is Lagging Behind
Property Investment Insights Why This Mixed-Use Condo at Dairy Farm Is Lagging Behind the Market
Property Investment Insights How This Singapore Property Investor Went From Just One Property to Investing in Warehouses and UK Student Housing
Latest Posts
Property Market Commentary Condos With Only One Transaction in 10 Years: What Makes Owners Stay
Property Market Commentary 5 Upcoming Executive Condo Sites in 2026: Which Holds the Most Promise for Buyers?
Singapore Property News A Housing Issue That Slips Under the Radar in a Super-Aged Singapore: Here’s What Needs Attention
Landed Home Tours Inside One of Orchard’s Rarest Freehold Enclaves: Conserved Homes You Can Still Buy From $6.8M
On The Market We Found The Cheapest 4-Bedroom Condos You Can Still Buy from $2.28M
Homeowner Stories “I Thought I Could Wait for a Better New Launch Condo” How One Buyer’s Fear Ended Up Costing Him $358K
Editor's Pick This New Pasir Ris EC Starts From $1.438M For A 3-Bedder: Here’s What You Should Know
Singapore Property News This 5 Room Clementi Flat Just Hit a Record $1.488M — Here’s What the Sellers Took Home
Property Market Commentary We Analysed Dual-Key Condo Units Across 2, 3 and 4 Bedders — And One Clear Pattern Emerged
Editor's Pick We Toured A Quiet Landed Area In Central Singapore Where Terraces Have Sold Below $8 Million
Singapore Property News Are Singaporeans Moving Away From Property As A Retirement Strategy?
Editor's Pick Are New Launch Condos Really Getting Cheaper in 2025? The Truth Isn’t What You Think
Editor's Pick How We Saved $300K And Got Our 4-Room Toa Payoh Flat in Just 7 Months
On The Market These Are Singapore’s Most Expensive HDBs for Sale This Week — Including One Priced at $1.89M
New Launch Condo Analysis The Sen Pricing Review: How This $2,199 PSF Launch Compares to Nearby New and Resale Condos