

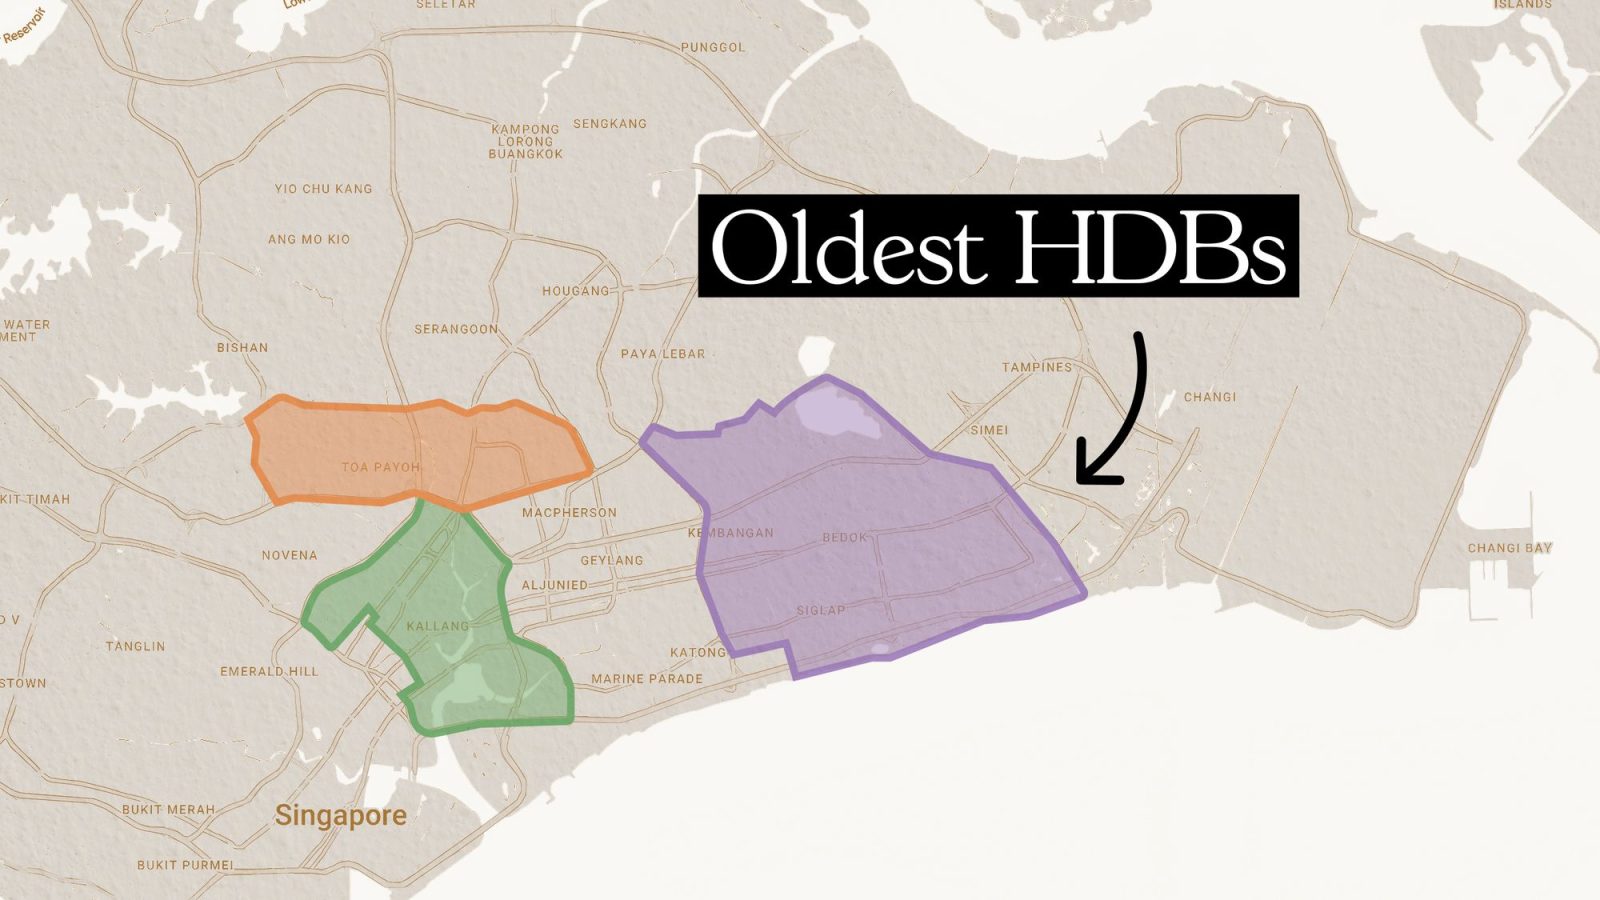
With the end of SERS, one of the predicted effects is a rush to sell off older HDB flats. Without any more chance at a lucrative, government-aided exit, those who still want to upgrade (or just move to somewhere with a longer lease) will likely make their move soon. But for older Singaporeans, this represents an unprecedented opportunity: perhaps now is your chance to snag a flat in a mature neighbourhood, at prices that are no longer as high. For these buyers, here’s a quick look at where you’ll find the oldest HDB flats (and the rough cost you might get them at):
A shortlist filtered by price, size or tenure is a useful way to narrow your options, but it won't tell you which property is the best fit for your finances, lifestyle or long-term plans.
That's where the real evaluation begins: comparing the trade-offs between each option to decide which one makes the most sense for your situation.
Over time, that's also why we decided to work with agents who shared the same data-driven and advisory-led approach behind our editorial, consultants who could help readers think through decisions more objectively, rather than simply push transactions.
Today, the team has worked with more than 2,000 clients across over $5B in property transactions.
What counts as an “old” HDB flat?
For all intents and purposes, we will consider these to be flats that are currently 50 years old or more (i.e., more than half the lease is over). These are typically found in the first wave of HDB towns built between the 1960s and 1970s: Toa Payoh, Queenstown, Bukit Merah, Marine Parade, and the Central Area.
| Year | BEDOK | BISHAN | BUKIT MERAH | BUKIT TIMAH | CENTRAL AREA | GEYLANG | HOUGANG | JURONG EAST | JURONG WEST | KALLANG/WHAMPOA | MARINE PARADE | QUEENSTOWN | TOA PAYOH | WOODLANDS |
| 2014 | $322,095 | $292,273 | $404,574 | $430,071 | $414,719 | $290,951 | $288,321 | $281,225 | $355,993 | $406,175 | $369,369 | $335,355 | $274,467 | |
| 2015 | $307,000 | $278,875 | $396,731 | $407,500 | $417,000 | $271,072 | $260,067 | $274,500 | $259,931 | $353,798 | $407,541 | $370,177 | $312,570 | $262,409 |
| 2016 | $286,435 | $269,126 | $364,129 | $379,000 | $399,299 | $265,405 | $252,838 | $250,000 | $253,550 | $335,963 | $402,551 | $366,712 | $302,803 | $248,838 |
| 2017 | $284,460 | $274,833 | $370,018 | $430,000 | $380,170 | $254,697 | $256,000 | $227,333 | $236,769 | $319,411 | $403,840 | $356,547 | $296,234 | $242,750 |
| 2018 | $265,895 | $262,056 | $337,727 | $417,143 | $382,423 | $247,391 | $232,000 | $225,333 | $215,170 | $309,993 | $393,055 | $331,769 | $265,780 | $224,526 |
| 2019 | $257,020 | $260,667 | $326,112 | $435,071 | $376,957 | $230,730 | $215,667 | $219,000 | $202,134 | $329,942 | $356,487 | $306,495 | $249,405 | $215,876 |
| 2020 | $266,875 | $258,156 | $336,837 | $417,222 | $377,838 | $224,295 | $222,236 | $222,000 | $222,450 | $317,295 | $353,689 | $310,168 | $249,440 | $217,250 |
| 2021 | $296,000 | $276,861 | $358,764 | $419,222 | $384,551 | $261,733 | $268,286 | $253,000 | $258,746 | $346,063 | $380,577 | $343,776 | $284,618 | $256,889 |
| 2022 | $320,954 | $302,579 | $381,478 | $448,286 | $410,000 | $294,697 | $309,464 | $277,235 | $365,981 | $412,677 | $358,563 | $328,395 | $296,000 | |
| 2023 | $347,375 | $334,455 | $402,297 | $468,667 | $404,800 | $309,694 | $319,148 | $325,000 | $292,858 | $362,885 | $439,862 | $378,269 | $344,082 | $304,375 |
| 2024 | $368,828 | $356,141 | $426,912 | $488,111 | $417,294 | $326,821 | $324,167 | $330,000 | $310,201 | $414,054 | $455,177 | $394,025 | $367,953 | $323,625 |
| 2025 (up till June) | $406,800 | $359,155 | $442,499 | $500,000 | $458,818 | $340,387 | $354,924 | $360,000 | $327,717 | $407,982 | $477,247 | $430,872 | $378,953 | $342,523 |
| % increase from 2014 to June 2025 | 26.30% | 22.88% | 9.37% | 16.26% | 10.63% | 16.99% | 23.10% | 16.53% | 14.60% | 17.50% | 16.65% | 13.00% | 24.80% |
Many of these older 3-room flats can be found in Bedok, Kallang/Whampoa, and Toa Payoh, as seen from the consistent resale activity for flats built before 1975. Many of them are still changing hands at just under $400,000 on average.
As an aside, some of the oldest 3-room flats are the ones built in Tiong Bahru by SIT (the predecessor to HDB). These flats can be much larger, with two toilets, a balcony, and a more generous service yard, but they rarely pop up on the market.
Also note that some of the SIT-era landed projects, which are still HDB projects and very old, are described as being 3-room. We would consider these to be special exceptions, and listings are very rare.
4-room flats
| Year | BEDOK | BISHAN | BUKIT MERAH | BUKIT TIMAH | CENTRAL AREA | GEYLANG | HOUGANG | JURONG WEST | KALLANG/WHAMPOA | MARINE PARADE | QUEENSTOWN | TOA PAYOH | WOODLANDS |
| 2014 | $404,000 | $375,000 | $478,453 | $600,000 | $476,500 | $441,250 | $370,500 | $444,384 | $543,472 | $579,951 | $467,813 | $318,500 | |
| 2015 | $383,333 | $505,856 | $547,500 | $495,750 | $398,333 | $330,000 | $442,076 | $520,286 | $549,750 | $440,773 | $295,000 | ||
| 2016 | $370,000 | $377,500 | $461,816 | $569,625 | $456,000 | $459,250 | $320,000 | $445,825 | $508,176 | $596,150 | $436,609 | $268,500 | |
| 2017 | $376,963 | $388,000 | $477,495 | $563,333 | $493,333 | $395,750 | $347,500 | $418,520 | $493,577 | $567,217 | $422,536 | $280,000 | |
| 2018 | $375,000 | $368,000 | $407,245 | $572,825 | $508,000 | $395,000 | $329,000 | $420,181 | $507,368 | $508,246 | $413,376 | $244,333 | |
| 2019 | $370,972 | $354,000 | $429,673 | $540,300 | $483,000 | $351,900 | $327,500 | $405,364 | $487,375 | $492,414 | $385,278 | $245,750 | |
| 2020 | $357,667 | $355,000 | $452,324 | $547,515 | $460,000 | $443,229 | $301,667 | $302,000 | $398,750 | $463,510 | $494,144 | $375,956 | $251,000 |
| 2021 | $391,600 | $381,500 | $431,235 | $525,231 | $525,300 | $424,167 | $330,000 | $340,000 | $433,963 | $481,042 | $527,397 | $419,765 | $326,000 |
| 2022 | $421,014 | $402,625 | $473,909 | $580,726 | $471,500 | $430,000 | $395,000 | $471,963 | $521,509 | $548,587 | $460,955 | $348,000 | |
| 2023 | $422,500 | $441,778 | $544,263 | $607,922 | $569,000 | $497,333 | $393,000 | $388,000 | $517,614 | $546,105 | $570,087 | $454,082 | $378,333 |
| 2024 | $456,178 | $432,378 | $491,684 | $602,717 | $525,000 | $501,222 | $450,000 | $513,682 | $539,757 | $558,747 | $506,377 | $371,667 | |
| 2025 (up till June) | $488,000 | $505,033 | $499,125 | $625,000 | $479,333 | $465,000 | $547,813 | $621,598 | $605,161 | $527,333 | $417,000 | ||
| % increase from 2014 to June 2025 | 20.79% | 34.68% | 4.32% | 4.17% | 8.63% | 25.51% | 23.27% | 14.38% | 4.35% | 12.72% | 30.93% |
Many of these were found in Bedok, Kallang/Whampoa, and Toa Payoh, as seen from the consistent resale activity for flats built before 1975. These towns still show regular transactions involving 50-year-old units, unlike newer estates, where none exist
We would expect a premium for the more famous areas like Marine Parade or Bukit Timah; at least partly because the alternatives there (e.g., condos) are so much pricier. If you really want to live in those areas, the ageing resale flats may be as low as it gets
5-room flats
| Year | BEDOK | BISHAN | BUKIT MERAH | BUKIT TIMAH | CENTRAL AREA | GEYLANG | HOUGANG | JURONG WEST | KALLANG/WHAMPOA | MARINE PARADE | QUEENSTOWN | TOA PAYOH | WOODLANDS |
| 2014 | $680,000 | $734,600 | $870,000 | $600,000 | $603,182 | $790,450 | $833,468 | $654,333 | |||||
| 2015 | $642,667 | $748,333 | $851,000 | $490,000 | $586,600 | $786,244 | $890,648 | $573,000 | |||||
| 2016 | $657,500 | $688,000 | $909,167 | $537,500 | $625,091 | $798,870 | $868,333 | $560,000 | |||||
| 2017 | $608,467 | $664,654 | $897,667 | $475,333 | $637,500 | $830,882 | $802,818 | $561,472 | |||||
| 2018 | $606,667 | $515,000 | $697,000 | $875,750 | $573,888 | $448,000 | $615,200 | $814,953 | $749,818 | $630,000 | |||
| 2019 | $620,250 | $473,000 | $707,000 | $845,667 | $569,250 | $771,750 | $761,900 | $530,571 | |||||
| 2020 | $569,500 | $679,167 | $870,000 | $439,000 | $396,000 | $559,778 | $771,020 | $725,000 | $515,000 | ||||
| 2021 | $625,800 | $661,400 | $896,667 | $578,000 | $620,583 | $793,507 | $788,286 | $549,000 | |||||
| 2022 | $625,481 | $849,486 | $926,000 | $565,000 | $632,222 | $844,664 | $806,861 | $633,489 | |||||
| 2023 | $654,000 | $845,600 | $970,000 | $680,000 | $688,300 | $875,318 | $878,350 | $677,750 | |||||
| 2024 | $742,600 | $888,413 | $969,600 | $850,000 | $738,388 | $651,500 | $743,170 | $939,837 | $877,667 | $699,000 | |||
| 2025 (up till June) | $714,463 | $827,667 | $951,963 | $686,500 | $764,555 | $937,636 | $1,013,250 | $749,500 | $620,000 | ||||
| % increase from 2014 to June 2025 | 5.07% | 12.67% | 9.42% | 14.42% | 26.75% | 18.62% | 21.57% | 14.54% |
Again, we see the largest number of transactions in Bedok, Kallang/Whampoa, and Toa Payoh.
Despite their age, the prices are still high: even in well-connected central areas like Kallang/Whampoa and Toa Payoh, some of these 50-year-old flats are barely staying under $800,000 on average. We probably don’t need to tell you that the most desirable ones, like DBSS flats at Dawson or at Pinnacle @ Duxton, are famous for breaching the million-dollar mark.
The main takeaway
If you’re hunting for an old but central home, your search will likely lead you to Bedok, Kallang/Whampoa, or Toa Payoh; these veteran HDB towns that still see active transactions for older flats, suggesting interested sellers.
For famous enclaves like Marine Parade, transaction data suggests that listings in these areas will be infrequent, so we wouldn’t count on finding what you want.
From the above, you can expect to spend roughly:
- Around $400,000 for a 3-room
- $500,000 to $600,000 for a 4-room
- $750,000 – $850,000for a 5-room
These flats may not have much runway left on their leases, but they offer something that most of us couldn't otherwise afford: size and mature surroundings, at prices below $1 million. And given that we’ve only just heard about the end of SERS, there’s a real likelihood the prices could dip even more if you can wait longer.
Just be sure that it’s the end point of your property journey, as it’s very possible that you’ll incur a loss if you try to sell them another decade down the road.
A shortlist sorted by one variable is a fast way to narrow your options, but the pick that's cheapest, biggest, or most convenient isn't always the one that fits your situation best.
If you'd like to discuss how this applies to your own circumstances, you can reach out for a one-to-one consultation here.
And if you simply have a question or want to share a thought, feel free to write to us at stories@stackedhomes.com. We read every message.





0 Comments