


Resale flat prices have been at a high since Covid, but perhaps they’re finally beginning to level off. And while owners have been cheering their strong appreciation, resale flat prices are quite the nightmare for first-time home buyers or couples who can’t wait for long BTO construction periods. In the interest of this, we’ve compiled a list of places where resale flat prices are showing signs of dipping.
Data collected: We looked at HDB transactions from April 2023 and calculated their respective $PSF values. We then compared their $PSF values and calculated their increase or decrease, averaged it out and ranked them.
So many readers write in because they're unsure what to do next, and don't know who to trust.
If this sounds familiar, we offer structured 1-to-1 consultations where we walk through your finances, goals, and market options objectively.
No obligation. Just clarity.
Learn more here.
Resale flats that are 10 years old or newer
| Estate | 2023-05 | 2023-06 | 2023-07 | 2023-08 | 2023-09 | 2023-10 | 2023-11 | 2023-12 | 2024-01 | 2024-02 | 2024-03 | 2024-04 | Average |
| SEMBAWANG | -2.2% | 0.8% | -0.5% | 0.3% | 0.4% | 0.8% | 2.1% | -1.3% | -0.6% | 0.3% | 2.2% | -5.6% | -0.3% |
| BUKIT BATOK | 0.9% | 4.4% | -4.2% | -0.1% | -0.8% | 1.5% | -2.0% | -2.3% | 1.5% | 1.4% | 1.3% | -3.7% | -0.2% |
| YISHUN | -0.1% | -0.1% | 0.0% | 1.8% | -1.4% | 0.8% | -0.5% | -0.1% | 1.3% | 0.0% | 1.7% | -4.0% | -0.1% |
| BUKIT MERAH | -7.0% | 3.1% | 4.9% | -2.6% | 3.5% | 1.0% | -4.9% | 6.5% | -2.3% | -1.8% | 3.1% | -3.0% | 0.0% |
| HOUGANG | 4.2% | -6.3% | 9.5% | -3.2% | -5.8% | 2.4% | 0.7% | 1.8% | 0.4% | 2.4% | -0.9% | -2.1% | 0.2% |
| SENGKANG | -2.5% | 1.0% | 1.3% | -2.0% | 1.9% | 1.8% | -3.9% | 5.5% | -2.2% | 1.8% | -0.4% | 1.0% | 0.3% |
| JURONG WEST | -6.4% | 1.5% | 2.5% | 1.1% | 0.3% | -1.1% | -1.3% | 4.9% | 3.5% | -8.7% | -0.8% | 8.2% | 0.3% |
| PASIR RIS | 9.1% | -14.3% | 6.9% | 1.4% | -0.5% | 0.4% | 1.4% | -4.1% | -1.6% | 4.5% | 0.3% | ||
| BEDOK | 6.6% | 2.8% | -1.4% | -3.6% | -1.4% | 3.5% | 3.2% | -5.7% | 6.8% | 1.4% | -5.9% | -1.3% | 0.4% |
| CLEMENTI | 0.8% | 4.4% | -2.2% | -2.0% | -2.9% | 6.6% | -7.9% | 11.1% | -4.0% | 0.4% | 0.4% | ||
| PUNGGOL | 1.1% | 1.2% | -0.8% | 2.9% | -3.2% | 1.7% | 1.3% | -0.1% | 1.6% | 2.4% | -0.4% | -2.0% | 0.5% |
| CHOA CHU KANG | 2.2% | -0.9% | 2.7% | -1.8% | -0.5% | 2.1% | -3.3% | 2.5% | 2.3% | -2.5% | 5.0% | -0.7% | 0.6% |
| QUEENSTOWN | 1.9% | 0.8% | 5.6% | -2.2% | 0.8% | 3.2% | -6.8% | 6.1% | 0.1% | 2.2% | -5.0% | 0.7% | 0.6% |
| ANG MO KIO | 9.5% | 0.1% | -8.5% | 8.0% | 1.3% | 0.5% | -6.6% | 6.0% | -1.7% | -1.2% | 1.5% | -0.8% | 0.7% |
| WOODLANDS | 0.3% | 0.9% | 1.4% | 2.6% | 0.5% | -1.0% | 1.9% | 0.7% | 0.0% | 2.2% | -2.3% | 1.7% | 0.7% |
| TOA PAYOH | -0.4% | -1.6% | 14.3% | -17.3% | 2.1% | 5.0% | -5.9% | -1.7% | 9.9% | 1.2% | 0.5% | 3.2% | 0.8% |
| TAMPINES | 2.3% | 7.6% | -6.5% | 1.3% | 4.5% | -5.2% | 7.7% | -3.4% | 3.2% | -2.4% | 1.6% | -0.4% | 0.9% |
| BUKIT PANJANG | 7.5% | 5.8% | -7.5% | -3.3% | 6.4% | -2.1% | 4.8% | 4.0% | -3.2% | -2.0% | -0.3% | 3.0% | 1.1% |
| KALLANG/WHAMPOA | 9.3% | -8.3% | 10.3% | 0.2% | -5.8% | 20.0% | -15.4% | 7.0% | 2.0% | -3.6% | 3.0% | 1.7% | 1.7% |
Some notable details
Prices for flats of this age haven’t dipped much, and even the biggest decrease – a dip of 0.28 per cent in Sembawang – is frankly negligible.
It’s unsurprising as flats that are five years old (i.e sold right after MOP) tend to have a high premium: they combine the benefits of negligible lease decay, with ready-to-move-in status; you may not even need to renovate, given the newness of the flat.
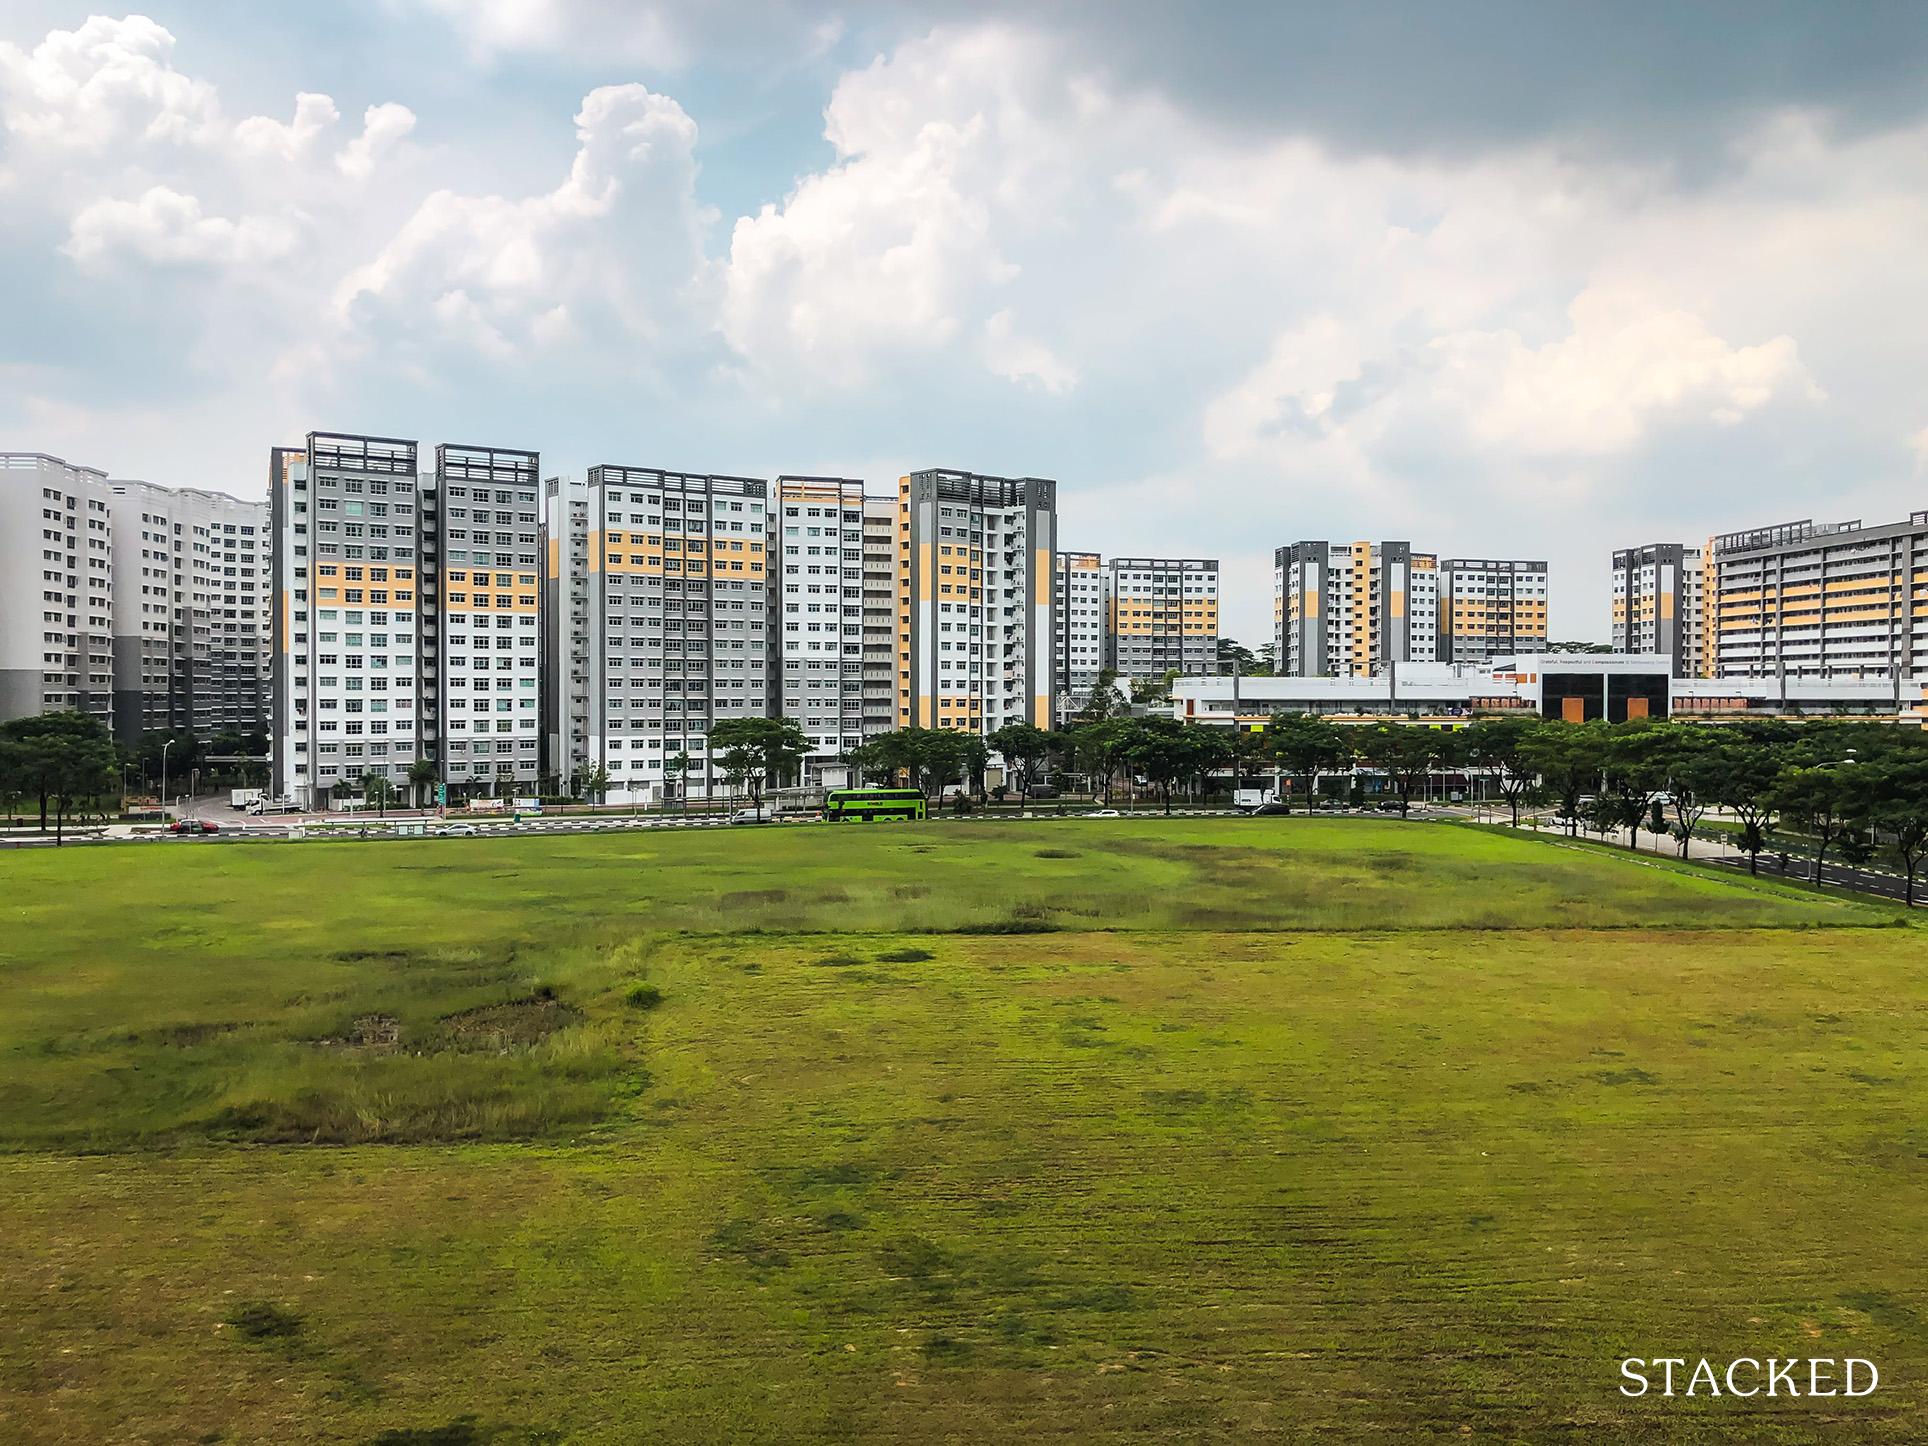
What’s surprising is that Sembawang topped the list here, as Sembawang is particularly known for its sharp price spike over the past few years. We would also expect Sembwang to see stronger gains, given its reputation as a neighbourhood for young families. But again, a price movement of – 0.28 per cent isn’t significant at all; and we wouldn’t read too much into it.
Bukit Batok and Yishun follow closely behind, but also with price dips that won’t help your pocket much. If you want a cheaper resale flat in this current market, you’ll probably have to look for something older.
Resale flats that are 11 to 20 years old
| Estate | 2023-05 | 2023-06 | 2023-07 | 2023-08 | 2023-09 | 2023-10 | 2023-11 | 2023-12 | 2024-01 | 2024-02 | 2024-03 | 2024-04 | Average |
| JURONG WEST | -13.9% | -0.2% | 2.7% | 8.8% | -9.4% | -5.3% | 6.3% | 0.8% | 0.8% | -10.8% | 14.1% | -0.6% | |
| YISHUN | 1.8% | -1.3% | -2.3% | 5.8% | -5.3% | 0.4% | -0.7% | 2.8% | 4.2% | 5.8% | -12.7% | -0.1% | |
| PUNGGOL | 1.4% | -0.3% | 1.9% | -0.4% | 2.6% | -3.5% | 2.5% | 0.0% | 3.3% | 1.0% | 1.0% | -6.8% | 0.2% |
| KALLANG/WHAMPOA | -0.6% | 0.7% | -1.3% | 5.2% | 0.7% | -4.7% | 7.3% | 7.6% | -9.2% | 0.6% | -1.0% | 3.5% | 0.7% |
| SENGKANG | -0.3% | -2.4% | 0.0% | 4.5% | -2.6% | 6.2% | -2.2% | -0.4% | 0.3% | -1.7% | 5.0% | 3.9% | 0.9% |
| BEDOK | -11.6% | 11.8% | -15.8% | -11.8% | 19.8% | -8.3% | 12.7% | -3.2% | 4.3% | -13.6% | 25.1% | 1.3% | 0.9% |
| QUEENSTOWN | 1.7% | -2.5% | 11.6% | -5.5% | -6.8% | 10.9% | -6.4% | 0.3% | 6.3% | -1.5% | 2.2% | 0.9% | |
| BUKIT MERAH | -1.7% | 5.2% | -4.2% | 2.3% | -2.5% | -5.9% | 10.2% | -7.8% | 7.9% | -2.1% | 5.0% | 5.1% | 1.0% |
| GEYLANG | 2.4% | 4.8% | 4.5% | -3.2% | 0.5% | -1.7% | 2.9% | -0.3% | 5.0% | -4.4% | 1.1% | ||
| TOA PAYOH | 3.5% | 7.9% | -6.8% | -3.6% | 5.2% | 3.0% | -0.8% | 2.8% | -1.1% | 2.5% | -2.3% | 4.0% | 1.2% |
| SEMBAWANG | -0.8% | -1.6% | -4.1% | 7.7% | -3.3% | 4.5% | 1.5% | 8.7% | -2.6% | 5.4% | 1.6% | ||
| CENTRAL AREA | 2.8% | -8.5% | 14.6% | -4.1% | 5.0% | 0.0% | -8.5% | 7.8% | 14.9% | 2.7% |
Some notable details
Only two towns saw a dip in prices, Jurong West and Yishun. Jurong West is still one of the most affordable HDB towns in general – note that this is one of the last four HDB towns where we’ve yet to see a flat reach $1 million.
This may not be the case for long though, as some 5-room flats in Jurong West are creeping past the $850,000 mark. But if you’re not looking for anything special, like DBSS flats, areas such as Boon Lay or Jurong West Street 61 still have 5-room flats for well below $600,000, so it’s still one of the most affordable areas.
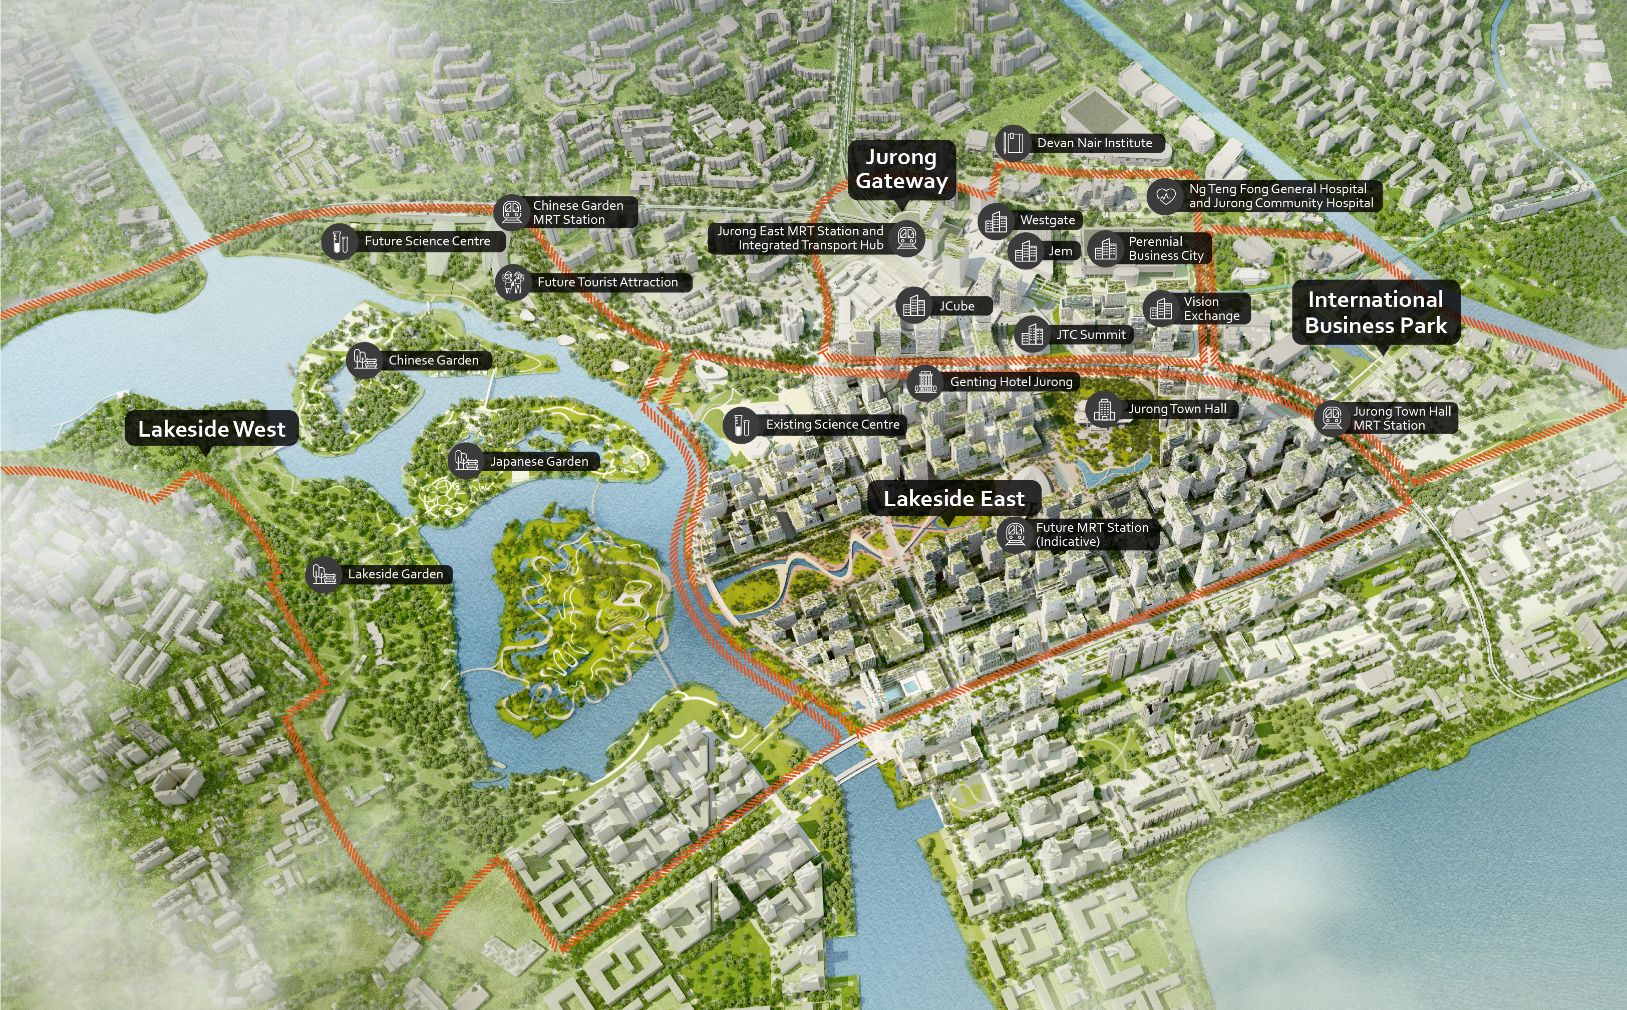
Jurong West may also be suffering from contrast: the Jurong East area saw such a dramatic transformation over the past few years, that Jurong West comes off as a poor man’s counterpart to it. While Jurong East is the “second CBD” of Singapore, Jurong West tends to be regarded as still industrial or “ulu,” or a place where industrial park workers rent their units.
Resale flats that are 21 to 30 years old
| Estate | 2023-05 | 2023-06 | 2023-07 | 2023-08 | 2023-09 | 2023-10 | 2023-11 | 2023-12 | 2024-01 | 2024-02 | 2024-03 | 2024-04 | Average |
| ANG MO KIO | -12.5% | 6.6% | -16.5% | 7.5% | 2.8% | 2.8% | -12.9% | 16.2% | -26.9% | -3.7% | |||
| BUKIT MERAH | -6.3% | 12.3% | -9.6% | 2.8% | -7.3% | 1.2% | 3.4% | 4.6% | 8.7% | 6.8% | -7.4% | -13.6% | -0.4% |
| BUKIT BATOK | -0.3% | -2.8% | 10.7% | -6.7% | 3.4% | 2.2% | -2.2% | -2.5% | -0.6% | 5.3% | -7.5% | -1.3% | -0.2% |
| HOUGANG | -0.5% | 4.0% | -2.4% | -2.7% | 8.5% | -3.6% | -4.5% | 3.6% | 1.4% | 1.1% | -2.8% | -2.2% | 0.0% |
| JURONG WEST | 1.1% | 1.9% | -0.5% | 0.4% | -0.1% | 0.8% | 0.6% | -0.2% | 4.3% | -1.5% | 0.3% | -6.9% | 0.0% |
| BUKIT PANJANG | 1.4% | -0.9% | 8.0% | -7.1% | -6.2% | 3.7% | 3.6% | -0.1% | 0.4% | 0.6% | -3.5% | 1.0% | 0.1% |
| PUNGGOL | 1.5% | 2.0% | -2.4% | 0.2% | -5.0% | 5.0% | 0.8% | 1.0% | 3.3% | -1.7% | 0.0% | -3.4% | 0.1% |
| WOODLANDS | 0.6% | 1.9% | -2.5% | 3.0% | -0.3% | -0.7% | 1.7% | 2.9% | -2.9% | 0.9% | 2.0% | -4.6% | 0.2% |
| CHOA CHU KANG | 3.1% | 0.7% | -4.2% | 4.0% | -0.3% | -0.4% | 1.8% | -1.0% | 1.2% | -2.2% | 3.2% | -1.8% | 0.3% |
| QUEENSTOWN | 3.0% | 6.7% | -9.1% | 8.3% | 3.2% | 2.3% | -9.8% | -2.1% | 6.1% | -5.3% | 0.3% | ||
| TAMPINES | 0.1% | 1.5% | -2.6% | 7.0% | -1.6% | -4.1% | 2.8% | 4.3% | -1.1% | 3.1% | -1.8% | -2.3% | 0.4% |
| PASIR RIS | -0.2% | 1.5% | -1.0% | 0.0% | 2.2% | 4.9% | -6.0% | 1.9% | 2.1% | -0.4% | -0.4% | 2.5% | 0.6% |
| SENGKANG | 0.6% | 1.3% | 0.8% | 0.4% | -1.1% | 2.1% | 0.7% | 0.5% | -0.2% | 0.0% | 1.4% | 3.0% | 0.8% |
| SEMBAWANG | 1.2% | 1.2% | 0.9% | -1.3% | 1.0% | 2.1% | 1.8% | -1.1% | 1.3% | -1.1% | 0.0% | 4.0% | 0.8% |
| JURONG EAST | 2.5% | -0.5% | 1.0% | 1.8% | 3.3% | 1.5% | 10.4% | -14.9% | 10.0% | 1.7% | |||
| KALLANG/WHAMPOA | 2.2% | -5.5% | 22.7% | -17.3% | -2.9% | 9.9% | 13.9% | -3.5% | -7.5% | -10.5% | 48.9% | -27.2% | 1.9% |
| TOA PAYOH | 17.3% | 12.7% | -7.2% | 11.8% | -10.6% | 5.1% | -12.6% | 7.9% | 12.9% | -3.6% | -3.5% | 2.7% |
This was where we found the most sizeable decline in prices, and it’s surprisingly in Ang Mo Kio. Regardless of the fall in prices, this is a very mature estate; so even with the recent dip, 5-room flats here can still reach a quantum of $870,000 or more, particularly as you near the boundary with Bishan or Serangoon.
While Bukit Merah, Bukit Batok, and Hougang also saw a dip in prices, they were nowhere near as significant as what we found in Ang Mo Kio.
Resale flats that are 30+ years old
| Estate | 2023-05 | 2023-06 | 2023-07 | 2023-08 | 2023-09 | 2023-10 | 2023-11 | 2023-12 | 2024-01 | 2024-02 | 2024-03 | 2024-04 | Average |
| QUEENSTOWN | -15.6% | 2.0% | 13.1% | -3.6% | -11.0% | 1.0% | 11.1% | -4.6% | -8.9% | 12.5% | -16.5% | -1.9% | |
| MARINE PARADE | -6.8% | 7.6% | -5.4% | 1.7% | -8.4% | 16.0% | -7.5% | 1.3% | -2.9% | -1.6% | 0.3% | -0.5% | |
| GEYLANG | 2.8% | -2.8% | 3.2% | -4.8% | -2.6% | 7.3% | 2.9% | -7.2% | 3.5% | -0.7% | 2.0% | 0.3% | |
| JURONG WEST | 4.2% | -0.8% | -0.2% | -1.0% | 5.1% | -4.0% | -3.0% | 4.8% | -2.2% | 4.6% | -4.0% | 1.4% | 0.4% |
| TAMPINES | 0.3% | 2.0% | -1.5% | -0.2% | 1.8% | -1.0% | 2.4% | 0.0% | -0.5% | 2.2% | 0.4% | -0.6% | 0.4% |
| BUKIT PANJANG | -0.9% | 2.3% | 1.1% | 0.1% | 1.8% | 2.6% | -1.3% | 1.0% | -4.0% | 3.3% | -0.6% | 0.3% | 0.5% |
| SERANGOON | -2.0% | 2.7% | 1.9% | -1.1% | 0.3% | 4.4% | -3.4% | 3.7% | 4.0% | -0.4% | -6.8% | 2.3% | 0.5% |
| BEDOK | 1.1% | 0.0% | -2.4% | 5.8% | -1.6% | -1.1% | 2.9% | 2.3% | -2.1% | 2.4% | -1.2% | -0.1% | 0.5% |
| CLEMENTI | 2.2% | -1.3% | 0.9% | 3.3% | 1.9% | -8.2% | 3.5% | -3.3% | 2.5% | 2.9% | 2.8% | -1.1% | 0.5% |
| YISHUN | 1.0% | 1.2% | 0.6% | -0.7% | 0.2% | -0.1% | -0.4% | 3.6% | 0.7% | -1.4% | 3.2% | -1.6% | 0.5% |
| BUKIT BATOK | 1.8% | -3.0% | 1.8% | -0.6% | -2.2% | 6.2% | -3.7% | 0.1% | -1.1% | 2.9% | 0.2% | 4.2% | 0.6% |
| ANG MO KIO | -0.8% | 1.9% | 1.6% | -2.2% | 1.6% | 0.0% | 1.4% | 1.8% | -0.2% | 1.0% | 0.6% | 0.6% | |
| CHOA CHU KANG | 5.3% | -1.6% | 0.1% | 1.9% | 1.2% | -1.3% | -1.6% | 2.8% | 1.1% | -2.0% | 1.9% | 0.3% | 0.7% |
| HOUGANG | -2.3% | 1.4% | 0.6% | 1.9% | 0.5% | 1.4% | 1.4% | -1.3% | 1.2% | 1.6% | 2.0% | 0.1% | 0.7% |
| PASIR RIS | 5.3% | -0.9% | -0.1% | 0.7% | -1.2% | 0.6% | 2.2% | 2.0% | -1.8% | 1.3% | 1.4% | -0.7% | 0.7% |
| BUKIT MERAH | -7.2% | 0.6% | 0.0% | -0.6% | 5.8% | -8.6% | 8.9% | -10.5% | 7.4% | 13.8% | 1.0% | ||
| KALLANG/WHAMPOA | 6.0% | 0.6% | 12.8% | -9.9% | 1.0% | -6.2% | 16.0% | -8.8% | 1.6% | -2.1% | 5.4% | -2.6% | 1.1% |
| JURONG EAST | 4.9% | -6.4% | 0.9% | 4.0% | -5.2% | 4.2% | 3.0% | -3.2% | -2.5% | 6.5% | 0.0% | 8.6% | 1.2% |
| TOA PAYOH | 11.5% | -1.4% | -1.1% | -7.6% | 12.2% | -13.0% | 5.2% | -0.1% | 1.3% | 1.7% | -0.6% | 8.0% | 1.3% |
| WOODLANDS | 0.7% | 6.1% | 0.7% | -3.3% | -1.9% | 6.7% | -2.9% | 1.4% | 2.1% | 3.2% | -3.8% | 7.8% | 1.4% |
| BISHAN | 5.6% | -3.7% | 5.7% | -2.2% | -2.6% | 3.8% | 1.4% | -5.6% | 7.0% | -0.5% | -5.1% | 21.7% | 2.1% |
| CENTRAL AREA | -14.8% | 13.9% | 23.0% | -14.2% | -13.2% | -4.9% | -6.7% | 13.7% | 2.2% | -13.3% | 10.5% | 30.0% | 2.2% |
Resale flat prices here only dipped in two towns: Queenstown and Marine Parade. Now Queenstown has been seeing a bump in supply – there was a BTO launch here in February (the former Tanglin Halt), and there’s another launch later in June (in Holland V no less). But that’s also why the dip in resale prices may not last.
The newer launches will fall under the Prime Location Housing model, so they have added drawbacks – like a 10-year MOP – that surrounding resale flats won’t have. It’s also plausible that, if they fail to obtain a BTO flat, balloters will turn their attention to other resale options in the area, however old. This may help to maintain prices here or bring them back up.
With Marine Parade, a 0.52 per cent dip isn’t a big change. However, you may want to keep an eye on the flats close to the Katong/Parkway Parade area – the upcoming Marine Parade MRT station will be a big change to accessibility in this area. That may be more than enough to counterbalance the age of the flats here.
While there haven’t been huge drops in price, it’s still an optimistic outlook for buyers
There may not have been big price drops, but take note of price increases: even in the Central Area, which is the pinnacle of resale flats, prices have only gone up by 2.19 per cent (for 30+ year-old flats) and 2.67 per cent (for 11 to 20-year-old flats).
These show a much slower pace compared to the period just after COVID-19, and resale flat prices are losing a bit of momentum. We may see further price dips later in the year, as more completed flats join the market.
In the longer term, we also need to consider that HDB built over 20,000 flats in 2022 – the highest output since 2017. These flats will join the resale market in around three years, so the pace of resale flat prices will likely slow further.
At Stacked, we like to look beyond the headlines and surface-level numbers, and focus on how things play out in the real world.
If you’d like to discuss how this applies to your own circumstances, you can reach out for a one-to-one consultation here.
And if you simply have a question or want to share a thought, feel free to write to us at stories@stackedhomes.com — we read every message.

2 Comments
I think the average MoM increase/decrease over the entire period is a bit misleading – perhaps use the ending price vs. start of period price?