


Private properties have reached new heights of unaffordability in the aftermath of Covid; and with ABSD rates sitting at 20 per cent, it’s unsurprising that price is a bigger issue than ever. But this led us to ask: are there places in Singapore where private home prices may have gone down, instead of up? We looked through the various districts, for properties of different ages, to see which areas where prices may have dipped instead:
Note: The following only tracks resale condo prices, as new launches would cause sharp jumps in prices per square foot, and tend to occur close to each other – this would distort the data. Do also note that in some cases (specifically leasehold condos), we’ve broken down the data by age range. As a result, transaction volume would be lower and thus, may not be an accurate representation of the area’s performance.
So many readers write in because they're unsure what to do next, and don't know who to trust.
If this sounds familiar, we offer structured 1-to-1 consultations where we walk through your finances, goals, and market options objectively.
No obligation. Just clarity.
Learn more here.
Price dips among freehold private homes
Average $PSF
| Districts | 2023 Q2 | 2023 Q3 | 2023 Q4 | 2024 Q1 |
| 2 | $2,262 | $2,312 | $2,309 | $2,340 |
| 3 | $1,786 | $1,792 | $1,784 | $2,043 |
| 4 | $1,795 | $1,866 | $2,088 | $1,837 |
| 5 | $1,609 | $1,591 | $1,636 | $1,603 |
| 8 | $1,595 | $1,712 | $1,680 | $1,648 |
| 9 | $2,255 | $2,195 | $2,280 | $2,373 |
| 10 | $2,383 | $2,222 | $2,308 | $2,335 |
| 11 | $1,997 | $1,896 | $2,066 | $2,035 |
| 12 | $1,548 | $1,605 | $1,636 | $1,668 |
| 13 | $1,495 | $1,599 | $1,577 | $1,665 |
| 14 | $1,443 | $1,376 | $1,448 | $1,455 |
| 15 | $1,747 | $1,742 | $1,782 | $1,762 |
| 16 | $1,478 | $1,390 | $1,474 | $1,410 |
| 17 | $1,153 | $1,108 | $1,121 | $1,128 |
| 19 | $1,443 | $1,504 | $1,501 | $1,538 |
| 20 | $1,659 | $1,740 | $1,678 | $1,672 |
| 21 | $1,728 | $1,687 | $1,725 | $1,731 |
| 23 | $1,481 | $1,468 | $1,502 | $1,499 |
| 26 | $1,578 | $1,564 | $1,593 | $1,492 |
| 27 | $1,214 | $1,067 | $1,074 | $1,158 |
| 28 | $1,287 | $1,203 | $1,415 | $1,319 |
Quarterly Change
| Districts | 2023 Q3 | 2023 Q4 | 2024 Q1 | Average Performance |
| 20 | -0.9% | 1.8% | -6.3% | -1.8% |
| 26 | -6.0% | 6.0% | -4.3% | -1.4% |
| 14 | -12.1% | 0.6% | 7.9% | -1.2% |
| 10 | -3.9% | 1.2% | 0.6% | -0.7% |
| 9 | -6.8% | 3.9% | 1.2% | -0.6% |
| 8 | -1.1% | 2.8% | -2.0% | -0.1% |
| 5 | -2.4% | 2.3% | 0.4% | 0.1% |
| 15 | -0.2% | 2.3% | -1.1% | 0.3% |
| 3 | 4.9% | -3.6% | -0.4% | 0.3% |
| 19 | -4.7% | 5.2% | 0.5% | 0.4% |
| 4 | -0.9% | 2.3% | -0.2% | 0.4% |
| 11 | -5.0% | 8.9% | -1.5% | 0.8% |
| 12 | 2.2% | -0.1% | 1.3% | 1.1% |
| 21 | 7.3% | -1.9% | -1.9% | 1.2% |
| 13 | 4.0% | 11.9% | -12.1% | 1.3% |
| 16 | -6.5% | 17.6% | -6.8% | 1.4% |
| 17 | -2.6% | 3.8% | 4.1% | 1.8% |
| 27 | 4.2% | -0.2% | 2.5% | 2.2% |
| 28 | 3.7% | 1.9% | 2.0% | 2.5% |
| 23 | 7.0% | -1.4% | 5.6% | 3.7% |
| 2 | 0.4% | -0.4% | 14.5% | 4.8% |
District 20 is one of the most desirable locations in the RCR. The issue is that old freehold properties here, like Flame Tree Park, can be as low as $1,736 psf; but with units reaching close to 1,900 sq. ft. the average quantum rises to $2.8 million or more, making it still quite out of reach anyway. Still, given the price dip, it may be worth taking a closer look right now.
District 26 isn’t likely to maintain falling prices, mainly due to the Lentor area. There’s a recent surge of new launches (Lentoria, Lentor Mansion, etc.), and new launches – even if they’re not freehold themselves – may help to pull up prices of existing resale projects.
The TEL line and the Lentor MRT station also help with this formerly inaccessible area, although there are some valid arguments that Upper Thomson/Mandai is still rather “ulu.” But if you like greenery and privacy, that’s a feature and not a bug.
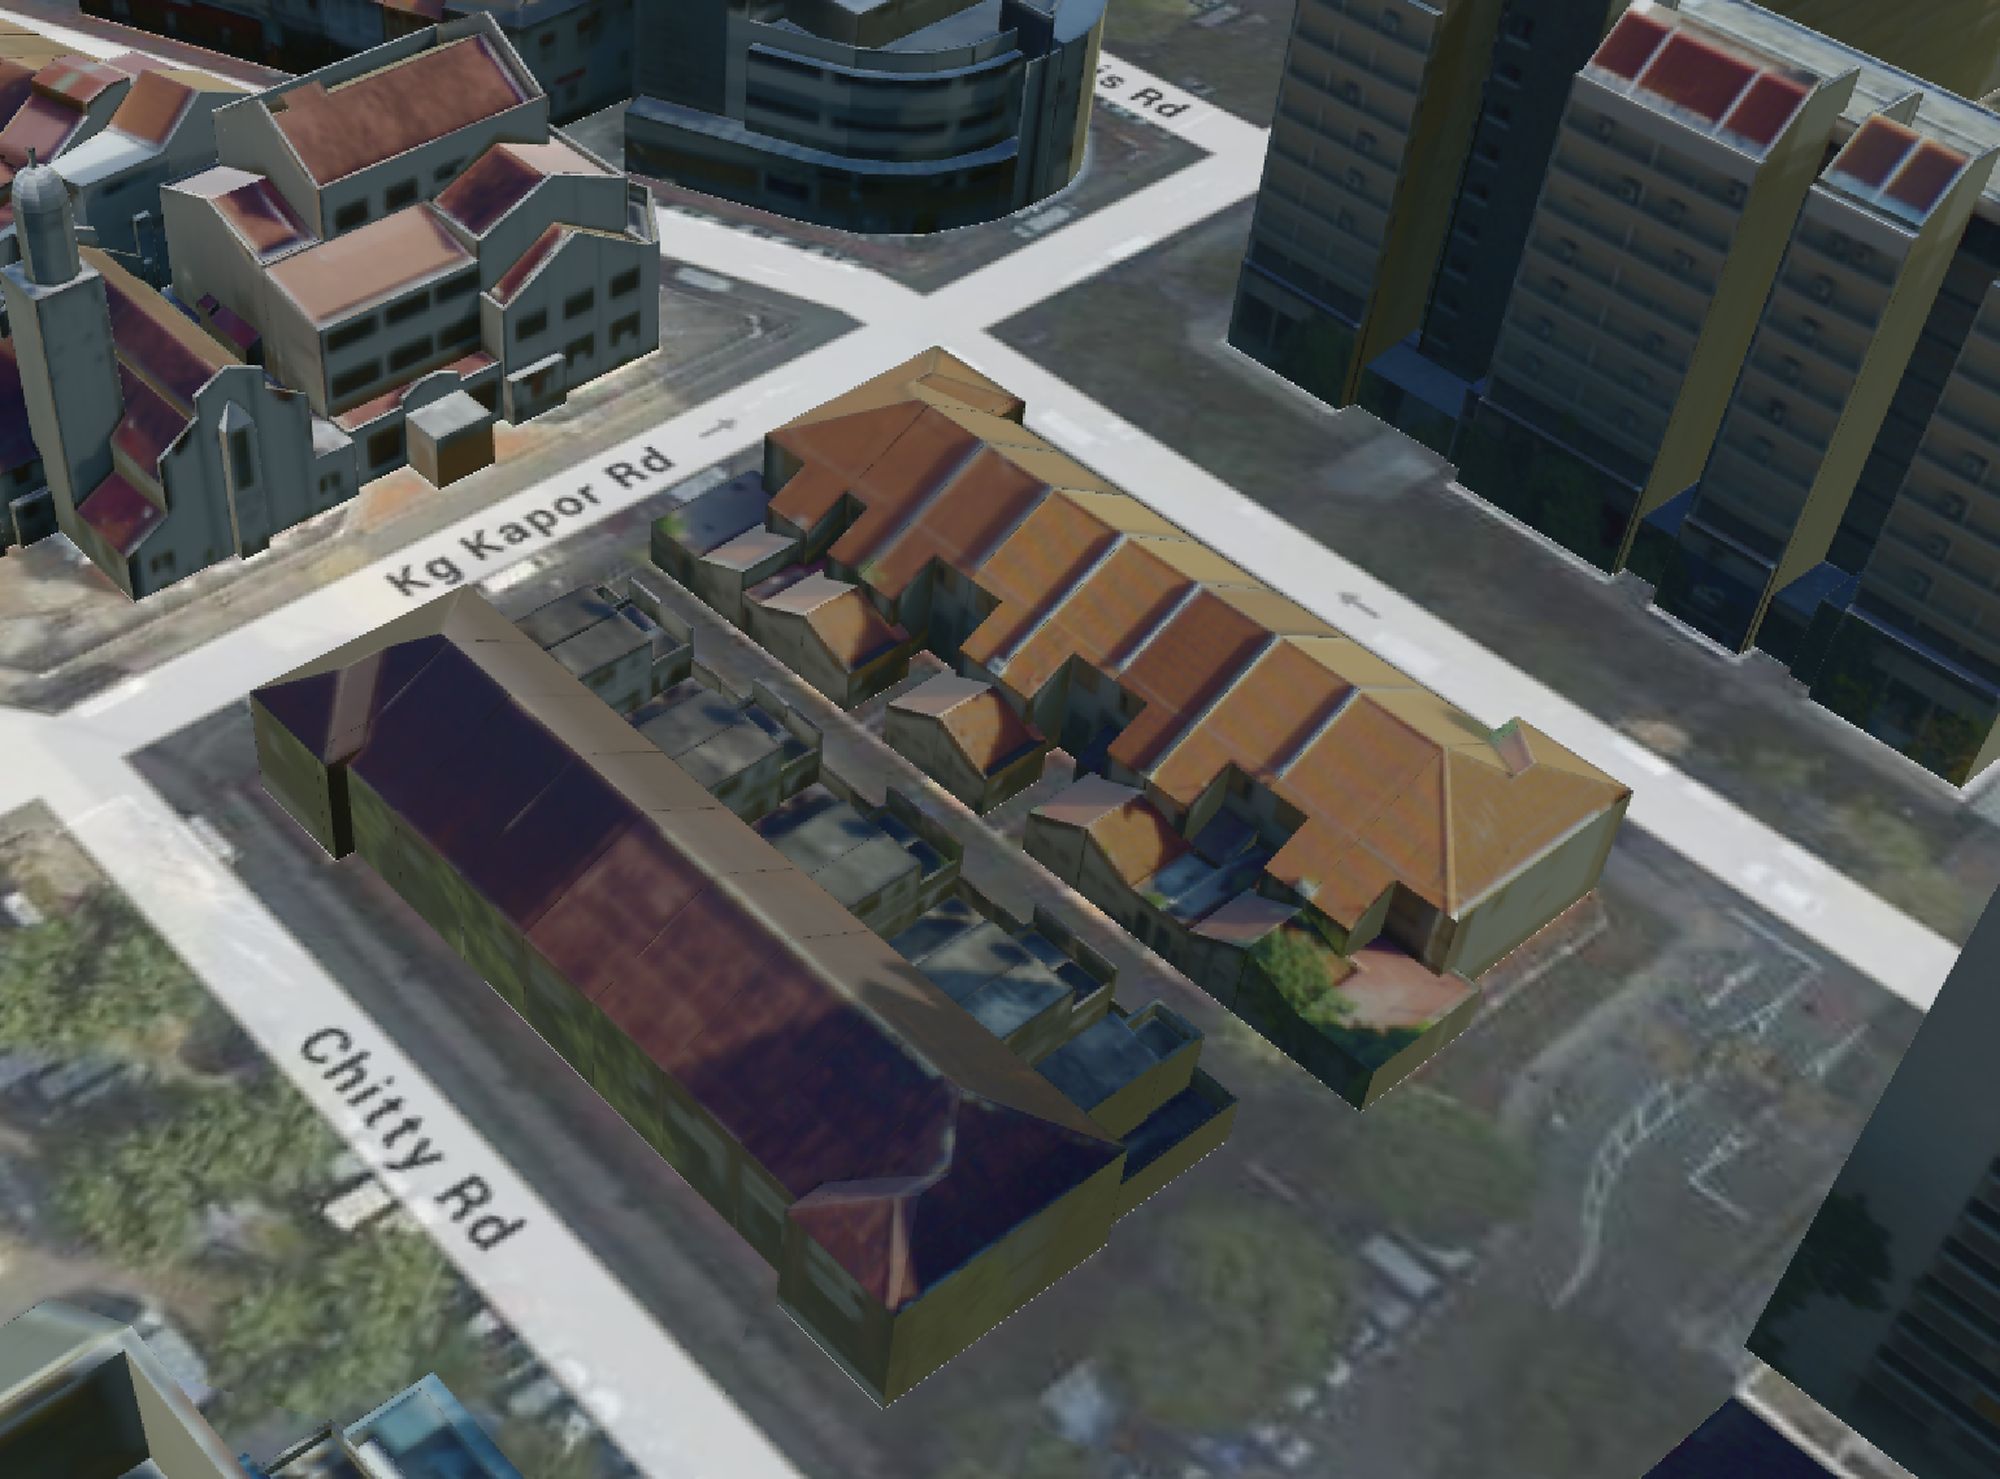
District 14 is somewhat unpredictable as it contains both Paya Lebar (a major commercial hub with higher-end properties) and Geylang (an area known for some older and more dilapidated properties, often rented to foreign workers). Geylang also has our red light district where you’ll find some freehold properties that skew the average toward the lower end. So because this district has such widely divergent zones, you should regard the Paya Lebar Quarter (PLQ) area as being entirely distinct from neighbouring Geylang; and we’d expect that the cheaper freehold options are mostly in the Geylang area.
As an aside, District 14 is highly urbanised and built up, and is as well known for convenience as it is for the lack of nice scenery (although the area around Eunos offers more breathing space for families).
Price dips among leasehold condos (10 years or less)
Average $PSF
| Districts | 2023 Q2 | 2023 Q3 | 2023 Q4 | 2024 Q1 |
| 3 | $2,146 | $2,221 | $2,222 | $2,210 |
| 5 | $1,728 | $1,786 | $1,795 | $1,787 |
| 7 | $2,212 | $2,113 | $2,006 | $2,073 |
| 8 | $1,988 | $2,058 | $1,993 | $2,134 |
| 9 | $2,647 | $2,512 | $2,703 | $2,651 |
| 13 | $2,044 | $2,006 | $2,020 | $1,948 |
| 14 | $1,821 | $1,839 | $1,954 | $2,055 |
| 15 | $2,152 | $2,278 | $2,237 | $2,197 |
| 16 | $1,843 | $1,861 | $1,845 | $1,823 |
| 18 | $1,554 | $1,585 | $1,542 | $1,619 |
| 19 | $1,582 | $1,525 | $1,562 | $1,623 |
| 20 | $1,837 | $2,002 | $2,148 | $2,092 |
| 21 | $2,061 | $2,107 | $1,949 | $2,073 |
| 22 | $1,293 | $1,353 | $1,482 | $1,483 |
| 23 | $1,350 | $1,385 | $1,413 | $1,422 |
| 27 | $1,318 | $1,329 | $1,334 | $1,325 |
| 28 | $1,493 | $1,551 | $1,548 | $1,571 |
Quarterly Change
| Districts | 2023 Q3 | 2023 Q4 | 2024 Q1 | Average Performance |
| 7 | 3.5% | 0.0% | -0.5% | 1.0% |
| 13 | 3.4% | 0.5% | -0.5% | 1.1% |
| 16 | -4.5% | -5.1% | 3.3% | -2.1% |
| 27 | 3.5% | -3.1% | 7.0% | 2.5% |
| 9 | -5.1% | 7.6% | -1.9% | 0.2% |
| 21 | -1.9% | 0.7% | -3.6% | -1.6% |
| 15 | 1.0% | 6.2% | 5.2% | 4.1% |
| 19 | 5.8% | -1.8% | -1.8% | 0.8% |
| 3 | 1.0% | -0.9% | -1.2% | -0.4% |
| 5 | 2.0% | -2.8% | 5.0% | 1.4% |
| 18 | -3.6% | 2.4% | 3.9% | 0.9% |
| 28 | 9.0% | 7.3% | -2.6% | 4.5% |
| 23 | 2.2% | -7.5% | 6.4% | 0.4% |
| 8 | 4.7% | 9.5% | 0.1% | 4.7% |
| 14 | 2.6% | 2.1% | 0.6% | 1.7% |
| 20 | 0.8% | 0.3% | -0.6% | 0.2% |
| 22 | 3.9% | -0.2% | 1.4% | 1.7% |
For these very new condos, there wasn’t a significant price drop outside of District 7 (Beach Road, Bugis, Rochor) and District 13 (Potong Pasir).
That District 7 saw a price dip is quite surprising, but given it’s so insignificant there’s not much to refer to here. The ongoing development of the Ophir-Rochor Corridor will help drive up prices eventually, and this spot is emblematic of the narrowing price gap between the OCR and RCR.
For District 13, it may simply be that the area’s quieter after its big rush in 2021. At the time, Woodleigh Residences and Myra made a huge splash here, and before that Park Colonial (in 2019). It may be a while more before developers circle back to this area. Buyers who missed out on those condos at launch might have a second shot now, as they go past their Sellers Stamp Duty (SSD) period.
Price dips among leasehold condos (11 to 20 years)
Average $PSF
| Districts | 2023 Q2 | 2023 Q3 | 2023 Q4 | 2024 Q1 |
| 1 | $2,007 | $2,179 | $2,068 | $1,969 |
| 2 | $2,273 | $2,161 | $2,078 | $1,983 |
| 3 | $1,999 | $2,077 | $2,061 | $2,052 |
| 4 | $1,941 | $1,780 | $1,800 | $1,838 |
| 5 | $1,519 | $1,572 | $1,599 | $1,508 |
| 7 | $2,151 | $1,956 | $2,033 | $2,035 |
| 8 | $1,815 | $1,848 | $1,733 | $1,659 |
| 9 | $2,195 | $2,212 | $2,214 | $2,188 |
| 10 | $1,888 | $1,884 | $1,943 | $1,931 |
| 11 | $1,980 | $1,907 | $2,009 | $1,927 |
| 12 | $1,657 | $1,705 | $1,769 | $1,794 |
| 13 | $1,709 | $1,695 | $1,696 | $1,765 |
| 14 | $1,614 | $1,663 | $1,637 | $1,629 |
| 15 | $1,876 | $1,893 | $1,979 | $2,002 |
| 16 | $1,504 | $1,522 | $1,553 | $1,587 |
| 17 | $1,245 | $1,227 | $1,201 | $1,174 |
| 18 | $1,307 | $1,308 | $1,348 | $1,360 |
| 19 | $1,364 | $1,375 | $1,403 | $1,445 |
| 20 | $1,823 | $1,851 | $1,870 | $1,891 |
| 22 | $1,569 | $1,550 | $1,606 | $1,633 |
| 23 | $1,468 | $1,425 | $1,396 | $1,422 |
| 25 | $1,164 | $1,157 | $1,196 | $1,157 |
| 27 | $1,194 | $1,167 | $1,202 | $1,207 |
| 28 | $1,296 | $1,307 | $1,324 | $1,345 |
Quarterly Change
| Districts | 2023 Q3 | 2023 Q4 | 2024 Q1 | Average Performance |
| 8 | -5.0% | -3.8% | -4.6% | -4.5% |
| 11 | 1.8% | -6.2% | -4.3% | -2.9% |
| 13 | -1.5% | -2.1% | -2.2% | -1.9% |
| 23 | -9.0% | 3.9% | 0.1% | -1.7% |
| 7 | -8.3% | 1.1% | 2.1% | -1.7% |
| 16 | -2.9% | -2.1% | 1.9% | -1.0% |
| 5 | -3.7% | 5.4% | -4.1% | -0.8% |
| 2 | 8.6% | -5.1% | -4.8% | -0.4% |
| 19 | -0.5% | 3.3% | -3.3% | -0.2% |
| 4 | 3.5% | 1.7% | -5.6% | -0.1% |
| 1 | 0.8% | 0.1% | -1.1% | -0.1% |
| 27 | 3.0% | -1.6% | -0.5% | 0.3% |
| 15 | -2.2% | 3.0% | 0.4% | 0.4% |
| 25 | -0.2% | 3.1% | -0.6% | 0.8% |
| 17 | 3.9% | -0.8% | -0.4% | 0.9% |
| 14 | -0.8% | 0.1% | 4.0% | 1.1% |
| 18 | 1.5% | 1.0% | 1.1% | 1.2% |
| 12 | 0.9% | 1.3% | 1.6% | 1.2% |
| 20 | 0.1% | 3.0% | 0.9% | 1.3% |
| 22 | -1.2% | 3.6% | 1.7% | 1.4% |
| 3 | 1.2% | 2.0% | 2.2% | 1.8% |
| 28 | 0.8% | 2.0% | 3.0% | 1.9% |
| 10 | 0.9% | 4.5% | 1.1% | 2.2% |
| 9 | 2.9% | 3.7% | 1.4% | 2.7% |
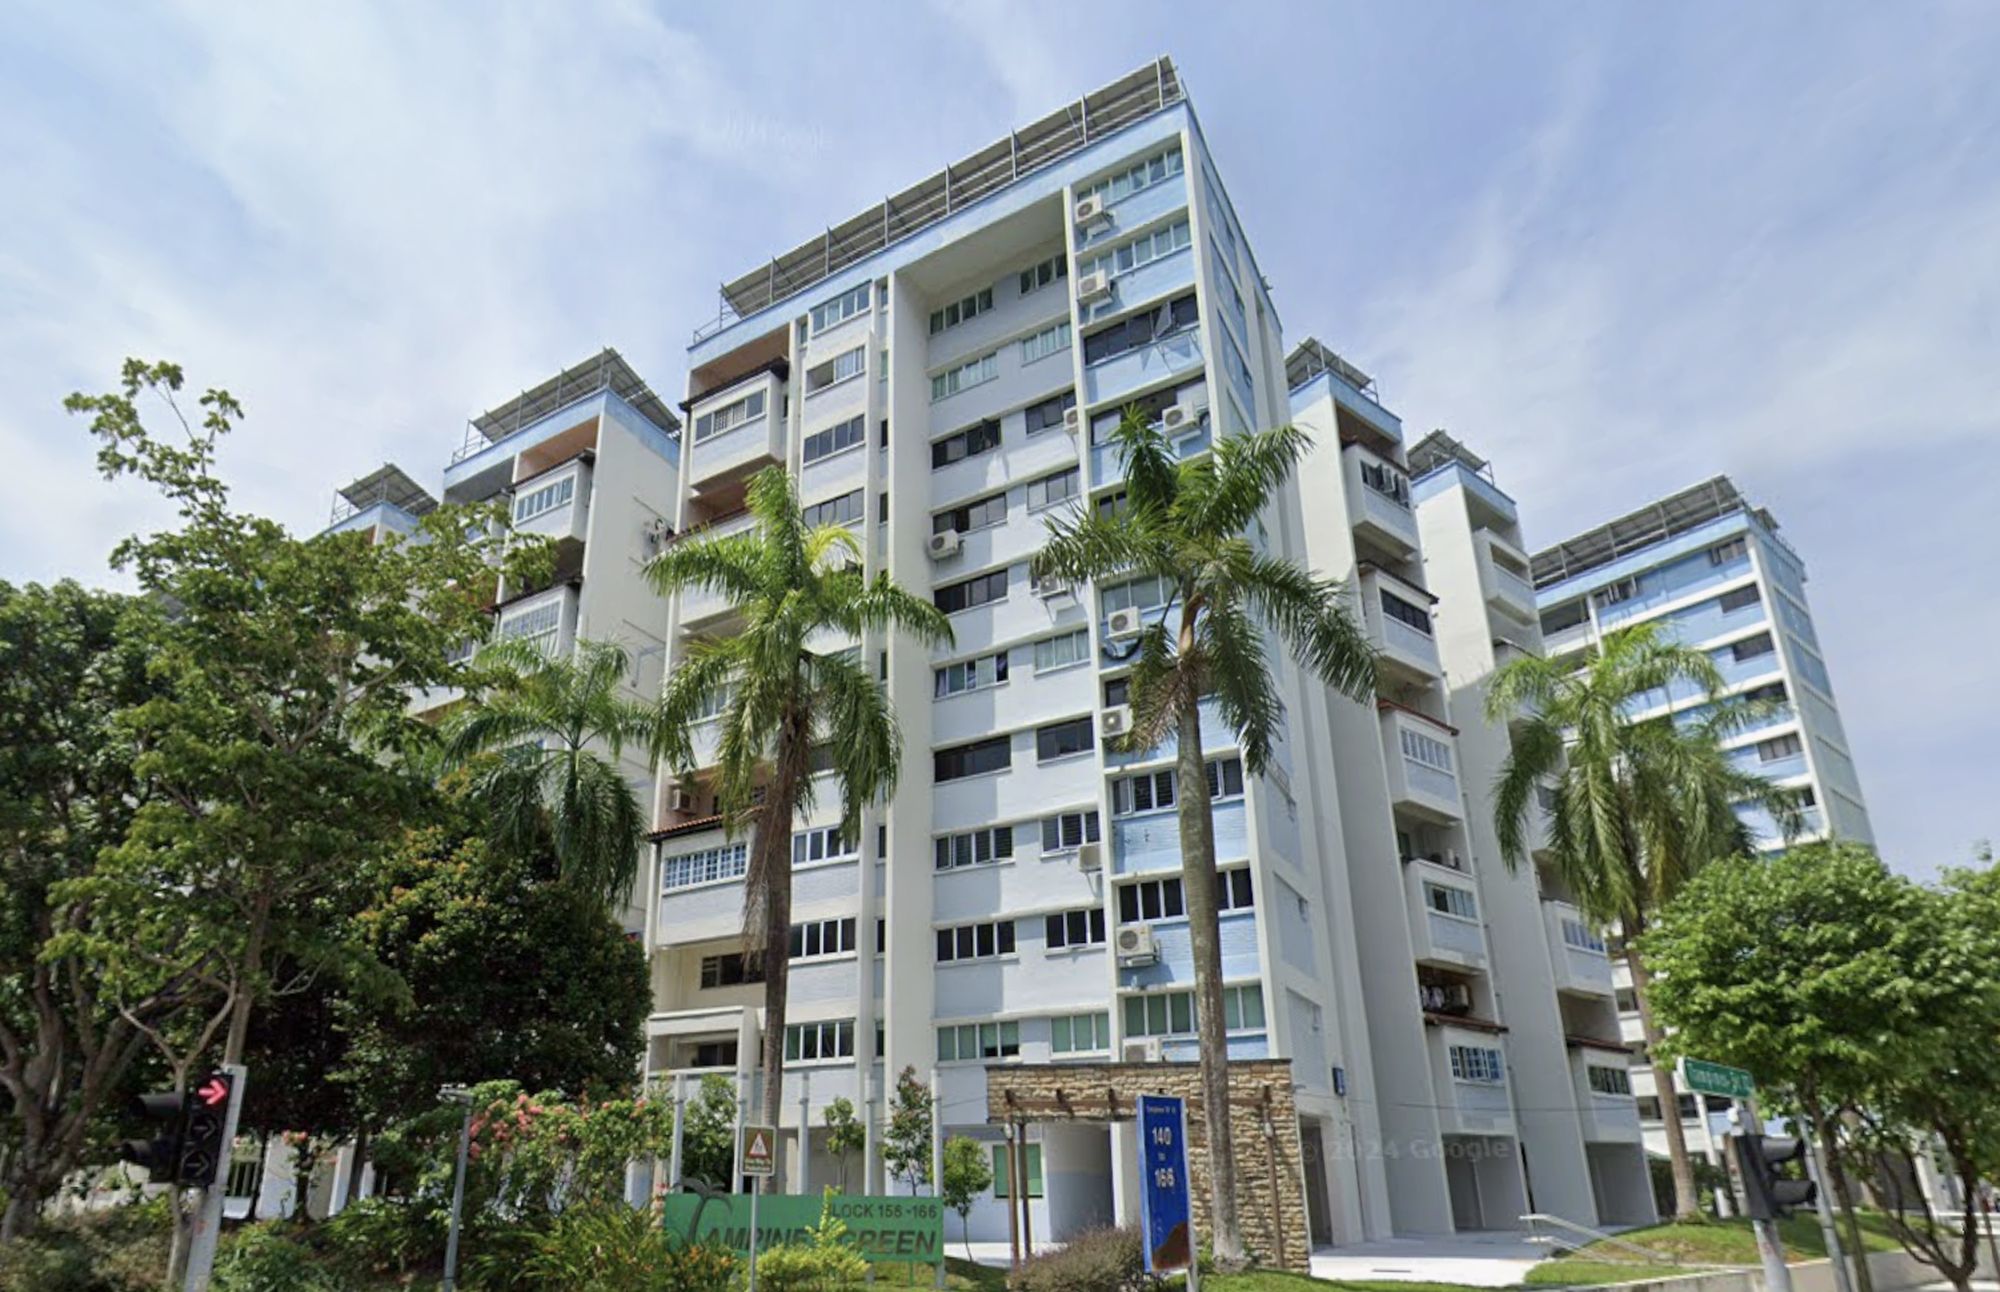
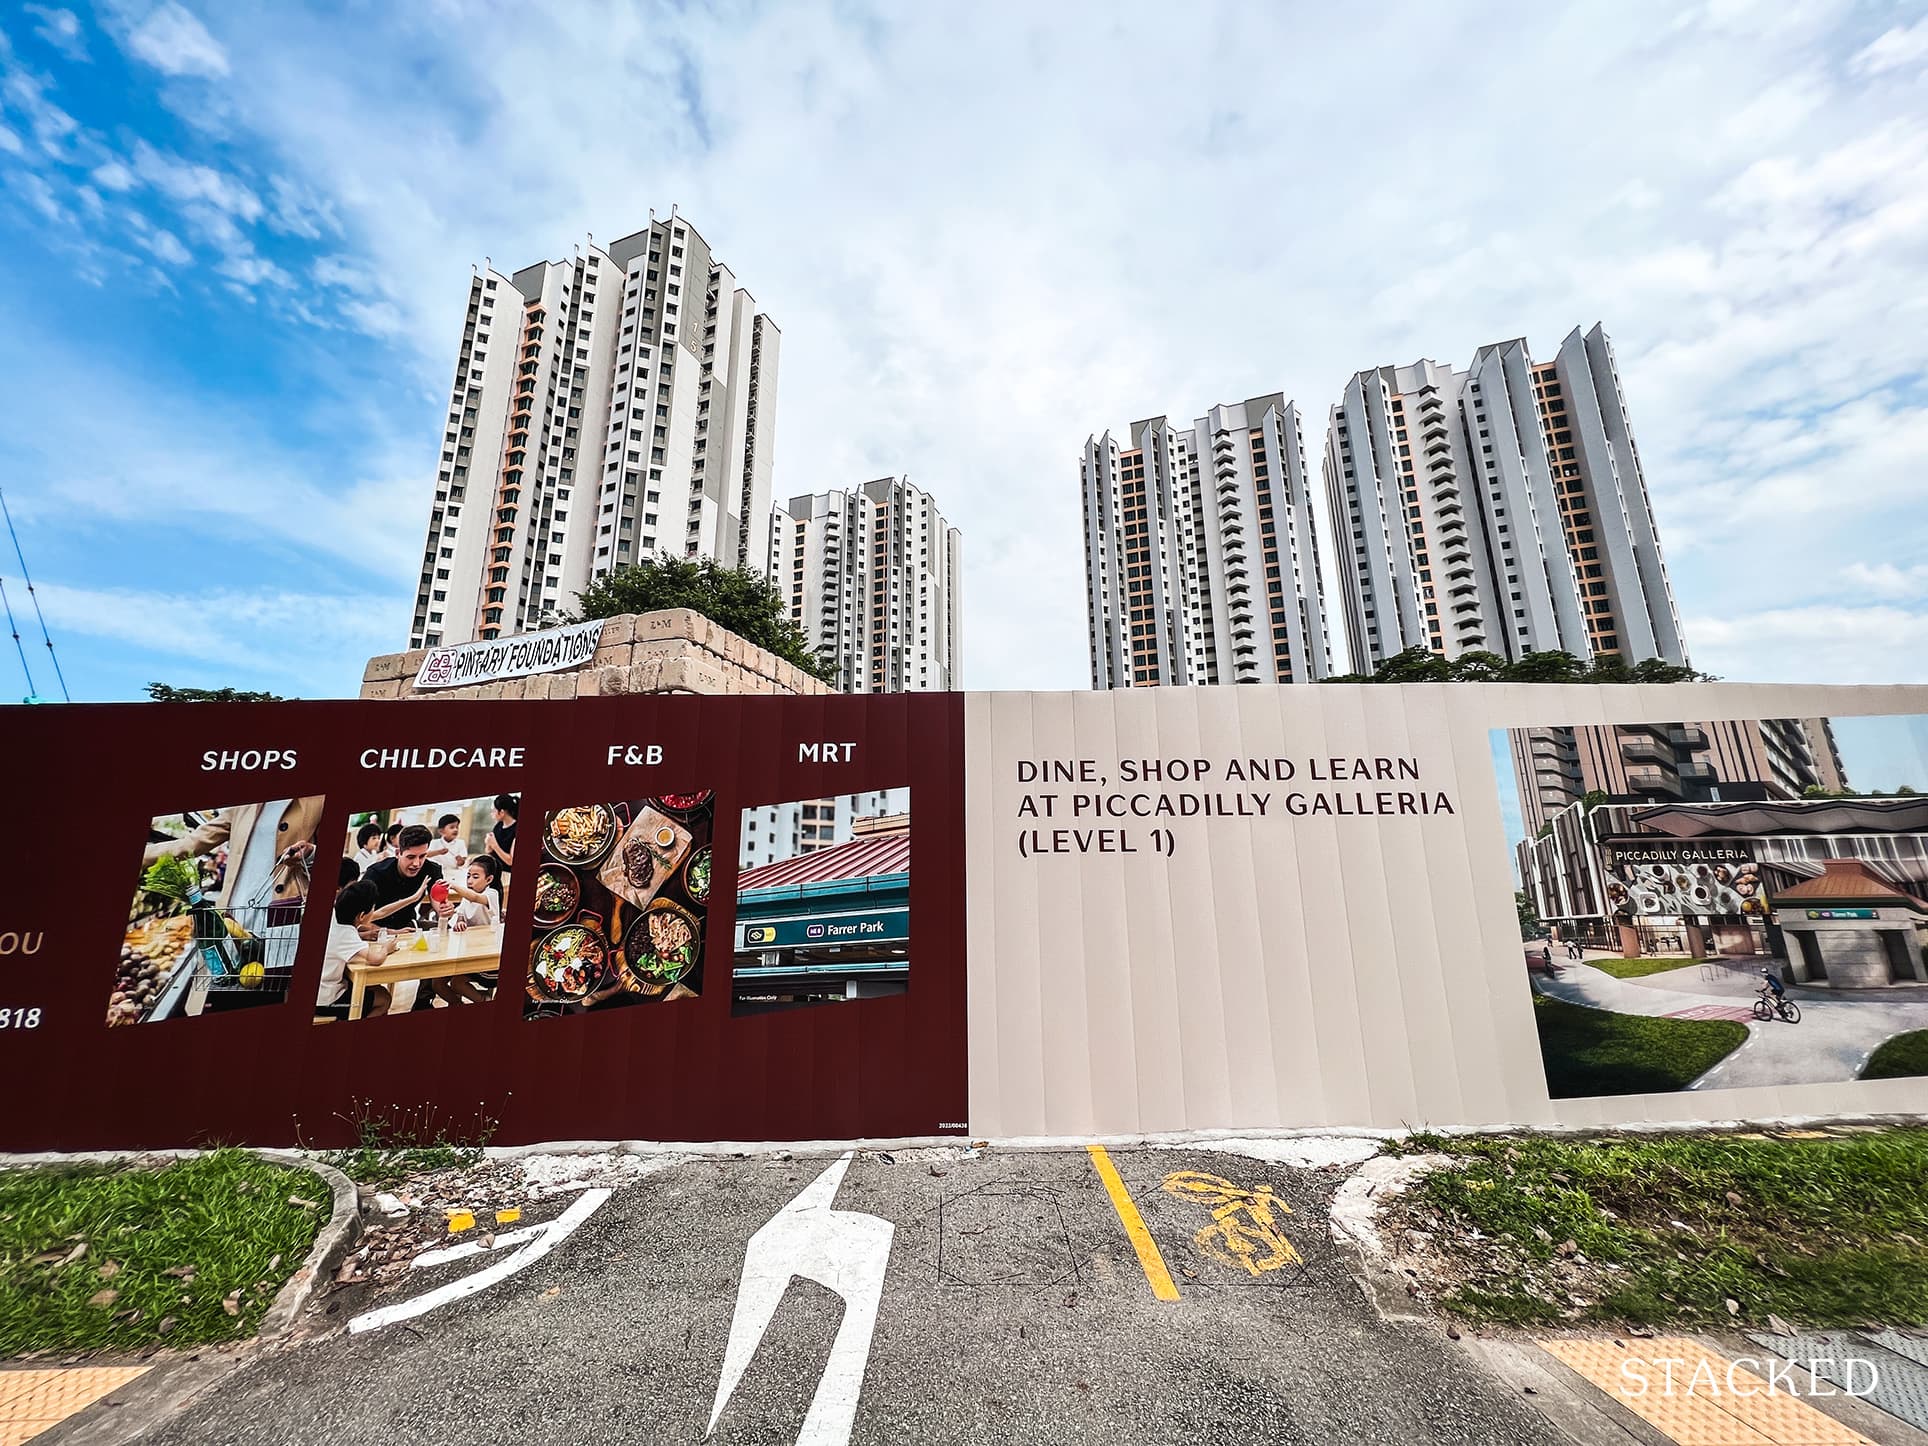
District 8 (Farrer Park, Serangoon Road) is currently awaiting the completion of Piccadilly Grand (TOP in 2026), but activity here has been a bit muted besides this. Condos in this area mainly derive their appeal from being so close to the city centre, and some projects – like Uptown @ Farrer – are angled at the rental market. Besides the changes at Farrer Park, there are further upgrades in the form of the recent $50 million revamp for City Square Mall.
That said, there may be a cause for worry in the area, as economic headwinds might impact the CCR and RCR rental markets (a weaker economy causes companies to scale back, which often means fewer expatriate renters and lower housing allowances).
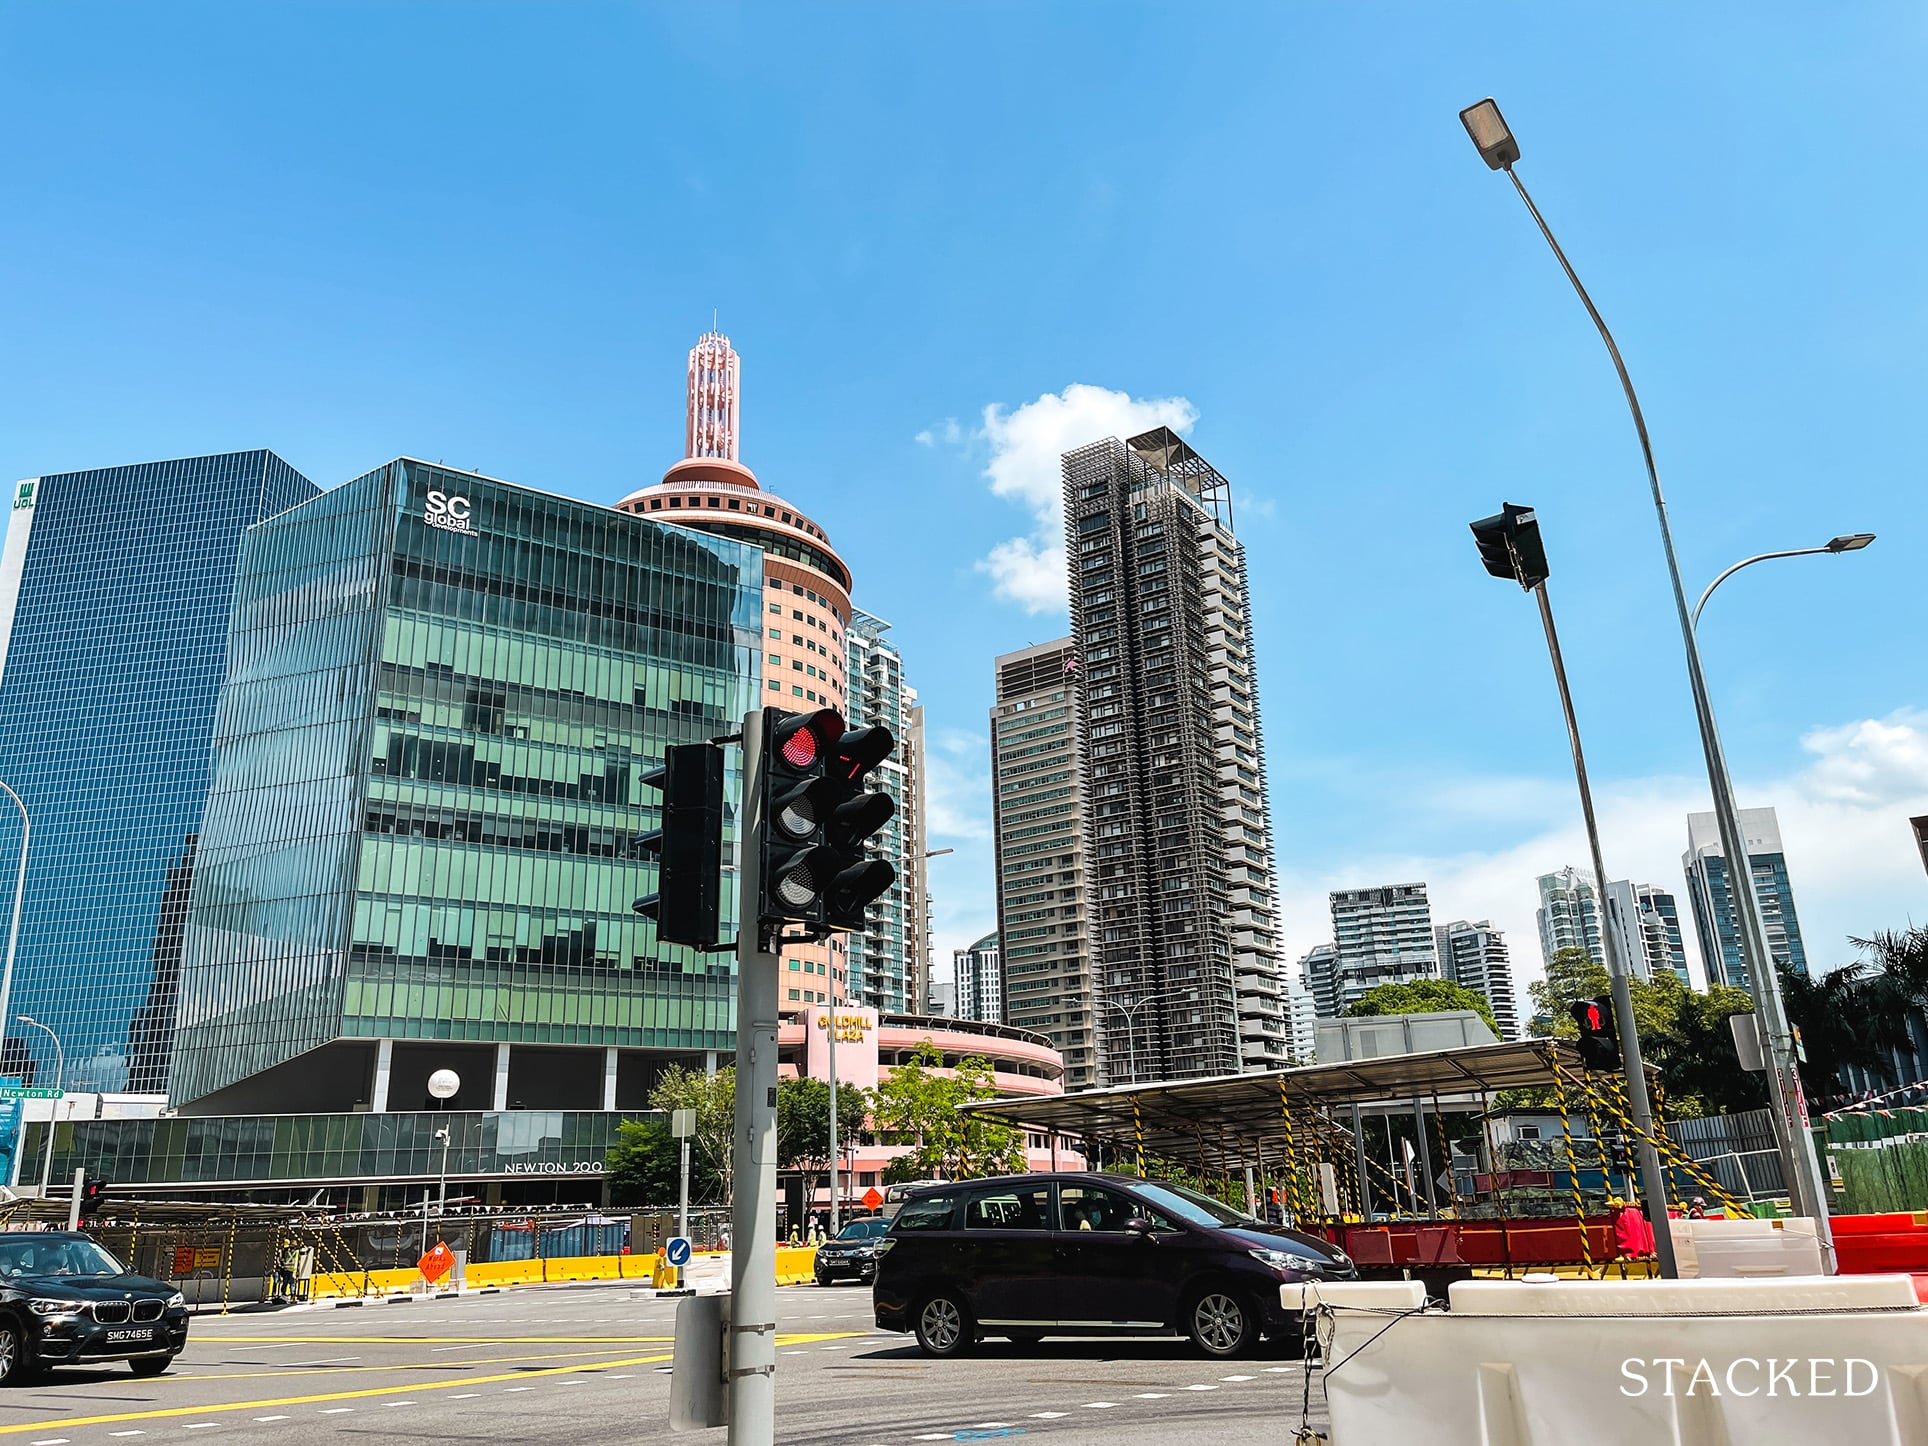
This also applies to District 11 (Newton, Bukit Timah), which is in the actual CCR. While an established prime area, we may be seeing the gradual effects of a higher ABSD on foreigners, who make up a sizeable portion of buyers in this area.
Price dips among leasehold condos (21 to 30 years)
Average $PSF
| Districts | 2023 Q2 | 2023 Q3 | 2023 Q4 | 2024 Q1 |
| 1 | $1,934 | $1,915 | $2,042 | $2,077 |
| 2 | $1,785 | $1,848 | $1,933 | $1,877 |
| 3 | $1,589 | $1,630 | $1,710 | $1,667 |
| 4 | $1,768 | $1,784 | $1,648 | $1,810 |
| 5 | $1,345 | $1,414 | $1,279 | $1,352 |
| 7 | $1,612 | $1,457 | $1,479 | $1,529 |
| 8 | $1,321 | $1,407 | $1,390 | $1,383 |
| 9 | $1,733 | $1,648 | $1,512 | $1,737 |
| 10 | $1,827 | $1,691 | $1,819 | $1,752 |
| 11 | $1,891 | $1,900 | $1,950 | $2,016 |
| 12 | $1,378 | $1,444 | $1,414 | $1,461 |
| 14 | $1,279 | $1,284 | $1,333 | $1,303 |
| 15 | $1,566 | $1,571 | $1,603 | $1,622 |
| 16 | $1,247 | $1,173 | $1,248 | $1,275 |
| 18 | $1,019 | $1,059 | $1,058 | $1,090 |
| 19 | $1,089 | $1,144 | $1,146 | $1,134 |
| 20 | $1,339 | $1,425 | $1,362 | $1,455 |
| 21 | $1,451 | $1,358 | $1,545 | $1,459 |
| 22 | $1,125 | $1,027 | $1,124 | $1,095 |
| 23 | $991 | $1,037 | $1,048 | $1,064 |
| 25 | $912 | $941 | $926 | $937 |
| 26 | $901 | $1,116 | $1,148 | $1,173 |
| 27 | $889 | $952 | $922 | $948 |
| 28 | $980 | $1,042 | $943 | $991 |
Quarterly Change
| Districts | 2023 Q3 | 2023 Q4 | 2024 Q1 | Average Performance |
| 21 | -9.6% | 1.5% | 3.4% | -1.6% |
| 16 | -7.5% | 7.6% | -3.7% | -1.2% |
| 27 | -8.8% | 9.4% | -2.5% | -0.6% |
| 9 | 5.1% | -9.5% | 5.6% | 0.4% |
| 28 | -4.9% | -8.3% | 14.9% | 0.6% |
| 11 | -6.4% | 13.8% | -5.6% | 0.6% |
| 15 | 0.4% | 3.8% | -2.3% | 0.6% |
| 26 | 6.3% | -9.5% | 5.1% | 0.6% |
| 8 | -5.9% | 6.4% | 2.1% | 0.9% |
| 23 | 3.2% | -1.6% | 1.2% | 0.9% |
| 5 | 0.9% | -7.6% | 9.8% | 1.0% |
| 19 | 0.3% | 2.1% | 1.1% | 1.2% |
| 2 | 5.0% | 0.2% | -1.0% | 1.4% |
| 14 | 6.5% | -1.2% | -0.5% | 1.6% |
| 22 | 2.6% | 4.9% | -2.5% | 1.7% |
| 10 | 3.5% | 4.6% | -2.9% | 1.7% |
| 4 | 4.8% | -2.1% | 3.4% | 2.0% |
| 25 | 0.5% | 2.6% | 3.4% | 2.2% |
| 20 | 7.1% | -3.1% | 2.9% | 2.3% |
| 3 | 3.9% | -0.1% | 3.0% | 2.3% |
| 18 | 4.7% | 1.1% | 1.5% | 2.4% |
| 7 | -1.0% | 6.6% | 1.7% | 2.5% |
| 12 | 6.4% | -4.4% | 6.8% | 2.9% |
District 21 (Clementi, Upper Bukit Timah) seems to top the list, but this was largely due to the sharp quarterly decline between 2023 Q2 and 2023 Q3 which could be due to the lower volume for this age range.
District 16 is a surprise, as the Bayshore area has been doing quite well. This is slated to become a new hub, although for now it’s quite inaccessible and lacks amenities (barring access to the beach). On some level, we do wonder if any price dips are partly related to announcements of the Long Island Project, which in future could obstruct views of beachfront condos here (The Bayshore, Bayshore Park, and Costa Del Sol).
Regardless, recent launches like Sceneca Residence and Sky Eden @ Bedok could help to pull prices again in the near future.
Price dips among leasehold condos (30+ years)
Average $PSF
| Districts | 2023 Q2 | 2023 Q3 | 2023 Q4 | 2024 Q1 |
| 1 | $1,718 | $1,598 | $1,497 | $1,586 |
| 2 | $1,058 | $1,093 | $1,247 | $1,082 |
| 3 | $1,529 | $1,565 | $1,596 | $1,523 |
| 5 | $1,193 | $1,287 | $1,274 | $1,256 |
| 7 | $1,204 | $1,032 | $1,218 | $1,206 |
| 9 | $2,387 | $1,167 | $1,879 | $1,921 |
| 10 | $1,725 | $1,575 | $1,630 | $1,678 |
| 11 | $1,314 | $1,256 | $1,223 | $1,254 |
| 14 | $1,230 | $1,297 | $1,272 | $1,441 |
| 15 | $1,184 | $1,204 | $1,198 | $1,221 |
| 16 | $1,221 | $1,275 | $1,242 | $1,252 |
| 17 | $1,018 | $908 | $942 | $1,029 |
| 18 | $916 | $854 | $908 | $919 |
| 20 | $1,084 | $1,155 | $1,106 | $1,138 |
| 21 | $1,167 | $1,245 | $1,118 | $1,314 |
| 22 | $925 | $1,025 | $1,077 | $1,128 |
| 26 | $1,194 | $1,197 | $1,295 | $1,278 |
| 27 | $907 | $936 | $971 | $950 |
Quarterly Change
| Districts | 2023 Q3 | 2023 Q4 | 2024 Q1 | Average Performance |
| 1 | -7% | -6% | 6% | -2% |
| 18 | -4% | -3% | 2% | -2% |
| 27 | -9% | 3% | 3% | -1% |
| 16 | 2% | 2% | -5% | 0% |
| 3 | -7% | 6% | 1% | 0% |
| 26 | -11% | 4% | 9% | 1% |
| 22 | 4% | -3% | 1% | 1% |
| 5 | -14% | 18% | -1% | 1% |
| 11 | 2% | -1% | 2% | 1% |
| 7 | 3% | 14% | -13% | 1% |
| 21 | 3% | 4% | -2% | 2% |
| 14 | 7% | -4% | 3% | 2% |
| 10 | 8% | -1% | -1% | 2% |
| 15 | 0% | 8% | -1% | 2% |
| 20 | -51% | 61% | 2% | 4% |
| 17 | 7% | -10% | 18% | 5% |
| 2 | 5% | -2% | 13% | 6% |
| 9 | 11% | 5% | 5% | 7% |
District 1 is the heart of the CBD, and is currently facing the issues we mentioned above: strong economic headwinds, coupled with high ABSD rates for foreign buyers. We would expect this to worsen slightly in the near future, or until the market adapts to the most recent cooling measures. It may, however, represent an opportunity for landlords who are focused on the long term.
Price dips in District 1 are probably less interesting to the majority of family buyers however, as it’s really more of a commercial hub than a place for living (barring young couples or attached singles who want the nightlife at Boat Quay).
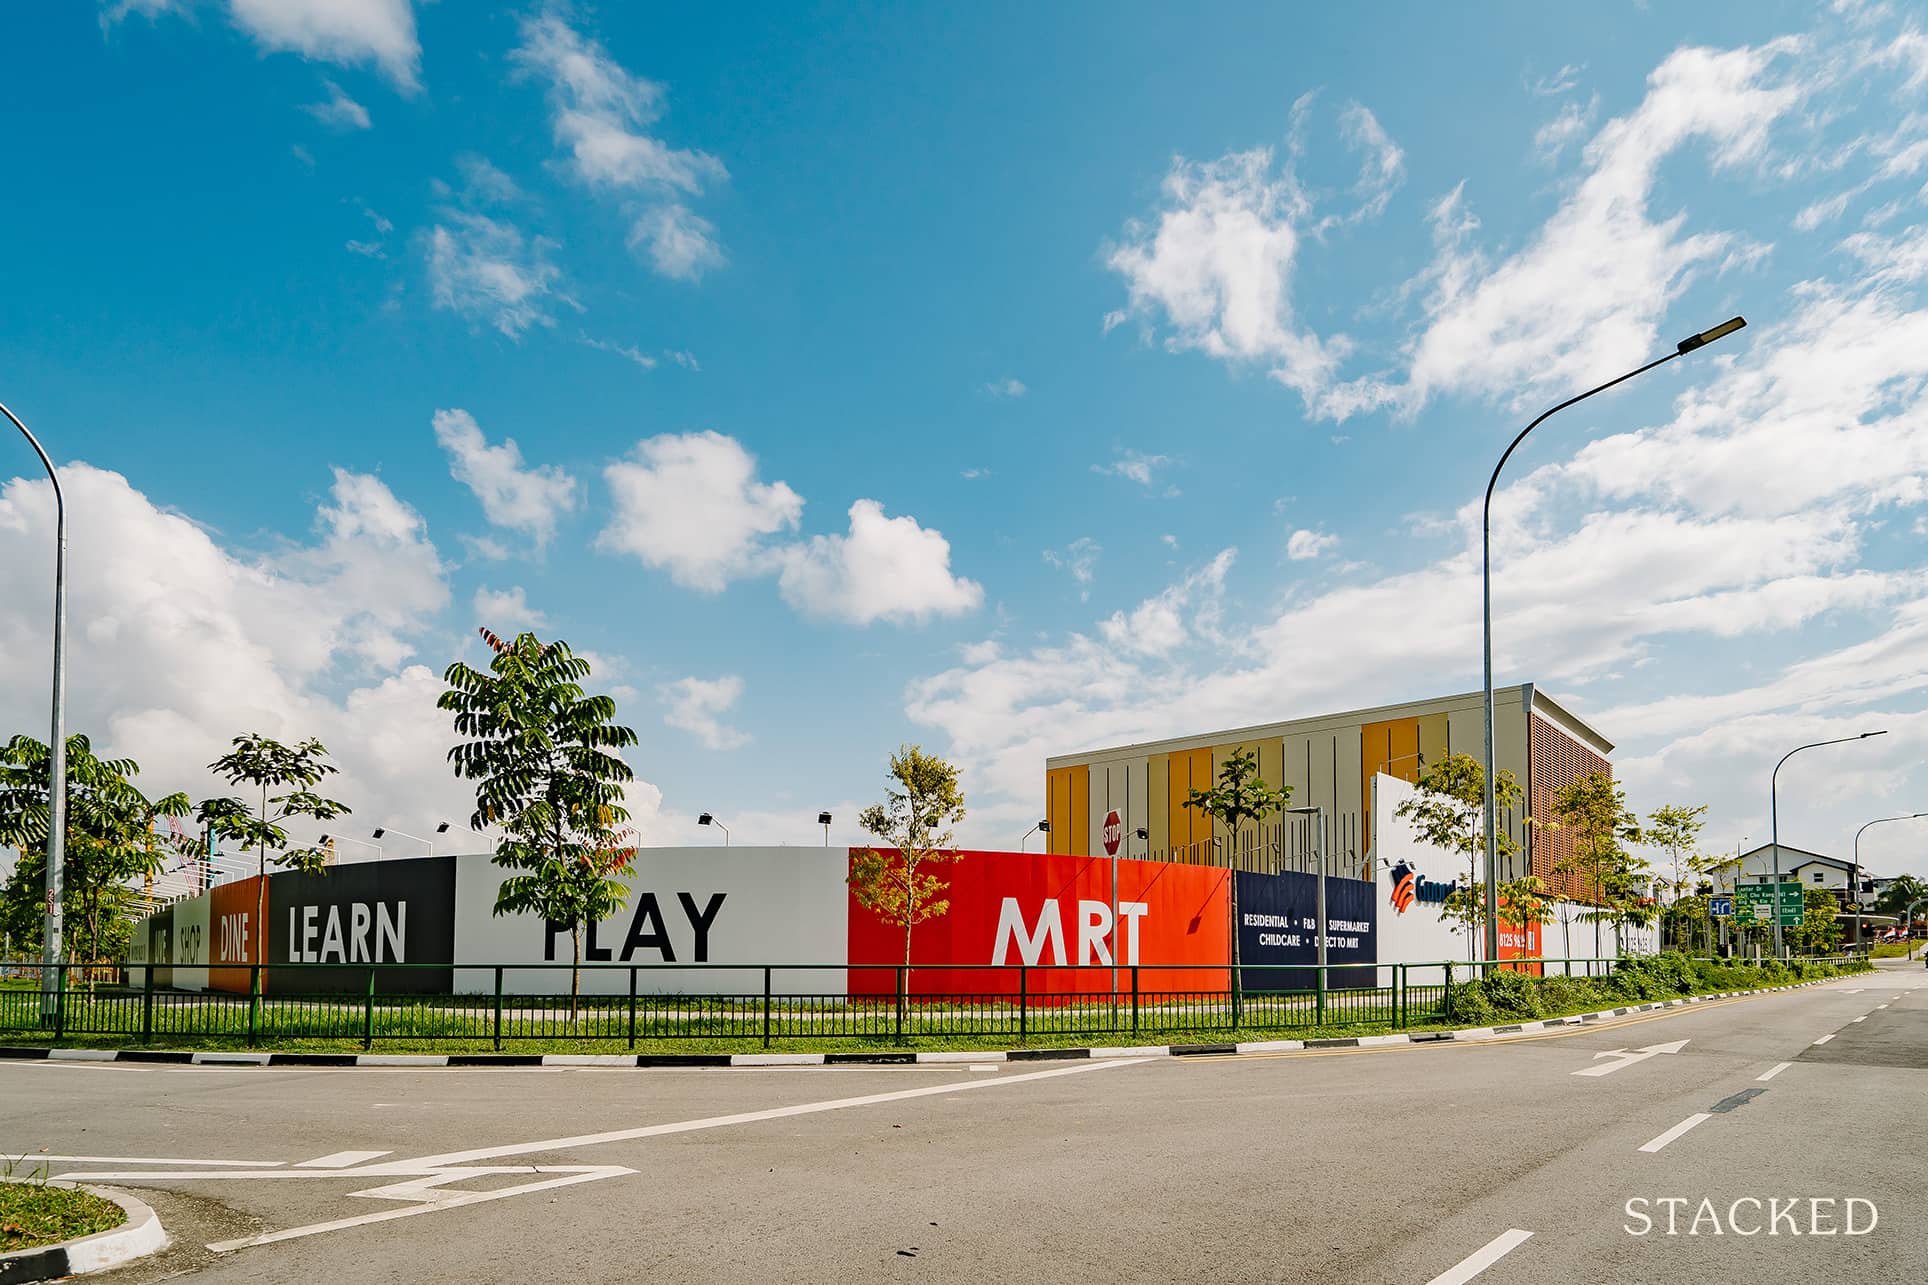
District 18 (Pasir Ris, Tampines) is already known to be more affordable, although we’d expect condos in Tampines Central (the regional hub of the East, near the MRT station) to defy any price dips.
Do remember that, for condos with 60 years or less on the lease, you may receive a lower loan quantum – so even with a lower price, you may be faced with a higher cash outlay.
At Stacked, we like to look beyond the headlines and surface-level numbers, and focus on how things play out in the real world.
If you’d like to discuss how this applies to your own circumstances, you can reach out for a one-to-one consultation here.
And if you simply have a question or want to share a thought, feel free to write to us at stories@stackedhomes.com — we read every message.

0 Comments