Treasure at Tampines Pricing Review: How Its Prices Compare to D18, OCR, and the Wider Market

Get The Property Insights Serious Buyers Read First: Join 50,000+ readers who rely on our weekly breakdowns of Singapore’s property market.

A seasoned content strategist with over 17 years in the real estate and financial journalism sectors, Ryan has built a reputation for transforming complex industry jargon into accessible knowledge. With a track record of writing and editing for leading financial platforms and publications, Ryan's expertise has been recognised across various media outlets. His role as a former content editor for 99.co and a co-host for CNA 938's Open House programme underscores his commitment to providing valuable insights into the property market.
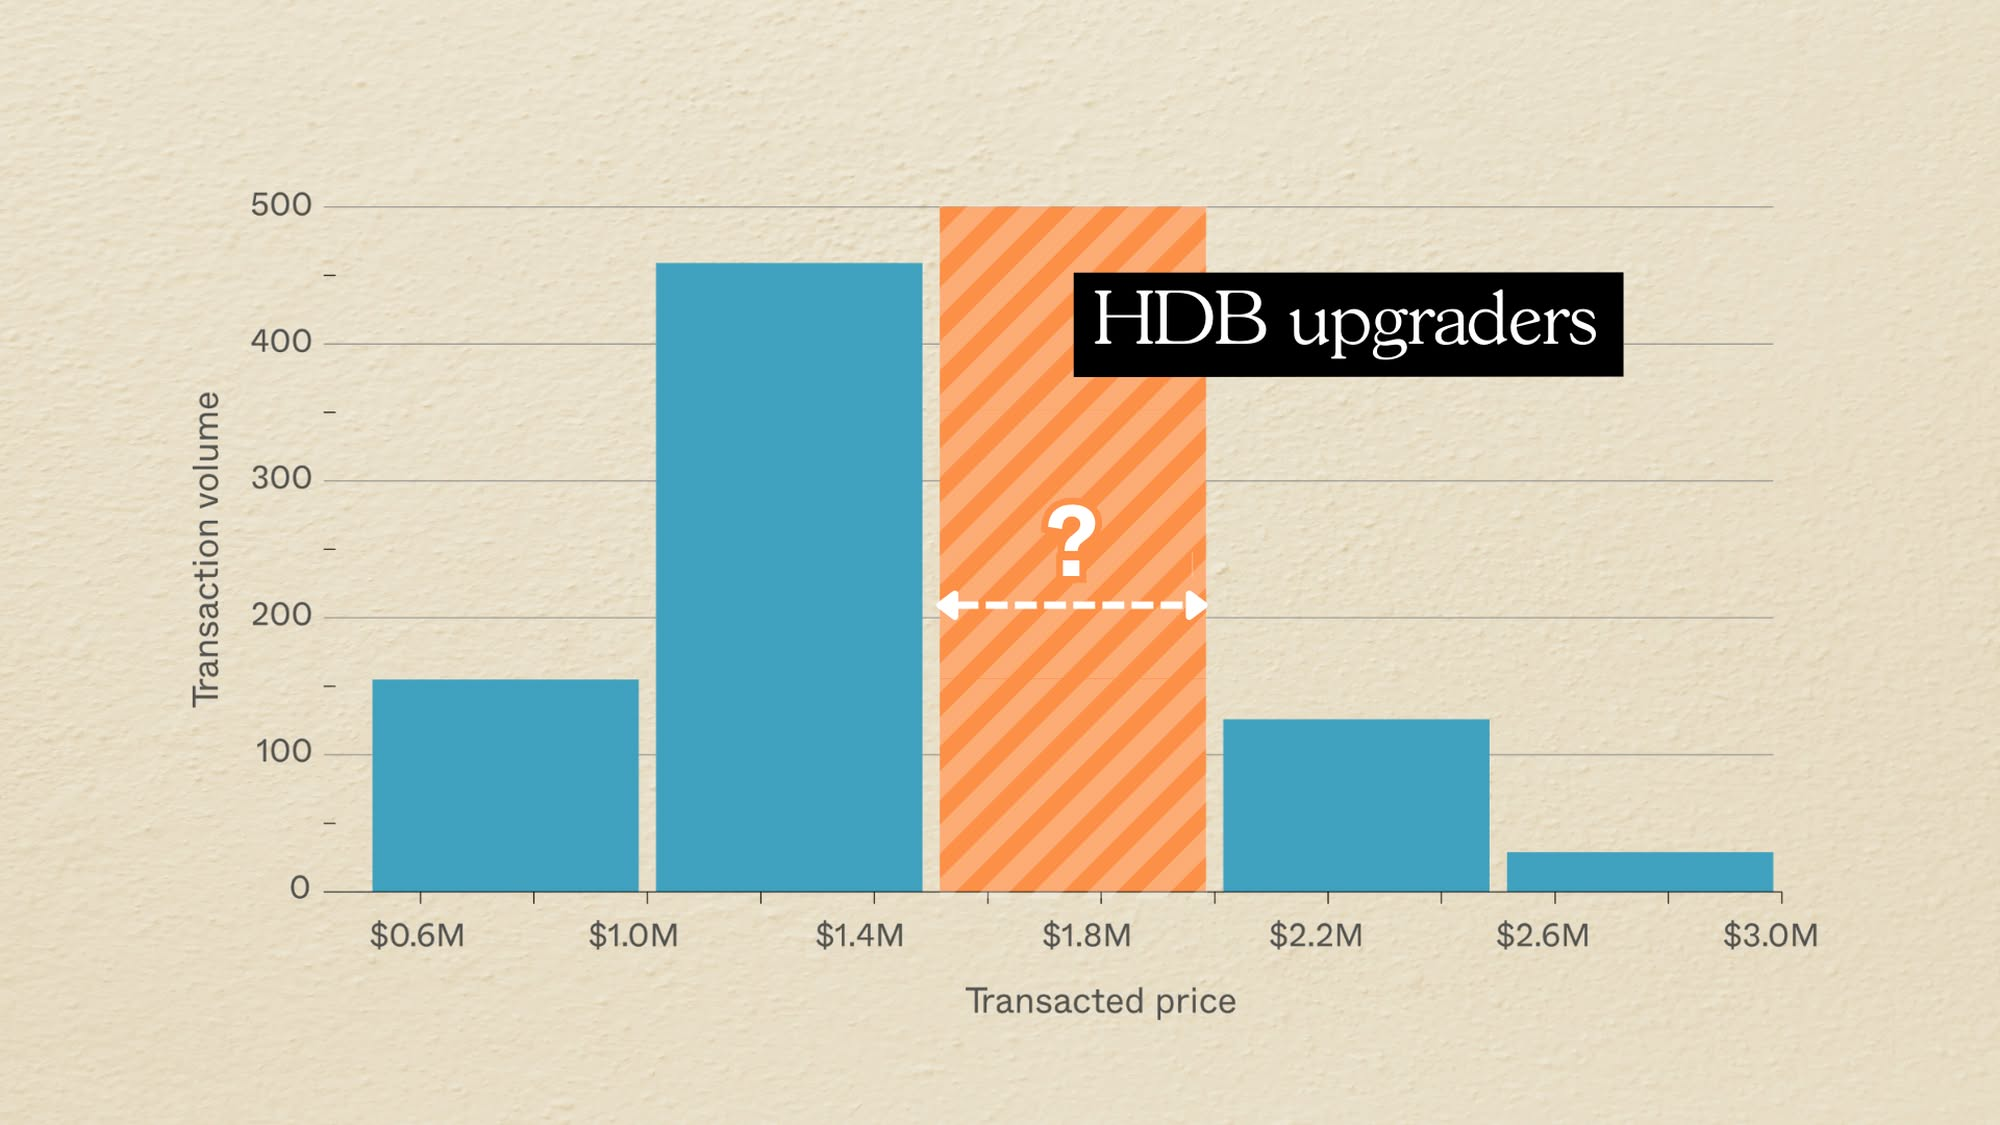
A pricing review of Treasure at Tampines has some challenges; the main one being scale. As of 2025, Treasure at Tampines is the single largest condo project in Singapore with 2,203 units. At this size, it’s really more akin to a micro-town or estate than a typical condo project. That also means a more varied profile of owners, which can range from pure owner-occupiers to entry-level investors to multi-generational families. This can all impact buying and selling behaviour, and the ultimate price point.
Nonetheless, Treasure at Tampines has always been known for being competitively priced; this was part of the sales pitch since even before the launch day. Now on the resale market, it’s one of the few projects where a three-bedder can be had for below $1.7 million; an increasingly rare possibility in 2025.
But does being cheaper necessarily mean better value? Let’s take a closer look at the numbers:
Key Points:
- Price accessibility: Treasure at Tampines remains attractive mainly on quantum, especially for three- and four-bedders that fit upgrader budgets.
- Mega-project competition: With 2,200+ units, resale sellers face heavy competition from within the same development.
- Future supply risk: A wave of new ECs (and Parktown Residence) will add significant competition once they hit MOP.
- Smaller unit pressure: One-bedders face the toughest resale outlook, as Treasure at Tampines already makes up most of D18’s one-bedder stock.
First, let’s look at overall prices
We’ll look at how Treasure at Tampines has performed since its launch, compared to the broader pool of condos in District 18, as well as Singapore-wide. This covers all transaction types: new sale, subsale, and resale.
All tenures
Year | Treasure at Tampines | D18 | All non-landed private properties |
2019 | $1,339 | $1,197 | $1,560 |
2020 | $1,369 | $1,172 | $1,513 |
2021 | $1,410 | $1,192 | $1,600 |
2022 | $1,540 | $1,223 | $1,712 |
2023 | $1,646 | $1,344 | $1,869 |
2024 | $1,698 | $1,415 | $1,886 |
Annualised | 4.86% | 3.40% | 3.86% |
99-year leasehold properties
Year | Treasure at Tampines | D18 | All non-landed private properties |
2019 | $1,339 | $1,199 | $1,474 |
2020 | $1,369 | $1,174 | $1,453 |
2021 | $1,410 | $1,193 | $1,517 |
2022 | $1,540 | $1,223 | $1,595 |
2023 | $1,646 | $1,344 | $1,783 |
2024 | $1,698 | $1,417 | $1,854 |
Annualised | 4.86% | 3.40% | 4.70% |
We see that, in terms of ROI, Treasure at Tampines has outperformed both District 18 and the broader Singapore market. This is also true when compared specifically to other 99-year properties.
Let’s make some comparisons across the OCR, RCR, and CCR:
All tenures
Year | Treasure at Tampines | CCR | RCR | OCR |
2019 | $1,339 | $2,294 | $1,726 | $1,225 |
2020 | $1,369 | $2,181 | $1,681 | $1,229 |
2021 | $1,410 | $2,318 | $1,808 | $1,252 |
2022 | $1,540 | $2,451 | $1,893 | $1,381 |
2023 | $1,646 | $2,512 | $2,102 | $1,518 |
2024 | $1,698 | $2,330 | $2,159 | $1,653 |
Annualised | 4.86% | 0.31% | 4.58% | 6.17% |
99-year leasehold properties
Year | Treasure at Tampines | CCR | RCR | OCR |
2019 | $1,339 | $2,319 | $1,739 | $1,225 |
2020 | $1,369 | $2,226 | $1,714 | $1,222 |
2021 | $1,410 | $2,327 | $1,873 | $1,228 |
2022 | $1,540 | $2,311 | $1,970 | $1,354 |
2023 | $1,646 | $2,316 | $2,186 | $1,520 |
2024 | $1,698 | $2,312 | $2,230 | $1,661 |
Annualised | 4.86% | -0.06% | 5.10% | 6.28% |
Treasure at Tampines underperforms the broader OCR market, whether comparing 99-year leasehold properties or properties overall.
But it’s worth noting that the early years of a new project are often shaped by developer pricing strategies, rather than by pure resale market forces. In Treasure’s case, much of the initial movement between 2019 and 2021 would have been a reflection of developer pricing movements.
So, for more clarity, let’s focus on Treasure at Tampines’s performance in the resale market
The following are based on subsale and resale transactions from 2024 to June 2025
Project | Completion year | Tenure | No. of units | Unit mix | Avg size | Avg $PSF | Avg price | No. of tnx |
MELVILLE PARK | 1996 | 99-years | 1232 | 2, 3 | 1153 | $915 | $1,052,968 | 85 |
PINEVALE (EC) | 1999 | 99-years | 322 | 3, 4 | 1418 | $1,043 | $1,466,914 | 13 |
SIMEI GREEN CONDOMINIUM (EC) | 1999 | 99-years | 602 | 3 | 1168 | $1,086 | $1,265,450 | 20 |
SAVANNAH CONDOPARK | 2005 | 99-years | 648 | 2, 3, 4, 5 | 1426 | $1,088 | $1,537,243 | 39 |
CHANGI RISE CONDOMINIUM | 2004 | 99-years | 598 | 2, 3, 4 | 1379 | $1,098 | $1,507,243 | 37 |
EASTPOINT GREEN | 1999 | 99-years | 646 | 1, 2, 3, 4, 5 | 1084 | $1,130 | $1,224,678 | 39 |
THE EDEN AT TAMPINES (EC) | 2003 | 99-years | 430 | 2, 3, 4 | 1245 | $1,162 | $1,440,708 | 25 |
TROPICAL SPRING | 2002 | 99-years | 242 | 2, 3 | 1389 | $1,177 | $1,634,347 | 8 |
MODENA | 2001 | 99-years | 230 | 2, 3, 4 | 1425 | $1,226 | $1,743,333 | 9 |
THE TROPICA | 2000 | 99-years | 537 | 2, 3, 4 | 1209 | $1,254 | $1,523,278 | 14 |
SUNHAVEN | 2002 | Freehold | 295 | 2, 3, 4 | 1371 | $1,259 | $1,702,000 | 5 |
ARC AT TAMPINES (EC) | 2014 | 99-years | 574 | 2, 3, 4 | 1086 | $1,353 | $1,465,860 | 53 |
DOUBLE BAY RESIDENCES | 2012 | 99-years | 646 | 1, 2, 3, 4, 5 | 1244 | $1,381 | $1,685,844 | 36 |
THE SANTORINI | 2017 | 99-years | 597 | 1, 2, 3, 4, 5 | 847 | $1,423 | $1,198,678 | 50 |
Q BAY RESIDENCES | 2016 | 99-years | 630 | 1, 2, 3, 4, 5 | 900 | $1,447 | $1,304,041 | 66 |
WATERVIEW | 2014 | 99-years | 696 | 2, 3, 4, 5, 6 | 1051 | $1,449 | $1,527,378 | 42 |
CITYLIFE@TAMPINES (EC) | 2016 | 99-years | 514 | 2, 3, 4, 5 | 1317 | $1,466 | $1,901,308 | 45 |
THE ALPS RESIDENCES | 2019 | 99-years | 626 | 1, 2, 3, 4, 5 | 784 | $1,496 | $1,166,538 | 51 |
MY MANHATTAN | 2014 | 99-years | 301 | 1, 2, 3, 4 | 998 | $1,523 | $1,505,444 | 20 |
THE TAMPINES TRILLIANT (EC) | 2015 | 99-years | 670 | 3, 4 | 1122 | $1,564 | $1,742,980 | 68 |
THE TAPESTRY | 2021 | 99-years | 861 | 1, 2, 3, 4, 5 | 746 | $1,686 | $1,252,864 | 130 |
TREASURE AT TAMPINES | 2023 | 99-years | 2203 | 1, 2, 3, 4, 5 | 868 | $1,710 | $1,484,957 | 352 |
Among the projects in Tampines, Treasure stands out in three ways: it is the newest, the largest, and carries the highest average $PSF at around $1,710.
Among the projects in Tampines, Treasure stands out in three ways: it is the newest, the largest, and carries the highest average $PSF at around $1,710. In contrast, most other large-scale condos in the area still transact below $1,500 psf, with many older projects under $1,200 psf.
That said, Treasure’s compact average unit size of 868 sq ft helps to keep overall quantum low: at roughly $1.48 million on average, it remains accessible to most HDB upgraders.
Let’s break this down into the various unit types
The figures below are also based on subsale and resale transactions, from 2024 to June 2025.
1-bedroom units
Project | Avg $PSF | Avg price | No. of tnx | Avg size (based on units transacted) | Completion year |
THE SANTORINI | $1,437 | $735,176 | 17 | 512 | 2017 |
THE ALPS RESIDENCES | $1,565 | $737,491 | 12 | 472 | 2019 |
DOUBLE BAY RESIDENCES | $1,371 | $737,500 | 2 | 538 | 2012 |
THE TAPESTRY | $1,712 | $779,379 | 39 | 455 | 2021 |
Q BAY RESIDENCES | $1,428 | $780,370 | 21 | 551 | 2016 |
TREASURE AT TAMPINES | $1,704 | $798,309 | 33 | 469 | 2023 |
MY MANHATTAN | $1,600 | $852,000 | 4 | 533 | 2014 |
EASTPOINT GREEN | $953 | $862,000 | 1 | 904 | 1999 |

Although Treasure at Tampines has the second-highest average $PSF for one-bedders, its overall quantum remains in the mid-range. This is due to the compact 469 sq ft average.
(In general, the smaller the unit, the lower the quantum, but the higher the $PSF)
2-bedroom units
Project | Avg $PSF | Avg price | No. of tnx | Avg size (based on units transacted) | Completion year |
MELVILLE PARK | $922 | $894,650 | 45 | 971 | 1996 |
THE ALPS RESIDENCES | $1,458 | $1,016,067 | 15 | 697 | 2019 |
THE EDEN AT TAMPINES (EC) | $1,195 | $1,028,800 | 1 | 861 | 2003 |
THE TAPESTRY | $1,682 | $1,050,309 | 46 | 625 | 2021 |
THE TROPICA | $1,076 | $1,065,000 | 2 | 990 | 2000 |
TREASURE AT TAMPINES | $1,701 | $1,103,744 | 134 | 648 | 2023 |
ARC AT TAMPINES (EC) | $1,377 | $1,105,571 | 7 | 803 | 2014 |
EASTPOINT GREEN | $1,131 | $1,108,397 | 14 | 984 | 1999 |
THE SANTORINI | $1,423 | $1,164,125 | 16 | 819 | 2017 |
SAVANNAH CONDOPARK | $1,073 | $1,173,750 | 4 | 1101 | 2005 |
Q BAY RESIDENCES | $1,453 | $1,199,529 | 20 | 825 | 2016 |
WATERVIEW | $1,401 | $1,221,706 | 17 | 875 | 2014 |
MODENA | $1,306 | $1,265,000 | 1 | 969 | 2001 |
CITYLIFE@TAMPINES (EC) | $1,645 | $1,292,667 | 3 | 786 | 2016 |
DOUBLE BAY RESIDENCES | $1,381 | $1,318,583 | 13 | 955 | 2012 |
MY MANHATTAN | $1,527 | $1,342,127 | 7 | 880 | 2014 |
SUNHAVEN | $1,207 | $1,480,000 | 2 | 1238 | 2002 |

For two-bedders, Treasure has the highest average $PSF among its peers; but the overall price is on the lower end, again because unit size averages are the smallest in the group (648 sq ft.)
Three-bedroom units
Project | Avg $PSF | Avg price | No. of tnx | Avg size (based on units transacted) | Completion year |
MELVILLE PARK | $907 | $1,231,075 | 40 | 1356 | 1996 |
SIMEI GREEN CONDOMINIUM (EC) | $1,086 | $1,265,450 | 20 | 1168 | 1999 |
EASTPOINT GREEN | $1,137 | $1,307,620 | 24 | 1150 | 1999 |
CHANGI RISE CONDOMINIUM | $1,098 | $1,339,483 | 29 | 1222 | 2004 |
PINEVALE (EC) | $1,053 | $1,397,491 | 12 | 1329 | 1999 |
THE EDEN AT TAMPINES (EC) | $1,160 | $1,402,549 | 18 | 1215 | 2003 |
SAVANNAH CONDOPARK | $1,072 | $1,419,368 | 19 | 1335 | 2005 |
ARC AT TAMPINES (EC) | $1,354 | $1,423,256 | 34 | 1052 | 2014 |
THE ALPS RESIDENCES | $1,485 | $1,475,106 | 24 | 994 | 2019 |
THE TROPICA | $1,279 | $1,560,444 | 11 | 1220 | 2000 |
Q BAY RESIDENCES | $1,457 | $1,591,263 | 14 | 1092 | 2016 |
THE SANTORINI | $1,402 | $1,626,914 | 13 | 1167 | 2017 |
TROPICAL SPRING | $1,177 | $1,634,347 | 8 | 1389 | 2002 |
TREASURE AT TAMPINES | $1,717 | $1,636,277 | 119 | 953 | 2023 |
THE TAMPINES TRILLIANT (EC) | $1,552 | $1,658,994 | 56 | 1078 | 2015 |
WATERVIEW | $1,476 | $1,693,429 | 21 | 1147 | 2014 |
MY MANHATTAN | $1,497 | $1,735,600 | 5 | 1165 | 2014 |
MODENA | $1,200 | $1,740,714 | 7 | 1453 | 2001 |
CITYLIFE@TAMPINES (EC) | $1,494 | $1,750,605 | 20 | 1172 | 2016 |
THE TAPESTRY | $1,665 | $1,751,884 | 39 | 1055 | 2021 |
SUNHAVEN | $1,294 | $1,850,000 | 3 | 1460 | 2002 |
DOUBLE BAY RESIDENCES | $1,402 | $1,901,322 | 18 | 1360 | 2012 |

Treasure continues to show the highest average $PSF among the Tampines projects. Overall average quantum for its three-bedders is only in the mid-range though, as its units are smaller at an average of 1,100 sq ft.
Four-bedroom units
Project | Avg $PSF | Avg price | No. of tnx | Avg size (based on units transacted) | Completion year |
THE EDEN AT TAMPINES (EC) | $1,162 | $1,623,833 | 6 | 1399 | 2003 |
SAVANNAH CONDOPARK | $1,110 | $1,768,092 | 16 | 1617 | 2005 |
ARC AT TAMPINES (EC) | $1,334 | $1,796,740 | 12 | 1348 | 2014 |
THE SANTORINI | $1,430 | $1,915,000 | 4 | 1338 | 2017 |
WATERVIEW | $1,506 | $1,954,722 | 4 | 1297 | 2014 |
THE TROPICA | $1,338 | $2,031,000 | 1 | 1518 | 2000 |
CITYLIFE@TAMPINES (EC) | $1,428 | $2,075,233 | 21 | 1465 | 2016 |
Q BAY RESIDENCES | $1,458 | $2,085,989 | 10 | 1435 | 2016 |
CHANGI RISE CONDOMINIUM | $1,097 | $2,115,375 | 8 | 1947 | 2004 |
THE TAMPINES TRILLIANT (EC) | $1,616 | $2,134,917 | 12 | 1325 | 2015 |
MY MANHATTAN | $1,469 | $2,157,000 | 4 | 1464 | 2014 |
DOUBLE BAY RESIDENCES | $1,429 | $2,215,000 | 2 | 1550 | 2012 |
TREASURE AT TAMPINES | $1,732 | $2,220,488 | 54 | 1282 | 2023 |
MODENA | $1,325 | $2,240,000 | 1 | 1690 | 2001 |
PINEVALE (EC) | $925 | $2,300,000 | 1 | 2486 | 1999 |
THE TAPESTRY | $1,694 | $2,493,472 | 4 | 1472 | 2021 |

Treasure at Tampines’ four-bedders also have the highest average $PSF in the area. Again, we see the developer went with smaller units (average of 1,282 sq ft) to try to make the quantum affordable, but in this case, it didn’t really work, as Treasure’s four-bedders are still on the higher end for overall price.
Five-bedroom units
Project | Avg $PSF | Avg price | No. of tnx | Avg size (based on units transacted) | Completion year |
Q BAY RESIDENCES | $1,490 | $2,550,800 | 1 | 1711 | 2016 |
TREASURE AT TAMPINES | $1,646 | $2,819,648 | 12 | 1713 | 2023 |
THE TAPESTRY | $1,661 | $2,932,500 | 2 | 1765 | 2021 |
DOUBLE BAY RESIDENCES | $924 | $3,420,000 | 1 | 3703 | 2012 |

Once again, the pattern repeats: highest $PSF, but with smaller sizes to keep the quantum low. This allows Treasure at Tampines to keep within the lower to mid-range for overall price.
Treasure’s five-bedder sizes, averaging 1,713 sq ft, are comparable to those at Q Bay Residences and The Tapestry. The standout exception is Double Bay Residences, where the single transaction involved a duplex unit with an oversized PES and private pool (3,703 sq ft and a higher overall price).
Overall, we can see that – despite often having the highest $PSF on average – the one to four-bedder units tend to be priced lower than surrounding condos in terms of quantum. In effect, buyers are trading space for affordability.
Whether this is a good trade-off thus depends on the efficiency of the unit layouts; so let’s compare Treasure at Tampines to its neighbours.
Now let’s compare Treasure at Tampines to other 99-year leasehold projects, launched within the same year
This will let us know if its performance is simply due to the timing of the launch (i.e., whether the performance is unique to Treasure, or if every other condo launched that year did well anyway).
Year | AVENUE SOUTH RESIDENCE | MIDWOOD | PARC CLEMATIS | RIVIERE | SENGKANG GRAND RESIDENCES | THE FLORENCE RESIDENCES | TREASURE AT TAMPINES | |
2019 | $1,957 | $1,643 | $1,610 | $2,894 | $1,747 | $1,448 | $1,339 | |
2020 | $2,060 | $1,626 | $1,620 | $2,610 | $1,732 | $1,542 | $1,369 | |
2021 | $2,204 | $1,685 | $1,694 | $2,665 | $1,719 | $1,674 | $1,410 | |
2022 | $2,346 | $1,712 | $1,773 | $2,868 | $1,812 | $1,747 | $1,540 | |
2023 | $2,243 | $2,026 | $1,988 | $3,066 | $2,001 | $1,773 | $1,646 | |
2024 | $2,278 | $1,922 | $2,058 | $2,872 | $2,028 | $1,773 | $1,698 | |
Annualised | 3.08% | 3.19% | 5.04% | -0.15% | 3.03% | 4.13% | 4.86% |
Treasure at Tampines performs quite well compared to other condos launched in the same year. Parc Clematis edged it out with a 5.04 per cent annualised gain, but Treasure’s 4.86 per cent is second best on the list. It beat out Avenue South Residence, Midwood, Florence Residences, and Sengkang Grand Residences, which all hovered in the three per cent range.
Still, it’s worth remembering that early price movements often reflect the developer’s launch pricing more than raw market forces – developers who used lower entry pricing/discounts, like Parc Clematis and Treasure, allowed for more room to climb.
With that in mind, let’s make some comparisons to Treasure’s immediate neighbouring condos.
Our first point of comparison is The Tapestry
The Tapestry is the second-youngest project in the area after Treasure at Tampines, with just a two-year age gap. Both projects share similar unit types, but The Tapestry carries a slightly lower average $PSF.
While nothing matches the sheer unit count of Treasure, The Tapestry’s still a large-scale project with over 800 units; this makes it a viable alternative for buyers who want something substantial but less busy than Treasure.
Let’s see how their units compare:
1-bedroom units

Treasure at Tampines – 463 sqft, #11 sold in June 2025 at $810,000 and The Tapestry – 441 sqft, #11 sold in May 2025 at $750,000
These are the smallest one-bedders in both projects, and their sizes are quite comparable. The layouts are also broadly similar, though with a few key differences.
At The Tapestry, the bedroom is separated from the living area, while at Treasure at Tampines, it functions more like a studio, with the bedroom opening directly into the living space. You can partition it off if you prefer separation, but this comes with a catch: at Treasure, the bathroom sits within the bedroom, so enclosing the space would mean guests have to walk through the bedroom to use it. Some homeowners dislike potential guests walking through their bedroom this way.
In contrast, The Tapestry’s layout includes a Jack and Jill bathroom that can be accessed from both the bedroom and the kitchen area, making it more flexible.
As for pricing, The Tapestry averages slightly lower at $779,379 compared to $798,309 at Treasure at Tampines. However, the price difference is so small – and the units so similar in size – that it’s hard to judge which one is clearly better.
2-bedroom units

Treasure at Tampines – 581 sqft, #04 sold in July 2025 at $1.025 and The Tapestry – 603 sqft, #04 sold in June 2025 at $999,000
These are the smallest two-bedders in both projects, and their sizes are fairly comparable. Both are two-bedroom, one-bathroom layouts, but there are some notable differences.
At The Tapestry, the bathroom is a Jack and Jill configuration that connects to both the master bedroom and the living area. In Treasure at Tampines, the bathroom is detached from both bedrooms, which can be less convenient.
The Tapestry also benefits from more regular-shaped bedrooms that maximise usable space, while Treasure’s layout has a few odd corners. Another distinction is in the entrances: Treasure at Tampines opens into a short walkway before reaching the kitchen, whereas The Tapestry’s entrance leads directly into the kitchen area.
On balance, The Tapestry’s layout comes across as more efficient and functional. Price-wise, the difference is marginal: it’s slightly lower at $1,050,309 compared to $1,103,744 at Treasure at Tampines.
3-bedroom units

Treasure at Tampines – 915 sqft, #12 sold in July 2025 at $1.68M and The Tapestry – 926 sqft, #07 sold in July 2025 at $1.608M
While 926 sq ft is The Tapestry’s smallest three-bedder, the smallest at Treasure at Tampines comes in at 818 sq ft.
Both projects have living and dining areas that are nicely segregated. Treasure at Tampines offers a larger balcony that stretches across the living room and extends slightly into one of the bedrooms, whereas The Tapestry’s balcony spans only the width of the living area. If there must be a balcony, most homeowners will prefer the larger one at Treasure.
Another key difference is the kitchen: Treasure at Tampines has an open-concept kitchen, while The Tapestry provides an enclosed kitchen with a small yard. For households that do heavier cooking, The Tapestry’s configuration may be more practical.
The bedroom arrangements differ slightly, but in both projects, they are regularly shaped and reasonably sized.
In terms of pricing, Treasure at Tampines averages $1,636,277; more affordable than The Tapestry’s $1,751,884. That said, it’s important to note that The Tapestry generally offers larger unit sizes overall, ranging from 926 to 1,346 sq ft, compared to Treasure’s three-bedders, which range from 818 to 1,087 sq ft.
4-bedroom units

Treasure at Tampines – 1,238 sqft, #06 sold in July 2025 at $2.26 and The Tapestry – 1,432 sqft, #05 sold in Oct 2024 at $2.435M
We’re going with the smallest four-bedders in both projects, though the unit at The Tapestry is notably larger than the one at Treasure at Tampines.
Treasure at Tampines offers a four-bedroom, two-bathroom configuration with just one ensuite, while The Tapestry offers a four-bedroom, three-bathroom layout with two ensuites. Treasure follows a more conventional layout, whereas The Tapestry adopts a newer dumbbell configuration, which is more efficient.
The Tapestry also has features that lean into the premium segment: it comes with a private lift, a dry kitchen, and an additional WC, on top of the enclosed kitchen, yard, and utility space that both projects provide.
Balcony sizes are large in both layouts. At Treasure, the balcony extends from the living room across to one of the bedrooms, while at The Tapestry it spans the entire length of the living and dining areas. In terms of bedrooms, all four at The Tapestry are large enough to fit double beds comfortably, whereas one of the bedrooms at Treasure is slightly smaller.
On average pricing, Treasure at Tampines comes in at $2,220,488, which is more affordable than The Tapestry’s $2,493,472. That said, it’s important to keep in mind that The Tapestry’s four-bedders are generally larger, ranging from 1,432 to 1,668 sq ft, compared to 1,238 to 1,367 sq ft at Treasure.
5-bedroom units

Treasure at Tampines – 1,722 sqft, #10 sold in May 2025 at $2,988,888 and The Tapestry – 1,765 sqft, #14 sold in Aug 2024 at $3.035M
While the 1,722 sq ft unit at Treasure at Tampines is its largest five-bedder, the 1,765 sq ft unit at The Tapestry is its smallest five-bedder.
Both are five-bedroom, three-bathroom configurations, but The Tapestry is notably a dual-key unit, and includes an additional study. The Tapestry also comes with a private lift, a feature usually associated with luxury developments, better privacy, and higher maintenance costs. The studio portion of the dual-key unit includes a bedroom with an attached bathroom and a kitchenette, giving it standalone functionality.
Both projects offer enclosed kitchens with a yard, utility, and WC. The Tapestry goes a step further with a dry kitchen; Treasure doesn’t include one, though there is sufficient space in the dining area to set up a small dry kitchen if desired.
At Treasure, only the master bedroom is ensuite, with two common bathrooms serving the rest. At The Tapestry, however, one common bathroom is a Jack and Jill design, effectively giving it three ensuite bedrooms.
Both units feature spacious balconies in the living area and an additional one in the master bedroom. The master bedrooms themselves are generously sized, with The Tapestry’s also including a walk-in closet.
In terms of pricing, Treasure at Tampines averages $2,819,648, making it more affordable than The Tapestry at $2,932,500. That said, The Tapestry’s five-bedder range runs larger, from 1,765 to 1,991 sq ft, compared to 1,668 to 1,722 sq ft at Treasure.
Let’s now take a look at Treasure at Tampines’ profitability
This is across all transaction types:
Gains
Bedroom type | Average gains | Average purchase price | Average ROI | No. of tnx | Average holding period (years) |
1-bedroom | $124,295 | $659,376 | 19.05% | 73 | 4.3 |
2-bedroom | $176,008 | $903,003 | 19.47% | 217 | 4.0 |
3-bedroom | $333,099 | $1,253,222 | 26.66% | 204 | 3.9 |
4-bedroom | $487,669 | $1,712,426 | 28.58% | 66 | 3.5 |
5-bedroom | $730,511 | $2,043,133 | 35.85% | 15 | 3.8 |
Losses
Bedroom type | Average gains | Average purchase price | Average ROI | No. of tnx | Average holding period (years) |
5-bedroom | -$238,000 | $2,988,000 | -7.97% | 1 | 0.9 |
So far, there has only been a single unprofitable transaction: a five-bedroom unit with a holding period of less than a year. This doesn’t signify much, as almost any high quantum unit tends to see losses when the holding period is so short. E.g., it’s sometimes due to financial issues, divorce or other such reasons.
Across the profitable sales, a clear pattern emerges: the larger the unit, the higher the average ROI.
Across the profitable sales, a clear pattern emerges: the larger the unit, the higher the average ROI. One-bedders and two-bedders generated returns in the 19 per cent range, while four- and five-bedders achieved ROIs closer to 30–36 per cent. This suggests that family buyers and long-term owner occupiers are driving demand at Treasure.
Besides size, another important issue is the facing of the unit; so let’s take a look at profitability based on facing as well as unit types
Given the huge number of stacks at Treasure at Tampines, picking the “right” one has always been hard to work out. We’ve previously highlighted performance related to various stacks, but as of August 2025, these will be the most recent findings:
Type of facing | 1BR | 2BR | 3BR | 4BR | 5BR |
Facing Tampines St 11 HDB/Tampines Changkat CC | 26.7% | 20.2% | 25.6% | ||
Facing PIE | 23.4% | 20.8% | 28.5% | 31.2% | |
Facing pool | 16.4% | 18.5% | 25.3% | 28.0% | 31.6% |
Facing butterfly garden | 23.9% | 30.1% | |||
Facing Tampines Lane HDB | 19.6% | 29.0% | 44.0% | ||
Facing tennis court | 19.9% |

Type of facing | 1BR | 2BR | 3BR | 4BR | 5BR |
Facing Tampines St 11 HDB/Tampines Changkat CC | $164,000 | $175,267 | $300,262 | ||
Facing PIE | $147,886 | $181,564 | $345,321 | $493,282 | |
Facing pool | $110,215 | $173,292 | $336,116 | $491,924 | $643,627 |
Facing butterfly garden | $222,000 | $344,333 | |||
Facing Tampines Lane HDB | $175,750 | $345,263 | $854,444 | ||
Facing tennis court | $324,888 |

Units facing Tampines Street 11 and the Changkat CC have done particularly well. One-bedroom units here averaged gains of around $164,000, translating to about 26.7 per cent ROI. Three-bedroom units facing this direction also performed solidly, with average gains of about $300,000 and a 25.6 per cent ROI.
More from Stacked
A New River Valley Condo From Just $1.2M? Here’s What You Need To Know About River Green’s Pricing
Most of us don’t usually associate “District 9” with affordability, but River Green is a surprising exception. Launching from $1.2…
It could be that units facing Tampines Street are more convenient and private than, say, the units facing the noisy expressway.
But even for PIE-facing stacks, resale transactions suggest buyers still see value. One-bedders facing the PIE averaged a 23.4 per cent ROI, while two-bedders were slightly better at 20.8 per cent. Larger units performed more strongly with these facings, with three-bedders at 28.5 per cent and four-bedders leading the category at 31.2 per cent ROI.
For butterfly-garden facing stacks, two-bedders recorded the best results for their size with this facing, averaging gains of 23.9 per cent ROI. Three-bedders fared even better at 30.1 per cent ROI, among the strongest returns in the project overall. Greenery views have long been a favourite among buyers, so it’s not too surprising.
Tampines Lane HDB-facing stacks turned out better than some might expect, particularly for larger units. Five-bedders here were the clear winners of the project, averaging gains of $854,444 and an ROI of 44 per cent. The scarcity of such large units, combined with outward-facing orientation, may be a major draw.
Pool-facing stacks, on the other hand, consistently underperformed.
One-bedders here were the weakest of the lot, with only a 16.5 per cent ROI. Two- and three-bedders fared slightly better, but still trailed at 18.5 and 25.3 per cent ROI respectively.
Even among five-bedders, pool-facing units averaged a lower 31.6 per cent ROI compared to the 44 per cent seen for Tampines Lane facings. This may be a sign that weekend noise is significant, as homeowners and their friends, relatives, etc. crowd into the pools.
Finally, the smaller number of four-bedders facing the tennis court showed the weakest results among the larger units, with a 19.9 per cent ROI.
Overall, outward-facing stacks toward Tampines Lane, the butterfly garden or even the PIE generally outperformed pool-facing ones.
The biggest differences were at the extremes, with one- and five-bedders showing more than ten percentage points in ROI between the best and worst facings.
As an aside: sometime ago in the full review, we also mentioned that stacks -1, 3, 5, 7, 9, 11, and 13 – face Tampines Street rather than the expressway, which means they avoid both the pool-facing proximity issue and the road noise from the PIE. This was generally reflected in the performance above.
Let’s now break this down further into the different transaction types (new sale, subsale, and resale):
New sale to subsale and resale
Gains
Bedroom type | Average gains | Average purchase price | Average ROI | No. of tnx | Average holding period (years) |
1-bedroom | $124,841 | $658,742 | 19.14% | 72 | 4.3 |
2-bedroom | $176,008 | $903,003 | 19.47% | 217 | 4.0 |
3-bedroom | $333,099 | $1,253,222 | 26.66% | 204 | 3.9 |
4-bedroom | $487,669 | $1,712,426 | 28.58% | 66 | 3.5 |
5-bedroom | $730,511 | $2,043,133 | 35.85% | 15 | 3.8 |
Subsale to resale
Gains
Bedroom type | Average gains | Average purchase price | Average ROI | No. of tnx | Average holding period (years) |
1-bedroom | $85,000 | $705,000 | 12.06% | 1 | 3.4 |
Losses
Bedroom type | Average gains | Average purchase price | Average ROI | No. of tnx | Average holding period (years) |
5-bedroom | -$238,000 | $2,988,000 | -7.97% | 1 | 0.9 |
At present, there are only two subsale to resale transactions recorded: one profitable one-bedder, and one unprofitable five-bedder (as mentioned above). This means that most of the profitability comes from first-buyers when they enter the resale market, which so far shows consistent gains across all unit types.
Now, let’s take a look at how The Tapestry has been performing so far
The following includes all subsale and resale transactions:
Gains
Bedroom type | Average gains | Average purchase price | Average ROI | No. of tnx | Average holding period (years) |
1-bedroom | $87,784 | $678,837 | 12.98% | 78 | 5.2 |
2-bedroom | $148,930 | $904,583 | 16.41% | 76 | 4.8 |
3-bedroom | $363,394 | $1,329,741 | 27.29% | 55 | 4.8 |
4-bedroom | $461,751 | $1,740,164 | 26.51% | 13 | 4.3 |
5-bedroom | $685,350 | $2,247,150 | 30.53% | 2 | 5.4 |
Losses
Bedroom type | Average gains | Average purchase price | Average ROI | No. of tnx | Average holding period (years) |
2-bedroom | -$68,800 | $848,800 | -8.11% | 1 | 2.7 |
So far, The Tapestry has also only recorded one unprofitable transaction: a two-bedder with a holding period of under three years.
A similar pattern emerges here as with Treasure at Tampines: the larger the unit, the higher the average ROI. However, when compared side by side, The Tapestry’s average ROI for most unit types tends to be lower than Treasure’s. But the notable exceptions are the three-bedders, which have outperformed.
Next, let’s look at what happened in the subsale and resale market
Gains
Bedroom type | Average gains | Average purchase price | Average ROI | No. of tnx | Average holding period (years) |
1-bedroom | $88,855 | $677,440 | 13.15% | 76 | 5.3 |
2-bedroom | $149,834 | $905,801 | 16.47% | 74 | 4.9 |
3-bedroom | $367,253 | $1,326,125 | 27.60% | 54 | 4.8 |
4-bedroom | $461,751 | $1,740,164 | 26.51% | 13 | 4.3 |
5-bedroom | $685,350 | $2,247,150 | 30.53% | 2 | 5.4 |
Losses
Bedroom type | Average gains | Average purchase price | Average ROI | No. of tnx | Average holding period (years) |
2-bedroom | -$68,800 | $848,800 | -8.11% | 1 | 2.7 |
Subsale to resale
Gains
Bedroom type | Average gains | Average purchase price | Average ROI | No. of tnx | Average holding period (years) |
2-bedroom | $158,000 | $780,000 | 20.26% | 1 | 3.2 |
3-bedroom | $155,000 | $1,525,000 | 10.16% | 1 | 3.2 |
Resale to resale
Gains
Bedroom type | Average gains | Average purchase price | Average ROI | No. of tnx | Average holding period (years) |
1-bedroom | $47,056 | $731,944 | 6.48% | 2 | 3.1 |
2-bedroom | $73,000 | $939,000 | 7.77% | 1 | 2.0 |
The subsale to resale transactions tell a mixed story. The two-bedder in this category recorded the highest ROI among its peers, but since there was only one unit transacted, we can’t read too much into it. Similarly, the subsale to resale three-bedder posted a lower ROI than other transaction types, though this too, was just a single transaction.
For resale-to-resale deals, the average ROI does come in lower; but the low transaction volumes mean it may not be an accurate reflection.
Let’s take a look at the two projects’ overall profitability side by side
Gains | Losses | ||||
Bedroom type | Treasure at Tampines average ROI | The Tapestry average ROI | Difference in ROI | Treasure at Tampines average ROI | The Tapestry average ROI |
1-bedroom | 19.05% | 12.98% | 6.07% | ||
2-bedroom | 19.47% | 16.41% | 3.06% | -8.11% | |
3-bedroom | 26.66% | 27.29% | -0.62% | ||
4-bedroom | 28.58% | 26.51% | 2.07% | ||
5-bedroom | 35.85% | 30.53% | 5.33% | -7.97% |

When comparing the two projects side by side, Treasure at Tampines generally delivers higher ROIs across most unit types.
The gaps are most noticeable for the one- and five-bedders, where Treasure outperforms The Tapestry by over five percentage points. Two- and four-bedders also see Treasure holding a modest edge. The exception lies with the three-bedders, where The Tapestry has a slight lead; though at just 0.62 percentage points, the difference is marginal.
The gaps are most noticeable for the one- and five-bedders, where Treasure outperforms The Tapestry by over five percentage points.
Both projects have seen only one unprofitable transaction each so far: a five-bedder at Treasure, and a two-bedder at The Tapestry. Given there are just two cases though, these are outliers and aren’t representative of anything.

Is Treasure At Tampines still attractive versus the new launches in the area?
Treasure at Tampines’s strongest selling point, at the time of launch, was the lower price point. It also had other strong points like extensive facilities, but the price was by far the most noticeable.
But it’s one thing to do well at launch sales by pricing lower, and another to perform well in the secondary market. Is Treasure at Tampines still a good buy today, when pitted against newer alternatives? Let’s take a closer look:
Project | Tenure | Estimated completion | No. of units | Unit mix | Average $PSF for new sale transactions | Average quantum | % difference between average $PSF compared to Treasure at Tampines | % difference between average quantum compared to Treasure at Tampines |
PARC CENTRAL RESIDENCES (EC) | 99-years | 2024 (Has not obtained MOP) | 700 | 3, 4, 5 | $1,175 | $1,282,042 | -31.39% | -14.77% |
TENET (EC) | 99-years | 2026 | 618 | 3, 4, 5 | $1,383 | $1,499,827 | -19.27% | -0.29% |
TREASURE AT TAMPINES* | 99-years | 2023 | 2203 | 1, 2, 3, 4, 5 | $1,713 | $1,504,146 | – | – |
AURELLE OF TAMPINES (EC) | 99-years | 2028 | 760 | 3, 4, 5 | $1,766 | $1,708,667 | 3.08% | 13.60% |
PARKTOWN RESIDENCE | 99-years | 2028 | 1193 | 1, 2, 3, 4, 5 | $2,370 | $1,962,926 | 38.37% | 30.50% |

Compared to new launches in the Tampines area, Treasure at Tampines now sits firmly in the mid-range on a $PSF basis. Its average resale $PSF of $1,713 is, unsurprisingly, higher than Executive Condominiums (ECs) like Parc Central Residences and Tenet.
Treasure is, however, priced lower than the new EC Aurelle of Tampines. As for Parktown Residence, it’s newer and an integrated development, so it goes without saying that it has a higher $PSF than Treasure.
It’s worth noting that Parc Central’s $PSF looks especially low because it’s still four years away from meeting its Minimum Occupancy Period (MOP). Once it enters the resale market, prices are likely to surge.
Now let’s see how the prices of their various unit types stack up
Project | Average $PSF | Average price | % difference between average $PSF compared to Treasure at Tampines | % difference between average quantum compared to Treasure at Tampines |
TREASURE AT TAMPINES | $1,704 | $798,309 | ||
PARKTOWN RESIDENCE | $2,386 | $1,190,149 | 40.01% | 49.08% |
For the one-bedders, the new sale transactions in Parktown Residence already cost more than the resale units at Treasure at Tampines; a substantial gap of 49 per cent.
2-bedroom units
Project | Average $PSF | Average price | % difference between average $PSF compared to Treasure at Tampines | % difference between average quantum compared to Treasure at Tampines |
TREASURE AT TAMPINES | $1,701 | $1,103,744 | ||
PARKTOWN RESIDENCE | $2,403 | $1,633,196 | 41.25% | 47.97% |
For the two-bedders, Parktown Residence also comes in at a steep premium compared to Treasure. The average $PSF is around 41 per cent higher, while the average quantum difference is nearly 48 per cent.
3-bedroom units
Project | Average $PSF | Average price | % difference between average $PSF compared to Treasure at Tampines | % difference between average quantum compared to Treasure at Tampines |
PARC CENTRAL RESIDENCES (EC) | $1,167 | $1,133,756 | -32.03% | -30.71% |
TENET (EC) | $1,371 | $1,312,447 | -20.15% | -19.79% |
AURELLE OF TAMPINES (EC) | $1,768 | $1,551,236 | 2.93% | -5.20% |
TREASURE AT TAMPINES | $1,717 | $1,636,277 | ||
PARKTOWN RESIDENCE | $2,325 | $2,409,026 | 35.39% | 47.23% |
For the three-bedders, the three EC projects are all expectedly cheaper than Treasure at Tampines, with Parc Central Residences showing the widest gap; it’s almost 31 per cent lower in average quantum. Aurelle of Tampines, being new, is priced slightly higher on a $PSF basis; but its average quantum still comes in about five per cent lower, thanks to larger unit sizes.
Parktown Residence, being fully private and integrated, is expectedly pricier. Its transactions are already priced about 35 per cent higher on a $PSF basis, with a 47 per cent difference in average quantum.
4-bedroom units
Project | Average $PSF | Average price | % difference between average $PSF compared to Treasure at Tampines | % difference between average quantum compared to Treasure at Tampines |
PARC CENTRAL RESIDENCES (EC) | $1,185 | $1,436,954 | -31.56% | -35.29% |
TENET (EC) | $1,394 | $1,652,612 | -19.48% | -25.57% |
AURELLE OF TAMPINES (EC) | $1,762 | $1,972,308 | 1.76% | -11.18% |
TREASURE AT TAMPINES | $1,732 | $2,220,488 | ||
PARKTOWN RESIDENCE | $2,297 | $3,184,339 | 32.62% | 43.41% |
Again, all three ECs are still cheaper than Treasure at Tampines, with Parc Central Residences showing the largest gap in average quantum (35 per cent.) Aurelle of Tampines does edge slightly higher on a $PSF basis, but overall prices are still about 11 per cent lower.
Parktown Residence’s four-bedders are transacting at about 32 per cent higher on a $PSF basis, and about 43 per cent higher in overall price.
5-bedroom units
Project | Average $PSF | Average price | % difference between average $PSF compared to Treasure at Tampines | % difference between average quantum compared to Treasure at Tampines |
PARC CENTRAL RESIDENCES (EC) | $1,186 | $1,733,797 | -27.92% | -38.51% |
TENET (EC) | $1,417 | $2,239,639 | -13.90% | -20.57% |
AURELLE OF TAMPINES (EC) | $1,758 | $2,384,333 | 6.82% | -15.44% |
TREASURE AT TAMPINES | $1,646 | $2,819,648 | ||
PARKTOWN RESIDENCE | $2,343 | $3,934,700 | 42.37% | 39.55% |
The trend mirrors what we saw with the smaller units. All three ECs are priced lower than Treasure at Tampines, with Parc Central Residences showing the widest gap again. At the other end, Parktown Residence is significantly more expensive. Its average $PSF is about 42 per cent higher, while the quantum gap is close to 40 per cent.
Looking at the past performance of ECs launched between 2014 and 2016, their average $PSF rose by about 54 per cent once they hit MOP. If this pattern holds, the newer ECs in Tampines could well surpass Treasure at Tampines in pricing, once they enter the resale market.
If this pattern holds, the newer ECs in Tampines could well surpass Treasure at Tampines in pricing, once they enter the resale market.
That said, Parc Central Residences will only hit MOP in 2029; so for the next few years, Treasure at Tampines gets to remain the newest project in the area.
The next to enter the resale market will be Parktown Residence – but given its much higher pricing across all unit types, it is unlikely to be a direct competitor to Treasure.
The location of Parktown Residence, near Tampines North, is also in a very new township (it’s near IKEA Tampines). Buyers considering the area around Treasure will likely find Parktown’s location to be too different.
Exit strategy: Resale issues to consider
When it comes to Treasure at Tampines, the eventual resale performance will depend heavily on the depth of upgrader demand and the timing of incoming supply. Some key factors to note:
- HDB MOP effect in the east
Over the next few years, a wave of HDB flats in Tampines and Pasir Ris will hit their five-year MOP and enter the resale market. This influx can create more affordable alternatives for buyers who are less price-sensitive about condo facilities, potentially putting pressure on private resale demand. - Future supply pipeline
Beyond HDB, there’s also the matter of upcoming supply from ECs (Parc Central, Tenet, Aurelle of Tampines) and Parktown Residence. These will give buyers more options in the same catchment, and could affect how much pricing power Treasure at Tampines retains when owners look to sell. - The EC risk factor
Historically, ECs hitting their MOP can suppress prices of nearby condos, as buyers compare “brand-new” ECs to older private projects. We cover that in more detail in this article.
That said, Treasure at Tampines sits in the OCR. Being in the heartland positions it within reach of a larger upgrader pool, compared to other regions.
Let’s take a closer look at the actual buyer pool by examining the property types that recent buyers of D18 condos previously owned.
Year | HDB | Unknown | Private | % HDB Upgraders | % of existing private property owners |
2020 | 943 | 165 | 699 | 52% | 39% |
2021 | 1654 | 407 | 1273 | 50% | 38% |
2022 | 894 | 69 | 727 | 53% | 43% |
2023 | 589 | 29 | 632 | 47% | 51% |
2024 | 585 | 3 | 709 | 45% | 55% |
We see that in recent years, the percentage of private property owners buying into D18 has risen, while the share of HDB upgraders has declined.
It’s possible that HDB upgraders here are being priced out of the market, as overall condo prices move further beyond their comfort zone.
To test this, let’s look at the actual price ranges that HDB upgraders in D18 have been buying into over the past few years.
This will give us a clearer sense of whether Treasure at Tampines – particularly its two- and three-bedroom units – are still within reach of upgrader budgets, or if demand is shifting elsewhere.
Price range | No. of transactions (done between 2024 to June 2025) |
Under $1M | 155 |
Between $1M – $1.5M | 467 |
Between $1.5M – $2M | 495 |
Between $2M – $2.5M | 124 |
Between $2.5M – $3M | 28 |
Above $3M | 7 |

The majority of HDB upgraders in D18 are buying into the $1.5 million – $2 million range
The majority of HDB upgraders in D18 are buying into the $1.5 million – $2 million range (495 transactions), with the $1 million to $1.5 million range close behind (467 transactions).
In practice, these price bands translate mostly into three-bedder units, whether in resale or (cheaper) new launch projects. Importantly, the average price of Treasure at Tampines’ three-bedders falls squarely within this $1.5 million to $2 million sweet spot, aligning it with the most active upgrader segment.
What This Implies for Treasure at Tampines’ Exit Strategy
The three-bedder price range aligns well with most upgraders’ budgets. But the supply side of the equation matters just as much, and this is where the unit mix comes in.
Across Singapore, the bulk of OCR condo stock leans heavily toward family-sized units:
Bedrooms | CCR | RCR | OCR |
1-bedroom | 18% | 17% | 9% |
2-bedroom | 28% | 30% | 24% |
3-bedroom | 36% | 43% | 52% |
4-bedroom | 17% | 9% | 13% |
5-bedroom | 1% | 1% | 2% |
Across all regions, three-bedders form the largest share of units. However, the proportion is highest in the OCR, where more than half (52 per cent) of stock falls into this category. This reinforces the OCR’s role as the upgrader heartland, where family-sized homes dominate demand.
By contrast, the OCR has the lowest proportion of one- and two-bedroom units (just nine per cent and 24 per cent respectively), compared to the RCR and CCR, where smaller units are more common.
This suggests that, while compact units do exist in OCR projects like Treasure at Tampines, the buyer pool here is still skewed toward families prioritising space over rental yields.
No. of bedrooms | 1BR | 2BR | 3BR | 4BR | 5BR |
Unit supply in D18** | 2896 | 6862 | 12614 | 3802 | 557 |
Unit supply in the area (includes only resale projects that we were looking at at the beginning of the article)* | 1815 | 3720 | 6223 | 1675 | 226 |
Percentage | 63% | 54% | 49% | 44% | 41% |
*As some of the projects in our earlier comparison are not located within District 18, they have not been included here.
**This supply figure includes upcoming new launches as well.
In D18, three-bedders form the largest share of supply, mirroring the overall pattern in the wider OCR. It’s consistent with family-driven demand, where buyers will typically require at least a three-bedder.
Treasure is so huge that its supply of two-, three-, four-, and even five-bedders makes up close to – or in some cases, nearly half – of the entire district’s stock!
This is a definite downside for sellers, as the majority of their competition is in the very same development. Differentiation based on facilities and location will be small, so it will come down to less visible qualities like renovations or subtle perks like being closer to amenities or slightly better views.
For one-bedders, however, the concentration is far more pronounced: more than 60 per cent of all such units in District 18 are clustered in the vicinity of Treasure. This aggravates the resale competition issue, while larger units are relatively better balanced against the broader market.
Here’s a closer look at Treasure’s unit mix:
Unit types | No. of units |
1-bedroom | 231 |
2-bedroom | 738 |
3-bedroom | 761 |
4-bedroom | 363 |
5-bedroom | 110 |
Treasure at Tampines is made up primarily of three-bedders, with two-bedders coming in a close second. Its unit distribution is broadly in line with both the district and the wider OCR, which are heavily geared toward family-sized homes.
Now that we’ve seen how supply is distributed, the next step is to assess the profitability of each unit type.
This helps us better understand demand patterns in D18 and where Treasure at Tampines may have stronger or weaker resale potential. We’re only going to be looking at resale transactions for this, as including new sales would distort the results through developer discounts.
Year | 1-bedroom | 2-bedroom | 3-bedroom | 4-bedroom | 5-bedroom |
2014 | $1,315 | $955 | $838 | $881 | $600 |
2015 | $1,147 | $924 | $803 | $817 | $685 |
2016 | $1,046 | $880 | $792 | $815 | $791 |
2017 | $1,126 | $926 | $781 | $841 | $753 |
2018 | $1,184 | $983 | $867 | $878 | $902 |
2019 | $1,190 | $973 | $875 | $951 | $924 |
2020 | $1,181 | $966 | $893 | $926 | $977 |
2021 | $1,215 | $1,008 | $955 | $999 | $977 |
2022 | $1,356 | $1,145 | $1,082 | $1,152 | $1,074 |
2023 | $1,457 | $1,258 | $1,191 | $1,230 | $1,243 |
2024 | $1,551 | $1,423 | $1,351 | $1,392 | $1,441 |
Annualised | 1.67% | 4.07% | 4.89% | 4.68% | 9.16% |
Over the past decade, five-bedroom units have seen the strongest price growth, with an annualised increase of 9.16 per cent. This is significantly higher than the three- and four-bedders, which recorded growth of around 4.7 to 4.9 per cent annually.
In contrast, one- and two-bedders lagged behind with growth rates below 4.1 per cent. This is in line with what we said above: in an area where most buyers are HDB upgraders, there’s just less demand for compact one and two-bedders (e.g., few people are going to sell their 4-room flat to move into a two-bedder)
Let’s also take a look at the profitability of the various unit types in the district
We will look at transactions from 2024 to June 2025:
Gains | Losses | |||||||||
Unit types | Average sale price | Average gains | Average ROI | No. of transactions | Holding period (years) | Average sale price | Average gains | Average ROI | No. of transactions | Holding period (years) |
1-bedroom | $775,416 | $134,616 | 21.85% | 156 | 5.9 | |||||
2-bedroom | $1,122,132 | $231,888 | 27.00% | 358 | 5.1 | |||||
3-bedroom | $1,557,550 | $402,092 | 36.08% | 441 | 5.1 | |||||
4-bedroom | $2,082,916 | $545,952 | 37.16% | 161 | 5.1 | |||||
5-bedroom | $2,732,267 | $734,882 | 38.72% | 19 | 5.1 | $2,420,000 | -$230,900 | -8.82% | 2 | 3.8 |
When we look at transactions across D18 from 2024 to mid-2025, the trend mirrors what we saw at Treasure at Tampines and The Tapestry: the average ROI tends to increase with unit size.
One-bedroom units saw an average ROI of 21.85 per cent, while two-bedders came in at 27 per cent. The three- and four-bedders performed even better, with ROIs of 36 and 37 per cent respectively.
Five-bedders achieved the highest returns at 38.72 per cent (although there were also two unprofitable transactions in this category; these are outliers).
Overall, it’s in line with expectations; this pattern aligns with the historical growth rates of different unit types across the OCR.
We saw earlier that the proportion of HDB upgraders has dipped in recent years, so let’s look at the supply of flats in Tampines reaching MOP in 2025 and 2026
Project | MOP | Number of units |
Tampines GreenBloom | 2025/2026 | 319 |
Tampines GreenFlora | 2025 | 319 |
Tampines GreenVerge | 2026 | 2,022 |
By 2026, there will be 2,660 units that could add to the pool of HDB upgraders. But let’s consider what they could afford.
These are some of the 4-room resale transactions in Q2 2025 for Tampines Greenview, the youngest cluster in Tampines that just reached its MOP this year. Prices have ranged between $748,000 and $815,000, with an average of about $777,000.
Date | Block | Street Name | Storey | Floor Area (sqm) /Flat Model | ResalePrice |
Jul 2025 | 614A | Tampines Nth Dr 1 | 10 to 12 | 93.00Model A | $765,000 |
Jul 2025 | 614A | Tampines Nth Dr 1 | 04 to 06 | 93.00Model A | $763,000 |
Jun 2025 | 614A | Tampines Nth Dr 1 | 07 to 09 | 93.00Model A | $785,000 |
May 2025 | 614B | Tampines Nth Dr 1 | 13 to 15 | 93.00Model A | $815,000 |
May 2025 | 614A | Tampines Nth Dr 1 | 13 to 15 | 93.00Model A | $800,000 |
May 2025 | 614A | Tampines Nth Dr 1 | 07 to 09 | 93.00Model A | $770,000 |
May 2025 | 614A | Tampines Nth Dr 1 | 04 to 06 | 93.00Model A | $748,000 |
Apr 2025 | 614B | Tampines Nth Dr 1 | 07 to 09 | 93.00Model A | $765,000 |
Apr 2025 | 614A | Tampines Nth Dr 1 | 10 to 12 | 93.00Model A | $803,000 |
Apr 2025 | 614A | Tampines Nth Dr 1 | 10 to 12 | 93.00Model A | $780,000 |
Apr 2025 | 614A | Tampines Nth Dr 1 | 07 to 09 | 93.00Model A | $776,000 |
Apr 2025 | 614A | Tampines Nth Dr 1 | 10 to 12 | 93.00Model A | $750,000 |
If we assume a household bought their flat at the BTO launch (average price of $328,500), with a maximum HDB loan (90 per cent* LTV, 25-year tenure at 2.6 per cent interest), and financed repayments via CPF, the outcome looks like this after five years:
*The maximum allowable LTV at the time these flats were launched was 90 per cent; it has since been reduced to 75 per cent as of 2025
- Purchase price: $328,500
- 90% loan: $295,650
- 10% CPF: $32,850
- Sale price: $777,000
- Outstanding loan (5th year): $259,468
- CPF refund: $122,893
- Cash proceeds: $394,639
Together with their CPF refund, this household would walk away with about $517,532.
Now, let’s say this couple wants to upgrade to a 3-bedroom condo in Tampines, where the average resale price is $1,557,550 (based on transactions from 2024 to mid-2025).
Assuming a combined monthly income of $12,000 (slightly above the 2024 median of $11,297), they can take a 30-year loan at 4% interest:
- Purchase price: $1,557,550
- 75% loan: $1,168,163
- 25% CPF + cash: $389,388
- BSD: $47,477
- Total upfront required: $436,865
With $517,532 from the HDB sale, they’d be left with about $80,668 after the condo purchase. While CPF balances would likely have grown further over five years, this simple illustration shows that the couple would have limited buffers left. Factoring in legal fees, agent fees, and renovation costs, the move becomes risky.
If instead they aimed for a new EC, say a three-bedder at Aurelle of Tampines (average price $1,551,236), the picture worsens under MSR limits:
- Purchase price: $1,551,236
- Maximum loan: $754,060
Shortfall (CPF + cash): $797,176 - BSD: $47,161
- Total upfront required: $844,337
Here, the required outlay far exceeds their available funds. Unless their income is significantly higher, buying a new EC would be out of reach.
In both cases, upgrading from a newly-MOP HDB to a private property proves challenging for a household earning only slightly above the median income.
This shows why ECs – especially those with bigger price gaps versus condos – can shape the resale competition for projects like Treasure at Tampines. Among the new ECs, Parc Central Residences has the widest gap today; if its prices remain lower or comparable to Treasure’s, it could emerge as a serious competitor.
Floor Plan Analysis versus Parc Central Residences
To keep things relevant, we’ll compare the units that are closest in size, paired with recent transactions.
Three-bedroom units

Treasure at Tampines – 915 sq ft, #12 sold in July 2025 at $1.68 million
Parc Central Residences – 926 sq ft
The two units are almost identical in size, but their layouts diverge in some key ways. At Treasure at Tampines, the kitchen is open, while Parc Central Residences offers an enclosed kitchen, complete with a yard and a home shelter – features that Treasure lacks. The balcony at Parc Central Residences is smaller, spanning just the width of the living room, but it remains functional without taking up excessive space.
On balance, the Parc Central layout is the more practical of the two, thanks to its yard and home shelter, which add utility that families often prioritise.
Four-bedroom units

Treasure at Tampines – 1,238 sq ft, #06 sold in July 2025 at $2.26 million
Parc Central Residences – 1,227 sq ft
Treasure at Tampines has a more regular configuration, while Parc Central Residences separates its entertainment spaces (living, dining, and kitchen) more clearly from the bedrooms.
Both units include a yard, but the positioning varies: at Treasure, it’s part of the kitchen and comes with an attached utility room; at Parc Central, the yard is enclosed beside the dining area and paired with a home shelter and WC. Both also have generous balconies: Treasure’s stretches across the living room and one bedroom, while Parc Central’s runs across both the living area and kitchen, which is a rare layout feature.
Bedroom sizing is another differentiator: all four rooms in Parc Central can accommodate double beds, while one of Treasure’s is smaller and better suited for a single.
Overall, Parc Central Residences offers a more functional layout, with features like the home shelter, WC, and more practical bedroom sizing giving it the edge.
Five-bedroom units

Treasure at Tampines – 1,690 sq ft, #06 sold in March 2025 at $2.78 million
Parc Central Residences – 1,668 sq ft
At Treasure at Tampines, only one bedroom is ensuite, while Parc Central Residences offers two. Both kitchens are enclosed and come with a yard, WC, and utility/home shelter, though Parc Central also has a dry kitchen. Treasure lacks one, but there is sufficient space in the dining area to create a small dry kitchen if preferred.
The balcony at Treasure is unusually long, stretching across the living room and almost three bedrooms. In Parc Central, the balcony spans the living and dining areas instead; more compact but arguably less wasteful. As for bedroom sizing, all five at Treasure can accommodate double beds, while one of the rooms at Parc Central is better suited for a single bed.
Between the two, Parc Central’s additional ensuite bedroom and more efficiently sized balcony may give it an edge for buyers. Looking across the unit types, Parc Central Residences appears to offer more efficient layouts overall. If its resale prices come in lower than, or even close to, Treasure at Tampines, it could emerge as a strong competitor.
Conclusion:
Treasure at Tampines has outpaced condominiums in both D18 and the broader market. It has the highest average $PSF among nearby projects, but in an era of post-GFA harmonisation, affordability, and efficiency, this barely means much. The main issue is that Treasure’s overall prices are not the highest across all unit types. For its one- to four-bedders, smaller unit sizes have kept entry prices competitive; and to date, the project has seen only a single unprofitable transaction.
We can see that, when benchmarked against its closest rival, The Tapestry, Treasure has delivered stronger gains in four out of five unit types. This is likely because The Tapestry’s average purchase prices were higher across the board, leaving less room for upside.
Against newer launches, Treasure’s average prices sit above the ECs (Parc Central Residences, Tenet, and Aurelle of Tampines), but below Parktown Residence, the integrated development. This places it in a middle ground that may appeal to upgraders, being a private condo without stretching into “integrated” pricing.
That upgrader pool, however, is showing signs of strain.
In recent years, the proportion of HDB upgraders buying into D18 has dipped, while existing private owners now form a larger share of buyers. Among those who do upgrade, most are purchasing in the $1.5 million to $2 million range – mainly three- and four-bedders.
Yet, even with a newly-MOP flat, our calculations show that moving into a condo at this price band is challenging for median-income households. Upgrading to a new EC is harder still, due to tighter MSR loan restrictions.
Looking ahead, Parc Central Residences will be the first of the new ECs to reach MOP in about four years. With a wider price gap against Treasure at Tampines and more efficient, family-friendly layouts, it could become a serious competitor if its resale prices remain lower or even close to Treasure’s.
For now, Treasure at Tampines remains one of the more accessible private options in the east, facing two main challenges: the first, as mentioned, is competition from Parc Central when it hits the resale market. The second is the upcoming new EC along Tampines Street 95, which is being developed by Sim Lian Group. But given the high land price paid by the developer ($768 psf, high for an EC), this might have a price point of around $1,700 to $1,800 psf.
This puts Treasure in a good spot with further room for growth, as its pricing continues to look attractive compared to this new launch, and to many surrounding condos (of which there are not many in Tampines West).
While many buyers focus on the sheer number of units at Treasure at Tampines and assume competition will weigh on future prices, we hope we’ve shown why the dynamics here are different. It’s not about the unit count; it’s about relative affordability, Tampines’ limited private stock, and the upcoming pricing of new EC launches.
Stay open to spotting value in projects where the fundamentals are stronger than the headlines suggest.
Curious how these principles apply to your own upgrading plans or investment goals in the East? Let’s chat.
For more in-depth analysis of condo prices, for both new and resale projects, follow us on Stacked Pro.
Ryan J
A seasoned content strategist with over 17 years in the real estate and financial journalism sectors, Ryan has built a reputation for transforming complex industry jargon into accessible knowledge. With a track record of writing and editing for leading financial platforms and publications, Ryan's expertise has been recognised across various media outlets. His role as a former content editor for 99.co and a co-host for CNA 938's Open House programme underscores his commitment to providing valuable insights into the property market.Read next from Property Investment Insights

Property Investment Insights Which Resale Two-Bedroom Condos Quietly Made Buyers Six-Figure Profits In Singapore?

Property Investment Insights Low Floor vs. High Floor: What Transaction Data Reveals About the Premium

Property Investment Insights Why I Bought A $1.47M 2-Bedroom Stirling Residences Condo Unit: A Buyer’s Case Study

Property Investment Insights Can a One-Bedder Outperform a Two-Bedder? We Analysed 5 Years of Data
Latest Posts

Property Market Commentary Why Developers Are Now Building for Families in Singapore’s Most Expensive Districts

Landed Home Tours We Toured A Freehold Landed Estate Next To Mount Faber – With Semi-Detached Units From $5.2million

Singapore Property News Why More Singaporeans May Soon Trade Condos For Resale HDBs

Overseas Property Investing Singaporeans Are Buying More Overseas Homes — But Few Have Prepared For These Things

Singapore Property News This 5-Room HDB in Clementi Just Sold For $1.458M: Here’s What The Seller Could Have Made

On The Market We Found The Cheapest And Biggest 5-room Flats Over 1,400 Sq ft You Can Buy Right Now

Singapore Property News 14,000 Homes In Kranji And A Transformed Woodlands — Will The North Become Singapore’s Next Hotspot?

Property Advice The Math Behind Why 30–35 Is The Sweet Spot To Upgrade From HDB To Condo

Editor's Pick We Toured A Freehold Landed Estate In Singapore With Vintage Properties and Top Thai Restaurants

Editor's Pick NDP Rally 2025: The 4 Key Housing Takeaways for Singaporeans

Singapore Property News Springleaf Residence Sells 870 of 941 Units (92%) At Launch — What’s Driving Demand?

Singapore Property News Could Your East-Side Condo Be Worth More Now? Singapore Just Raised Height Limits Near Changi

Singapore Property News From SERS to VERS: What Every HDB Owner Needs to Know About the Big Shift

On The Market 5 Cheapest 3-Bedroom Condos To Buy Right Now In 2025 (From $980K)

Homeowner Stories I’m a Former Police Officer Who Now Co-Owns 40 Property Investments Without Managing a Single Tenant: Here’s How
