They Paid A Premium For The Sea View (And Made $200K More): Inside Clement Canopy’s Resale Data


A seasoned content strategist with over 17 years in the real estate and financial journalism sectors, Ryan has built a reputation for transforming complex industry jargon into accessible knowledge. With a track record of writing and editing for leading financial platforms and publications, Ryan's expertise has been recognised across various media outlets. His role as a former content editor for 99.co and a co-host for CNA 938's Open House programme underscores his commitment to providing valuable insights into the property market.
In this Stacked Pro breakdown:
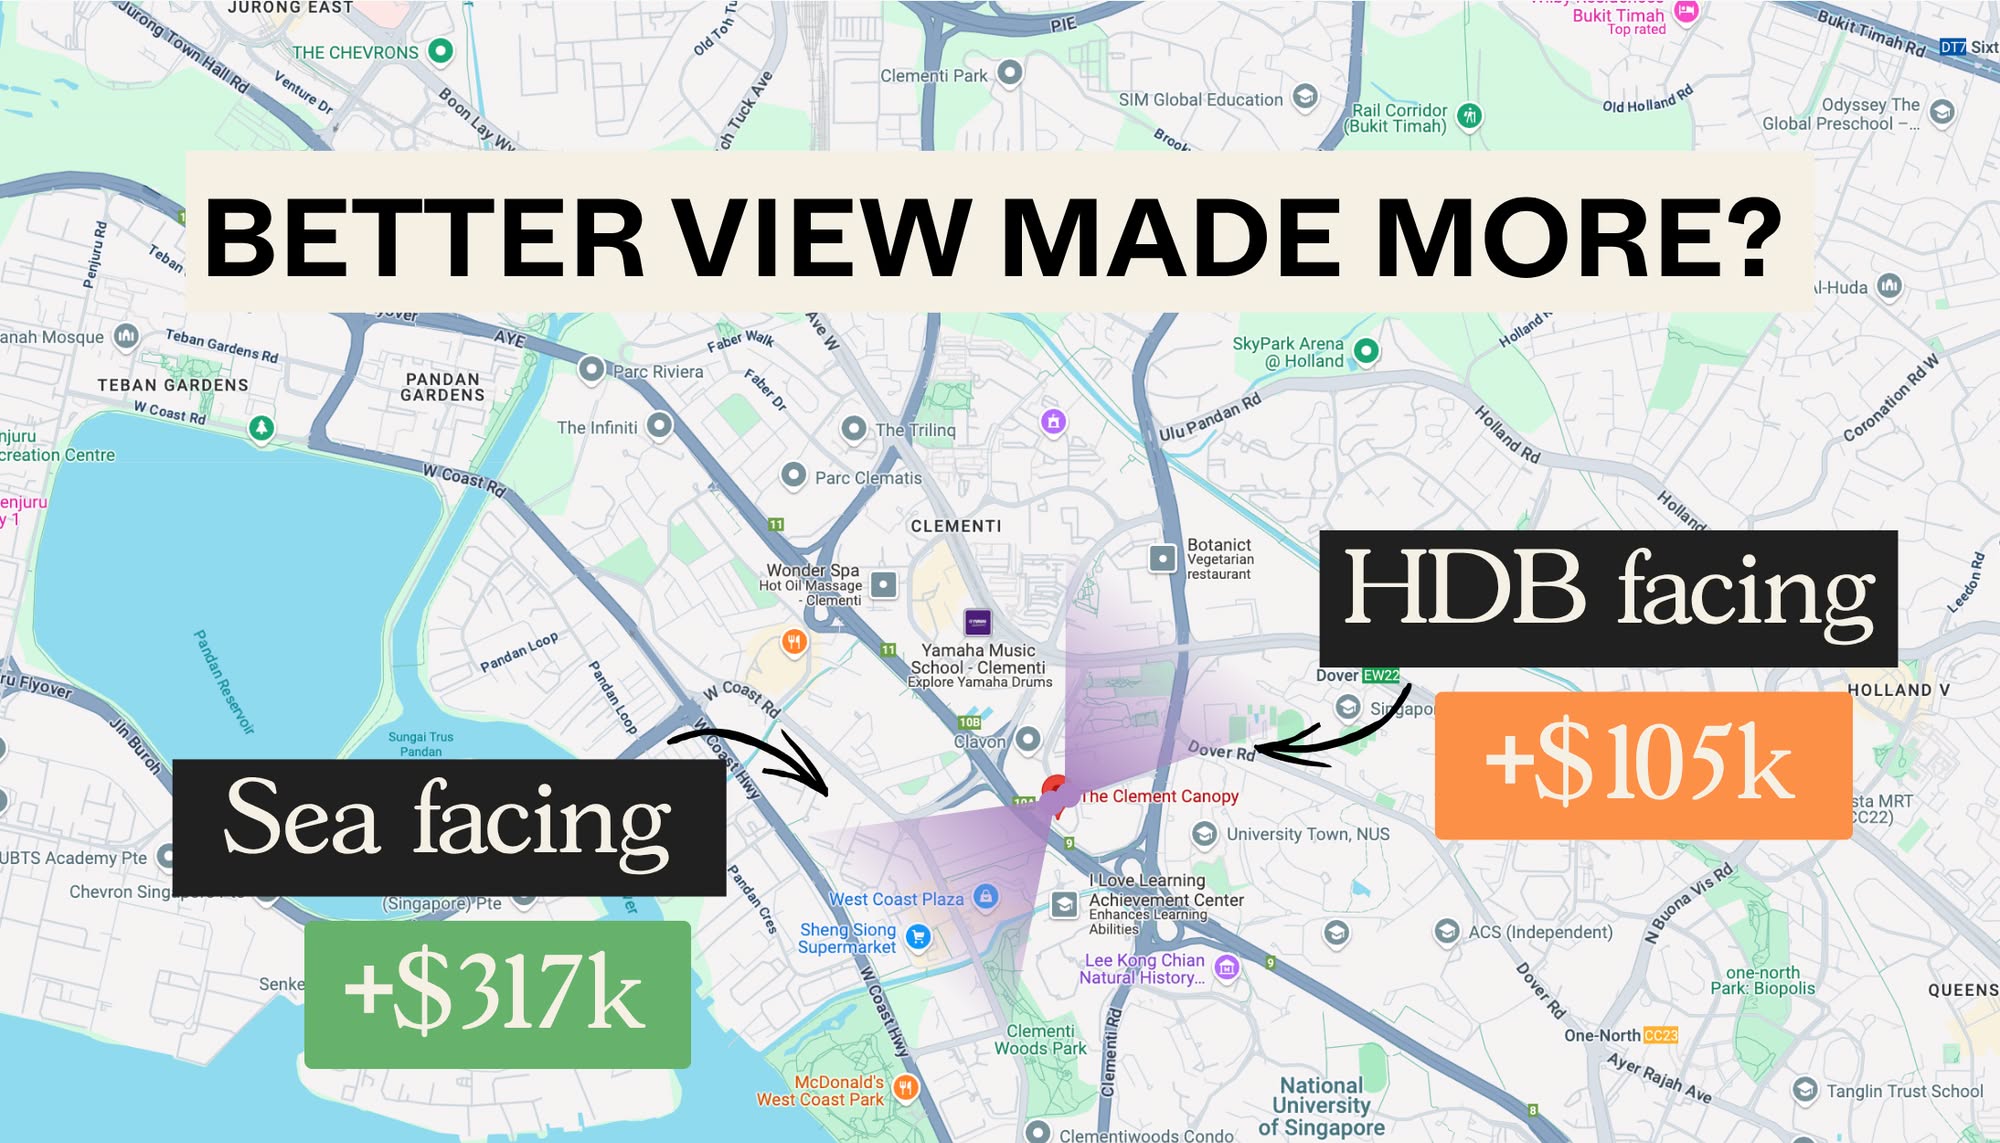
- We analysed resale outcomes across all 2- to 4-bedroom stacks at The Clement Canopy to see how different facings—sea view vs. Clementi Forest—impacted gains
- Some owners who entered early saw standout gains, while others paid premiums for similar units and earned comparatively smaller profits
- From floor level premiums to layout efficiency and launch timing, we break down the real factors that shaped buyer profits
Already a subscriber? Log in here.
This is part of our ongoing series of case studies, where we look at how different views can affect resale gains and pricing. If you own a unit at The Clement Canopy or are considering buying there, the following may interest you: we’re going to examine how different blocks/stacks facing Clementi Forest versus West Coast Park have impacted gains. Here’s what we found:
A rundown on The Clement Canopy
The Clement Canopy is a leasehold, 505-unit condo in Clementi (District 5). It was completed in 2019. It consists of 40-storey blocks, where units are all outward facing: the high floor units either overlook the AYE toward West Coast Park (a sea view), or overlook Nan Hua High and the surrounding HDB cluster (a greenery view of Clementi Forest).

To see which views resulted in better gains, we’ll examine price movements based on the different unit sizes, and their relevant views. We’ll begin with two-bedder units in block 18 (Stacks 9 and 12).
Stack 9 overlooks Nan Hua High School and the nearby HDB enclave, providing a view of Clementi Forest. Stack 12 faces West Coast Park, overlooking the AYE and providing a sea view.

Date | Size (sqft) | $PSF | Price | Address | $PSF difference |
25 Feb 2017 | 657 | $1,333 | $875,000 | 18 Clementi Avenue 1 #03-09 (Stack 9) | 3.38% |
25 Feb 2017 | 710 | $1,378 | $979,000 | 18 Clementi Avenue 1 #03-12(Stack 12) | |
25 Feb 2017 | 657 | $1,336 | $877,000 | 18 Clementi Avenue 1 #04-09(Stack 9) | 1.80% |
12 Mar 2017 | 710 | $1,360 | $966,000 | 18 Clementi Avenue 1 #04-12(Stack 12) | |
25 Feb 2017 | 657 | $1,371 | $900,000 | 18 Clementi Avenue 1 #13-09 (Stack 9) | 1.31% |
3 Apr 2017 | 710 | $1,389 | $987,000 | 18 Clementi Avenue 1 #13-12 (Stack 12) | |
25 Feb 2017 | 657 | $1,375 | $903,000 | 18 Clementi Avenue 1 #14-09 (Stack 9) | 2.04% |
22 Apr 2017 | 710 | $1,403 | $997,000 | 18 Clementi Avenue 1 #14-12 (Stack 12) | |
25 Feb 2017 | 657 | $1,416 | $930,000 | 18 Clementi Avenue 1 #23-09 (Stack 9) | 5.30% |
13 Aug 2017 | 710 | $1,491 | $1,059,000 | 18 Clementi Avenue 1 #23-12 (Stack 12) | |
11 Mar 2017 | 657 | $1,430 | $939,000 | 18 Clementi Avenue 1 #24-09 (Stack 9) | 6.50% |
10 Sep 2017 | 710 | $1,523 | $1,082,000 | 18 Clementi Avenue 1 #24-12 (Stack 12) | |
25 Aug 2017 | 657 | $1,541 | $1,012,000 | 18 Clementi Avenue 1 #33-09 (Stack 9) | -3.89% |
23 Mar 2017 | 710 | $1,481 | $1,052,000 | 18 Clementi Avenue 1 #33-12 (Stack 12) | |
24 Feb 2018 | 657 | $1,703 | $1,118,000 | 18 Clementi Avenue 1 #34-09 (Stack 9) | -6.99% |
18 Sep 2017 | 710 | $1,584 | $1,125,000 | 18 Clementi Avenue 1 #34-12 (Stack 12) |
There’s never a perfect comparison, so we need to acknowledge one of the differences here. The size for Stack 9 two-bedders is 657 sq. ft., whilst Stack 12 two-bedders are a bit larger at 710 sq. ft. The size difference is because Stack 12 two-bedders have two bathrooms, whilst Stack 9 two-bedders have a single bathroom.
Stack 12 units also use a dumbbell layout, where the bedrooms are typically separated from each other by common areas (e.g., living room and kitchen). This tends to be seen as more efficient, and could explain higher prices compared to a more conventional layout such as in Stack 9.
Nonetheless, during early launch phases, the difference in price between the two stacks was not very big. Perhaps it’s because the developer thought that, while Stack 12 gets a sea view, it also overlooks the AYE, which is noisier than Stack 9.
But we can see that the price gap between 12 and 9 widened as the launch progressed. This was especially true for units on the same level, where one sold later than another.
Notably for Stack 12, we see a strong climb from March to August 2017.
In March 2017, the price for #04-12 was $1,360 psf. By April 2017, the price for #14-12 was $1,403 psf. By August of the same year, #23-12 reached $1,491 psf. These price hikes are more noticeable compared to Stack 9, where the price progression is more gradual.
So even though the prices started close, the developer likely saw that demand was leaning toward Stack 12 and rose prices. This was perhaps due to the combination of a sea view and a second bathroom.
Now let’s compare the gains between the units, once they entered the resale market

Sold On | Address | Area (sqft) | Profit (S$) | Bought On | Days | Annualised (%) |
3 Jan 2023 | 18 Clementi Avenue 1 #34-09 (Stack 9) | 657 | 102,000 | 24 Feb 2018 | 1,774 | 1.8 |
9 Jan 2023 | 18 Clementi Avenue 1 #36-09 (Stack 9) | 657 | 105,000 | 20 Jan 2018 | 1,815 | 1.8 |
28 Dec 2021 | 18 Clementi Avenue 1 #26-09 (Stack 9) | 657 | 111,000 | 5 Mar 2017 | 1,759 | 2.3 |
19 Sep 2024 | 18 Clementi Avenue 1 #09-09 (Stack 9) | 657 | 125,001 | 18 May 2021 | 1,220 | 3.2 |
3 May 2021 | 18 Clementi Avenue 1 #22-12 (Stack 12) | 710 | 176,000 | 25 Feb 2017 | 1,528 | 3.9 |
20 Aug 2021 | 18 Clementi Avenue 1 #06-12 (Stack 12) | 710 | 179,000 | 25 Feb 2017 | 1,637 | 3.8 |
18 Mar 2022 | 18 Clementi Avenue 1 #03-12 (Stack 12) | 710 | 196,000 | 25 Feb 2017 | 1,847 | 3.7 |
11 Aug 2022 | 18 Clementi Avenue 1 #33-09 (Stack 9) | 657 | 198,000 | 25 Aug 2017 | 1,812 | 3.7 |
28 Dec 2021 | 18 Clementi Avenue 1 #33-12 (Stack 12) | 710 | 216,800 | 23 Mar 2017 | 1,741 | 4 |
18 May 2021 | 18 Clementi Avenue 1 #09-09 (Stack 9) | 657 | 239,999 | 24 Feb 2017 | 1,544 | 5.8 |
20 Aug 2024 | 18 Clementi Avenue 1 #24-12 (Stack 12) | 710 | 268,000 | 10 Sep 2017 | 2,536 | 3.2 |
17 Jun 2021 | 18 Clementi Avenue 1 #07-09 (Stack 9) | 657 | 270,000 | 24 Feb 2017 | 1,574 | 6.4 |
7 Jan 2022 | 18 Clementi Avenue 1 #13-09 (Stack 9) | 657 | 270,000 | 25 Feb 2017 | 1,777 | 5.5 |
9 May 2023 | 18 Clementi Avenue 1 #37-12 (Stack 12) | 710 | 317,000 | 6 Jul 2017 | 2,133 | 4.4 |
14 May 2024 | 18 Clementi Avenue 1 #13-12 (Stack 12) | 710 | 333,000 | 3 Apr 2017 | 2,598 | 4.2 |
22 Mar 2024 | 18 Clementi Avenue 1 #11-12 (Stack 12) | 710 | 398,000 | 25 Feb 2017 | 2,582 | 4.9 |
More from Stacked
How A Clement Canopy Condo Buyer Made $700K More Than Their Neighbours: A Data Breakdown On Timing
In this Stacked Pro breakdown:
In terms of absolute profit, Stack 12 won out. We can see that #11-12 made a profit of $398,000, and #13-12 made $333,000. This is a higher quantum of profit compared to most units in Stack 9.
(Although #07-09 and #13-09 are not far behind with gains of $270,000 to $270,000, which are still quite significant.)
In terms of annualised returns though, Stack 9 came out ahead, particularly in the earlier purchases. Units bought in 2017 show annualised returns of 5.5 to 6.4 per cent, with a few as high as 3.7 to 3.2 per cent in later years.
Let’s take at look at similar units, in another block:
Two-bedder units in blocks 16 and 18 (stacks 3 and 13)
Stack 3 has the view of Clementi Forest, and Stack 13 has the sea view.

Date | Size (sqft) | $PSF | Price | Address | $PSF difference |
28 Aug 2017 | 732 | 1,419 | 1,039,000 | 16 Clementi Avenue 1 #03-03 (Stack 3) | -4.88% |
24 Feb 2017 | 732 | 1,353 | 990,000 | 18 Clementi Avenue 1 #03-13(Stack 13) | |
8 Aug 2017 | 732 | 1,395 | 1,021,000 | 16 Clementi Avenue 1 #04-03 (Stack 3) | -4.49% |
11 Mar 2017 | 732 | 1,335 | 977,000 | 18 Clementi Avenue 1 #04-13 (Stack 13) | |
27 Mar 2017 | 732 | 1,366 | 1,000,000 | 16 Clementi Avenue 1 #13-03(Stack 3) | -0.22% |
25 Feb 2017 | 732 | 1,363 | 998,000 | 18 Clementi Avenue 1 #13-13(Stack 13) | |
7 May 2017 | 732 | 1,400 | 1,025,000 | 16 Clementi Avenue 1 #14-03(Stack 3) | -2.49% |
31 Mar 2017 | 732 | 1,366 | 1,000,000 | 18 Clementi Avenue 1 #14-13(Stack 13) | |
3 Mar 2017 | 732 | 1,399 | 1,024,000 | 16 Clementi Avenue 1 #23-03(Stack 3) | 3.85% |
1 Jul 2017 | 732 | 1,455 | 1,065,000 | 18 Clementi Avenue 1 #23-13(Stack 13) | |
23 Apr 2017 | 732 | 1,419 | 1,039,000 | 16 Clementi Avenue 1 #24-03(Stack 3) | 7.50% |
8 Oct 2017 | 732 | 1,534 | 1,123,000 | 18 Clementi Avenue 1 #24-13(Stack 13) | |
22 Apr 2017 | 732 | 1,459 | 1,068,000 | 16 Clementi Avenue 1 #33-03(Stack 3) | -1.11% |
25 Feb 2017 | 732 | 1,443 | 1,056,000 | 18 Clementi Avenue 1 #33-13(Stack 13) | |
10 Sep 2017 | 732 | 1,536 | 1,124,000 | 16 Clementi Avenue 1 #34-03(Stack 3) | -2.20% |
2 Aug 2017 | 732 | 1,503 | 1,100,000 | 18 Clementi Avenue 1 #34-13(Stack 13) |
Again, the developer kept prices between both stacks quite similar at the start. But as the launch progressed, stack 3’s prices rose faster, with the gap between the stacks widening, especially towards August and October 2017.
Notice Stack 3’s positive movement in the later months of 2017, with prices as high as $1,536 psf by October 2017. For Stack 13, we even saw some drops in February and August 2017, such as the -4.88 and -4.49 per cent drops.
Now let’s compare gains between Stacks 3 and 13

Sold On | Address | Area (sqft) | Profit (S$) | Bought On | Days | Annualised (%) |
10 Aug 2021 | 18 Clementi Avenue 1 #34-13 | 732 | 150,000 | 2 Aug 2017 | 1,469 | 3.2 |
15 Nov 2021 | 18 Clementi Avenue 1 #27-13 | 732 | 152,000 | 16 Oct 2017 | 1,491 | 3.1 |
22 Dec 2021 | 16 Clementi Avenue 1 #31-03 | 732 | 167,000 | 11 Jun 2017 | 1,655 | 3.2 |
7 Sep 2021 | 16 Clementi Avenue 1 #35-03 | 732 | 172,000 | 4 Aug 2017 | 1,495 | 3.6 |
30 Jun 2022 | 18 Clementi Avenue 1 #24-13 | 732 | 172,000 | 8 Oct 2017 | 1,726 | 3.1 |
2 Mar 2022 | 16 Clementi Avenue 1 #33-03 | 732 | 232,000 | 22 Apr 2017 | 1,775 | 4.1 |
20 Apr 2022 | 16 Clementi Avenue 1 #22-03 | 732 | 243,000 | 25 Feb 2017 | 1,880 | 4.2 |
16 Jun 2022 | 16 Clementi Avenue 1 #25-03 | 732 | 257,000 | 18 Apr 2017 | 1,885 | 4.4 |
6 Dec 2023 | 18 Clementi Avenue 1 #35-13 | 732 | 272,000 | 24 Sep 2017 | 2,264 | 3.5 |
18 Aug 2022 | 18 Clementi Avenue 1 #17-13 | 732 | 276,000 | 5 Mar 2017 | 1,992 | 4.5 |
7 Apr 2022 | 18 Clementi Avenue 1 #11-13 | 732 | 287,000 | 26 Feb 2017 | 1,866 | 5.1 |
28 Oct 2024 | 16 Clementi Avenue 1 #06-03 | 732 | 310,000 | 20 May 2017 | 2,718 | 3.7 |
1 Apr 2024 | 16 Clementi Avenue 1 #15-03 | 732 | 386,000 | 25 Feb 2017 | 2,592 | 4.7 |
Both facings were quite evenly matched; but for stack 3, note that a lot of same level-units were sold at a later date than stack 13 counterparts.
Stack 3 does have a slightly higher annualised return in some instances, and saw the highest annualised return at 5.1 per cent for #11-13. Stack 13, in exchange, saw higher absolute profits with some units making more than $300,000, such as #15-03 and #06-03.
We’d say Stack 3 offered good returns over a shorter period, indicating better ROI for shorter-term investors. But beyond that, the two stacks are closely matched.
Now let’s look at three-bedder units
For this, we’ll look at block 18 (stacks 10 and 11). Stack 10 has the view of Clementi Forest, and Stack 11 has the sea view.

Date | Size (sqft) | $PSF | Price | Address | $PSF difference |
8 Oct 2017 | 1,109 | 1,387 | 1,538,000 | 18 Clementi Avenue 1 #03-10(Stack 10) | -6.27% |
17 May 2017 | 1,109 | 1,300 | 1,441,000 | 18 Clementi Avenue 1 #03-11(Stack 11) | |
27 Feb 2017 | 1,109 | 1,270 | 1,408,000 | 18 Clementi Avenue 1 #04-10(Stack 10) | 10.63% |
22 Nov 2017 | 1,109 | 1,405 | 1,558,000 | 18 Clementi Avenue 1 #04-11(Stack 11) | |
25 Feb 2017 | 1,109 | 1,294 | 1,435,000 | 18 Clementi Avenue 1 #13-10 (Stack 10) | 10.90% |
17 May 2018 | 1,109 | 1,435 | 1,591,000 | 18 Clementi Avenue 1 #13-11(Stack 11) | |
1 May 2017 | 1,109 | 1,309 | 1,451,000 | 18 Clementi Avenue 1 #14-10(Stack 10) | 9.78% |
25 Jun 2018 | 1,109 | 1,437 | 1,593,000 | 18 Clementi Avenue 1 #14-11(Stack 11) | |
15 Apr 2017 | 1,109 | 1,327 | 1,471,000 | 18 Clementi Avenue 1 #23-10(Stack 10) | 1.13% |
1 Jun 2017 | 1,109 | 1,342 | 1,488,000 | 18 Clementi Avenue 1 #23-11(Stack 11) | |
31 May 2017 | 1,109 | 1,370 | 1,519,000 | 18 Clementi Avenue 1 #24-10(Stack 10) | 7.08% |
28 Apr 2018 | 1,109 | 1,467 | 1,626,000 | 18 Clementi Avenue 1 #24-11(Stack 11) | |
6 May 2017 | 1,109 | 1,377 | 1,527,000 | 18 Clementi Avenue 1 #33-10(Stack 10) | 8.42% |
8 Apr 2018 | 1,109 | 1,493 | 1,655,000 | 18 Clementi Avenue 1 #33-11(Stack 11) | |
3 Nov 2017 | 1,109 | 1,500 | 1,663,000 | 18 Clementi Avenue 1 #34-10(Stack 10) | -0.20% |
19 Apr 2018 | 1,109 | 1,497 | 1,660,000 | 18 Clementi Avenue 1 #34-11(Stack 11) |
We ran into a bit of a comparison problem here:
Many of the Stack 11 units were purchased later than Stack 10 (around mid-2017 to 2018), reflecting a later stage in the project’s launch. This would be when prices were already higher. For example, #13-11 was purchased in May 2018 at $1,435 psf. In contrast, a similar unit in Stack 10, like #13-10, was purchased earlier in February 2017 for just $1,294 psf.
For this reason, Stack 11 units can be pricier even when they’re around the same floor as a Stack 10 counterpart. E.g., #33-11 (bought on 8 Apr 2018) was at $1,493 psf, but #33-10 (bought on 6 May 2017) was at $1,377 psf.
While we need to keep that in mind, here’s how the two stacks ultimately performed in terms of gains:

Sold On | Address | Area (sqft) | Profit (S$) | Bought On | Days | Annualised (%) |
17 Dec 2021 | 18 Clementi Avenue 1 #15-11(Stack 11) | 1,109 | 154,000 | 17 Apr 2018 | 1,340 | 2.5 |
26 Jan 2022 | 18 Clementi Avenue 1 #32-11(Stack 11) | 1,109 | 195,000 | 21 Jan 2018 | 1,466 | 2.8 |
12 Apr 2021 | 18 Clementi Avenue 1 #24-10(Stack 10) | 1,109 | 221,000 | 31 May 2017 | 1,412 | 3.6 |
30 Mar 2020 | 18 Clementi Avenue 1 #04-10(Stack 10) | 1,109 | 222,888 | 27 Feb 2017 | 1,127 | 4.9 |
23 May 2022 | 18 Clementi Avenue 1 #17-11(Stack 11) | 1,109 | 235,622 | 14 May 2018 | 1,470 | 3.5 |
28 May 2021 | 18 Clementi Avenue 1 #17-10(Stack 10) | 1,109 | 302,000 | 25 Feb 2017 | 1,553 | 4.6 |
24 Jun 2021 | 18 Clementi Avenue 1 #22-11(Stack 11) | 1,109 | 309,000 | 25 Feb 2017 | 1,580 | 4.6 |
5 Aug 2021 | 18 Clementi Avenue 1 #15-10(Stack 10) | 1,109 | 338,000 | 25 Feb 2017 | 1,622 | 4.9 |
18 May 2023 | 18 Clementi Avenue 1 #25-11(Stack 11) | 1,109 | 389,888 | 25 Apr 2018 | 1,849 | 4.3 |
6 Oct 2022 | 18 Clementi Avenue 1 #37-11(Stack 11) | 1,109 | 399,000 | 18 Jan 2018 | 1,722 | 4.7 |
19 Jan 2024 | 18 Clementi Avenue 1 #06-11(Stack 11) | 1,109 | 427,000 | 21 May 2018 | 2,069 | 4.3 |
24 Jan 2025 | 18 Clementi Avenue 1 #22-11(Stack 11) | 1,109 | 430,000 | 24 Jun 2021 | 1,310 | 6.3 |
7 Feb 2025 | 18 Clementi Avenue 1 #07-11(Stack 11) | 1,109 | 519,000 | 1 Jun 2018 | 2,443 | 4.3 |
23 May 2024 | 18 Clementi Avenue 1 #26-11(Stack 11) | 1,109 | 552,000 | 24 Mar 2018 | 2,252 | 4.9 |
23 Oct 2023 | 18 Clementi Avenue 1 #23-10(Stack 10) | 1,109 | 639,000 | 15 Apr 2017 | 2,382 | 5.7 |
There has been a larger number of Stack 11 units that transacted on the secondary market. Overall, they have performed better than Stack 10 units in terms of absolute gain (with the exception of one outlier, which was #23-10).
So, how come Stack 10 units, which were bought at a lower price point, still saw smaller gains despite longer holding periods? One possible clue is the higher transaction volume in Stack 11, which may reflect higher demand.
It’s plausible that the sea view attracted more buyers, which contributed to stronger price appreciation over time, sufficient even to overcome the higher initial prices of stack 11.
Three-bedders in blocks 16 and 18 (Stacks 5 and 7)
Stack 5 gets the Clementi Forest view, while Stack 7 gets the sea view. One good point for our comparison is the similarity of unit sizes (all of them are 990 sq. ft), so we can discount size as a factor for this batch.

Date | Size (sqft) | $PSF | Price | Address | $PSF difference |
25 Mar 2018 | 990 | 1,422 | 1,408,000 | 16 Clementi Avenue 1 #03-05(Stack 5) | -9.14% |
25 Feb 2017 | 990 | 1,292 | 1,279,000 | 18 Clementi Avenue 1 #03-07(Stack 7) | |
15 Jul 2018 | 990 | 1,386 | 1,372,550 | 16 Clementi Avenue 1 #04-05(Stack 5) | 1.37% |
25 May 2018 | 990 | 1,405 | 1,391,000 | 18 Clementi Avenue 1 #04-07(Stack 7) | |
25 Feb 2017 | 990 | 1,316 | 1,303,000 | 16 Clementi Avenue 1 #13-05(Stack 5) | 7.37% |
25 Jun 2018 | 990 | 1,413 | 1,399,000 | 18 Clementi Avenue 1 #13-07(Stack 7) | |
20 May 2017 | 990 | 1,339 | 1,326,000 | 16 Clementi Avenue 1 #14-05(Stack 5) | 6.12% |
26 Jun 2018 | 990 | 1,421 | 1,407,000 | 18 Clementi Avenue 1 #14-07(Stack 7) | |
24 Feb 2017 | 990 | 1,342 | 1,329,000 | 16 Clementi Avenue 1 #23-05(Stack 5) | 0.15% |
20 May 2017 | 990 | 1,344 | 1,331,000 | 18 Clementi Avenue 1 #23-07(Stack 7) | |
30 May 2017 | 990 | 1,374 | 1,361,000 | 16 Clementi Avenue 1 #24-05(Stack 5) | -1.24% |
30 Jul 2017 | 990 | 1,357 | 1,344,000 | 18 Clementi Avenue 1 #24-07(Stack 7) | |
8 Apr 2017 | 990 | 1,373 | 1,360,000 | 16 Clementi Avenue 1 #33-05(Stack 5) | 0.87% |
30 Jul 2017 | 990 | 1,385 | 1,372,000 | 18 Clementi Avenue 1 #33-07(Stack 7) | |
23 Jul 2017 | 990 | 1,405 | 1,391,000 | 16 Clementi Avenue 1 #34-05(Stack 5) | 5.98% |
5 Nov 2017 | 990 | 1,489 | 1,475,000 | 18 Clementi Avenue 1 #34-07(Stack 7) |
The initial pricing of stack 7 was a bit higher than stack 5 on average. Stack 7 prices ranged from $1,292 to $1,422 psf, while Stack 5 had units priced from $1,292 to $1,421 psf.
Some of the Stack 5 units were pricier because they were purchased in later sales phases (e.g., in 2018). For example, #04-07 (Stack 5) was purchased in 2018 at $1,405 psf, higher than the $1,292 psf common to Stack 7 in 2017.
Now let’s look at the profits:

Sold On | Address | Area (sqft) | Profit (S$) | Bought On | Days | Annualised (%) |
17 Jun 2021 | 16 Clementi Avenue 1 #03-05(Stack 5) | 990 | 130,000 | 25 Mar 2018 | 1,180 | 2.8 |
22 Sep 2021 | 18 Clementi Avenue 1 #10-07(Stack 7) | 990 | 163,000 | 5 Jun 2018 | 1,205 | 3.4 |
14 Oct 2021 | 18 Clementi Avenue 1 #22-07(Stack 7) | 990 | 201,000 | 4 Apr 2018 | 1,289 | 3.8 |
15 Dec 2021 | 18 Clementi Avenue 1 #30-07(Stack 7) | 990 | 218,000 | 2 Jan 2018 | 1,443 | 3.6 |
10 May 2022 | 18 Clementi Avenue 1 #20-07(Stack 7) | 990 | 242,888 | 6 Apr 2018 | 1,495 | 3.9 |
3 Oct 2022 | 18 Clementi Avenue 1 #27-07 (Stack 7) | 990 | 247,000 | 21 Feb 2018 | 1,685 | 3.5 |
28 Mar 2023 | 18 Clementi Avenue 1 #07-07(Stack 7) | 990 | 301,000 | 26 May 2018 | 1,767 | 4.1 |
24 Jun 2021 | 18 Clementi Avenue 1 #36-07(Stack 7) | 990 | 306,888 | 7 Mar 2017 | 1,570 | 4.9 |
27 Aug 2021 | 16 Clementi Avenue 1 #38-05(Stack 5) | 990 | 310,000 | 22 Apr 2017 | 1,588 | 4.8 |
27 Apr 2022 | 16 Clementi Avenue 1 #09-05(Stack 5) | 990 | 345,000 | 25 Feb 2017 | 1,887 | 4.7 |
21 Aug 2023 | 18 Clementi Avenue 1 #14-07(Stack 7) | 990 | 394,000 | 26 Jun 2018 | 1,882 | 4.9 |
20 Jun 2024 | 18 Clementi Avenue 1 #12-07(Stack 7) | 990 | 418,000 | 18 May 2018 | 2,225 | 4.3 |
3 May 2023 | 16 Clementi Avenue 1 #37-05(Stack 5) | 990 | 424,000 | 3 Jun 2017 | 2,160 | 4.6 |
18 Apr 2024 | 18 Clementi Avenue 1 #32-07(Stack 7) | 990 | 541,000 | 23 Aug 2017 | 2,430 | 5.1 |
24 Jul 2024 | 16 Clementi Avenue 1 #18-05(Stack 5) | 990 | 574,000 | 24 Feb 2017 | 2,707 | 5 |
3 Sep 2024 | 16 Clementi Avenue 1 #25-05(Stack 5) | 990 | 596,000 | 25 Feb 2017 | 2,747 | 5 |
Stack 7 units had impressive absolute profits, especially for units purchased later and closer to completion. #07-07 (purchased late in May 2018) earned $301,000 profit, showing a return of 4.1 per cent.
Stack 5 also had units with a good showing, such as #25-05 with a $596,000 profit and an annualised return of five per cent; but we need to consider it benefitted from a longer holding period, having been bought earlier in February 2017.
Overall, Stack 5 units generally seem to have appreciated at a faster pace, resulting in higher profits for early purchasers. Stack 7 units’ gains were possibly slowed by the higher entry price; but their ability to narrow the gap demonstrates the high demand for sea view units.
Finally, let’s look at four-bedder units
We’ll compare the four-bedders from blocks 16 and 18 (stacks 1 and 8). We got lucky again, as these units are all the same size and layout; so we can eliminate that as factors. Stack 1 gets the sea view, while Stack 8 has the Clementi Forest view.

Date | Size (sqft) | $PSF | Price | Address | $PSF difference |
7 Apr 2018 | 1,346 | 1,446 | 1,945,000 | 16 Clementi Avenue 1 #03-01(Stack 1) | 20.20% |
25 Feb 2017 | 1,346 | 1,203 | 1,618,000 | 18 Clementi Avenue 1 #03-08(Stack 8) | |
4 Nov 2017 | 1,346 | 1,385 | 1,864,000 | 16 Clementi Avenue 1 #04-01(Stack 1) | 14.94% |
5 Mar 2017 | 1,346 | 1,205 | 1,622,000 | 18 Clementi Avenue 1 #04-08(Stack 8) | |
3 Jun 2017 | 1,346 | 1,284 | 1,728,000 | 16 Clementi Avenue 1 #13-01(Stack 1) | 4.05% |
27 Feb 2017 | 1,346 | 1,234 | 1,661,000 | 18 Clementi Avenue 1 #13-08(Stack 8) | |
10 Mar 2018 | 1,346 | 1,480 | 1,992,000 | 16 Clementi Avenue 1 #14-01(Stack 1) | 15.99% |
21 May 2017 | 1,346 | 1,276 | 1,717,000 | 18 Clementi Avenue 1 #14-08(Stack 8) | |
25 Feb 2017 | 1,346 | 1,263 | 1,699,000 | 16 Clementi Avenue 1 #23-01(Stack 1) | -0.47% |
25 Feb 2017 | 1,346 | 1,269 | 1,707,000 | 18 Clementi Avenue 1 #23-08(Stack 8) | |
26 Feb 2017 | 1,346 | 1,266 | 1,703,000 | 16 Clementi Avenue 1 #24-01(Stack 1) | -4.74% |
9 Jul 2017 | 1,346 | 1,329 | 1,788,000 | 18 Clementi Avenue 1 #24-08(Stack 8) | |
25 Feb 2017 | 1,346 | 1,298 | 1,746,000 | 16 Clementi Avenue 1 #33-01(Stack 1) | -1.14% |
30 Mar 2017 | 1,346 | 1,313 | 1,767,000 | 18 Clementi Avenue 1 #33-08(Stack 8) | |
25 Feb 2017 | 1,346 | 1,301 | 1,751,000 | 16 Clementi Avenue 1 #34-01(Stack 1) | -16.55% |
15 Apr 2018 | 1,346 | 1,559 | 2,097,000 | 18 Clementi Avenue 1 #34-08(Stack 8) |
Interestingly, both #23-01 and #23-08 were priced the same at the launch; and Stack 8 actually cost a bit more than Stack 1 overall. This is unusual as, most of the time, a sea view unit will command a higher premium. This could reflect the developer’s strategy to avoid making an early assumption, about which facing would prove more popular.
Later in the launch though, as prices increased, the price gap between the two stacks began to widen; especially when one unit was bought much later than the other. For example, by 10th March 2018, #14-01 (sea view) was purchased at $1,480 psf, as opposed to #14-08 (forest view) which was just $1,276 psf.
Now let’s look at profits:

Sold On | Address | Area (sqft) | Profit (S$) | Bought On | Days | Annualised (%) |
3 Feb 2021 | 18 Clementi Avenue 1 #31-08(Stack 8) | 1,346 | 229,000 | 4 Jun 2017 | 1,340 | 3.3 |
18 Jun 2021 | 16 Clementi Avenue 1 #20-01(Stack 1) | 1,346 | 259,000 | 11 Mar 2017 | 1,560 | 3.4 |
19 Mar 2021 | 16 Clementi Avenue 1 #35-01(Stack 1) | 1,346 | 316,000 | 25 Feb 2017 | 1,483 | 4.2 |
5 Aug 2020 | 16 Clementi Avenue 1 #27-01(Stack 1) | 1,346 | 321,888 | 25 Feb 2017 | 1,257 | 5.1 |
10 Nov 2020 | 18 Clementi Avenue 1 #11-08(Stack 8) | 1,346 | 354,000 | 25 Feb 2017 | 1,354 | 5.4 |
15 Apr 2020 | 18 Clementi Avenue 1 #04-08(Stack 8) | 1,346 | 358,000 | 5 Mar 2017 | 1,137 | 6.6 |
4 Aug 2021 | 16 Clementi Avenue 1 #12-01(Stack 1) | 1,346 | 389,888 | 13 Mar 2017 | 1,605 | 4.9 |
4 Apr 2022 | 18 Clementi Avenue 1 #14-08(Stack 8) | 1,346 | 423,000 | 21 May 2017 | 1,779 | 4.6 |
17 Mar 2022 | 16 Clementi Avenue 1 #37-01(Stack 1) | 1,346 | 484,000 | 25 Feb 2017 | 1,846 | 4.9 |
31 May 2022 | 18 Clementi Avenue 1 #36-08(Stack 8) | 1,346 | 519,000 | 23 Mar 2017 | 1,895 | 5 |
28 Feb 2023 | 18 Clementi Avenue 1 #23-08(Stack 8) | 1,346 | 743,000 | 25 Feb 2017 | 2,194 | 6.2 |
10 Jan 2024 | 18 Clementi Avenue 1 #20-08(Stack 8) | 1,346 | 806,000 | 10 May 2017 | 2,436 | 5.9 |
6 Jan 2025 | 16 Clementi Avenue 1 #07-01(Stack 1) | 1,346 | 898,000 | 25 Feb 2017 | 2,872 | 5.7 |
As a whole, Stack 8 beat Stack 1, so the forest beat the sea in this set. Look at #23-08 (forest view), for example. It saw a profit of $743,000 with an annualised return of 6.2 per cent, as contrasted with #07-01 (sea view).
While #07-01 had a higher absolute profit ($898,000), it had a much longer holding period (almost eight years), resulting in a lower annualised return of 5.7 per cent.
To be clear, both stacks are quite impressive, and the four-bedders performed better than all the other unit types we’ve covered. Even Stack 1 performed well, particularly with early purchases like #07-01 yielding substantial returns.
It turns out, the view does matter—just not always in the way you’d expect.
At The Clement Canopy, forest-facing four-bedders outperformed their sea-view counterparts in both annualised returns and total profits for early buyers. Meanwhile, certain sea-facing stacks commanded higher launch prices but delivered more modest returns due to timing and layout factors.
In short: it’s not just about the view—it’s about when you buy, how the unit is laid out, and what other buyers are willing to pay down the line.
While most buyers default to assumptions like “higher floor” or “sea view equals better returns,” this deep dive shows how nuanced resale performance really is, especially in newer leasehold projects.
We’ve used this framework to help clients identify undervalued units that outperformed the market.
Want help assessing the stack, layout, or view that gives you the best long-term upside? Schedule a session with our real estate consultants—we’re happy to share what we’re seeing.
Next, we’ll look at Seaside Residences, to see how different views are affecting prices there.
Ryan J
A seasoned content strategist with over 17 years in the real estate and financial journalism sectors, Ryan has built a reputation for transforming complex industry jargon into accessible knowledge. With a track record of writing and editing for leading financial platforms and publications, Ryan's expertise has been recognised across various media outlets. His role as a former content editor for 99.co and a co-host for CNA 938's Open House programme underscores his commitment to providing valuable insights into the property market.Read next from Property Investment Insights

Property Investment Insights Sea View Vs Landed View: We Analysed Seaside Residences Resale Profits — Here’s What Paid Off

Property Investment Insights Selling Your Condo? This Overlooked Factor Could Quietly Undercut Your Selling Price

Property Investment Insights How Different Condo Views Affect Returns In Singapore: A 25-Year Study Of Pebble Bay

Property Investment Insights Can Leasehold Condos Deliver Better Returns Than Freehold? A 10-Year Data Study Says Yes
Latest Posts

Homeowner Stories Why We Chose A Walk-Up Apartment (Yes, With No Lift) For Our First Home

Landed Home Tours Inside Balmoral Park: Rare Freehold Landed Homes With 1.6 Plot Ratio In District 10

Singapore Property News New Record For Landed Home Prices In Singapore: It’s Like An A+ in The Least Important Exam

Homeowner Stories How a 57% Rent Spike Drove Flor Patisserie Out — And What It Says About Singapore’s Retail Scene

Property Trends Should You Wait For The Property Market To Dip? Here’s What Past Price Crashes In Singapore Show

Home Tours Inside A Minimalist’s Tiny Loft With A Stunning City View

On The Market 5 Most Affordable Newly MOP 4-Room HDB Flats From $585k

Property Market Commentary Distressed Property Sales Are Up In Singapore In 2025: But Don’t Expect Bargain Prices

Singapore Property News This $1.5M Bukit Timah Executive HDB Flat With 62-Years Lease Left Just Set A Record: Here’s Why

Editor's Pick Where To Find The Cheapest 2 Bedroom Resale Units In Central Singapore (From $1.2m)

Property Picks 19 Cheaper New Launch Condos Priced At $1.5m Or Less. Here’s Where To Look

Property Advice The Ultimate Work From Home Homebuyer Checklist (That Most People Still Overlook)

Editor's Pick These $4m Freehold Landed Homes In Joo Chiat Have A 1.4 Plot Ratio: What Buyers Should Know

Editor's Pick Now That GE2025 Is Over, Let’s Talk About The Housing Proposals That Didn’t Get Enough Scrutiny

Property Advice When ‘Bad’ Property Traits Can Be A Bargain For Homebuyers In Singapore
