Skye At Holland Pricing Review: How It Compares To Nearby Resale And New Launches

Get The Property Insights Serious Buyers Read First: Join 50,000+ readers who rely on our weekly breakdowns of Singapore’s property market.

A seasoned content strategist with over 17 years in the real estate and financial journalism sectors, Ryan has built a reputation for transforming complex industry jargon into accessible knowledge. With a track record of writing and editing for leading financial platforms and publications, Ryan's expertise has been recognised across various media outlets. His role as a former content editor for 99.co and a co-host for CNA 938's Open House programme underscores his commitment to providing valuable insights into the property market.
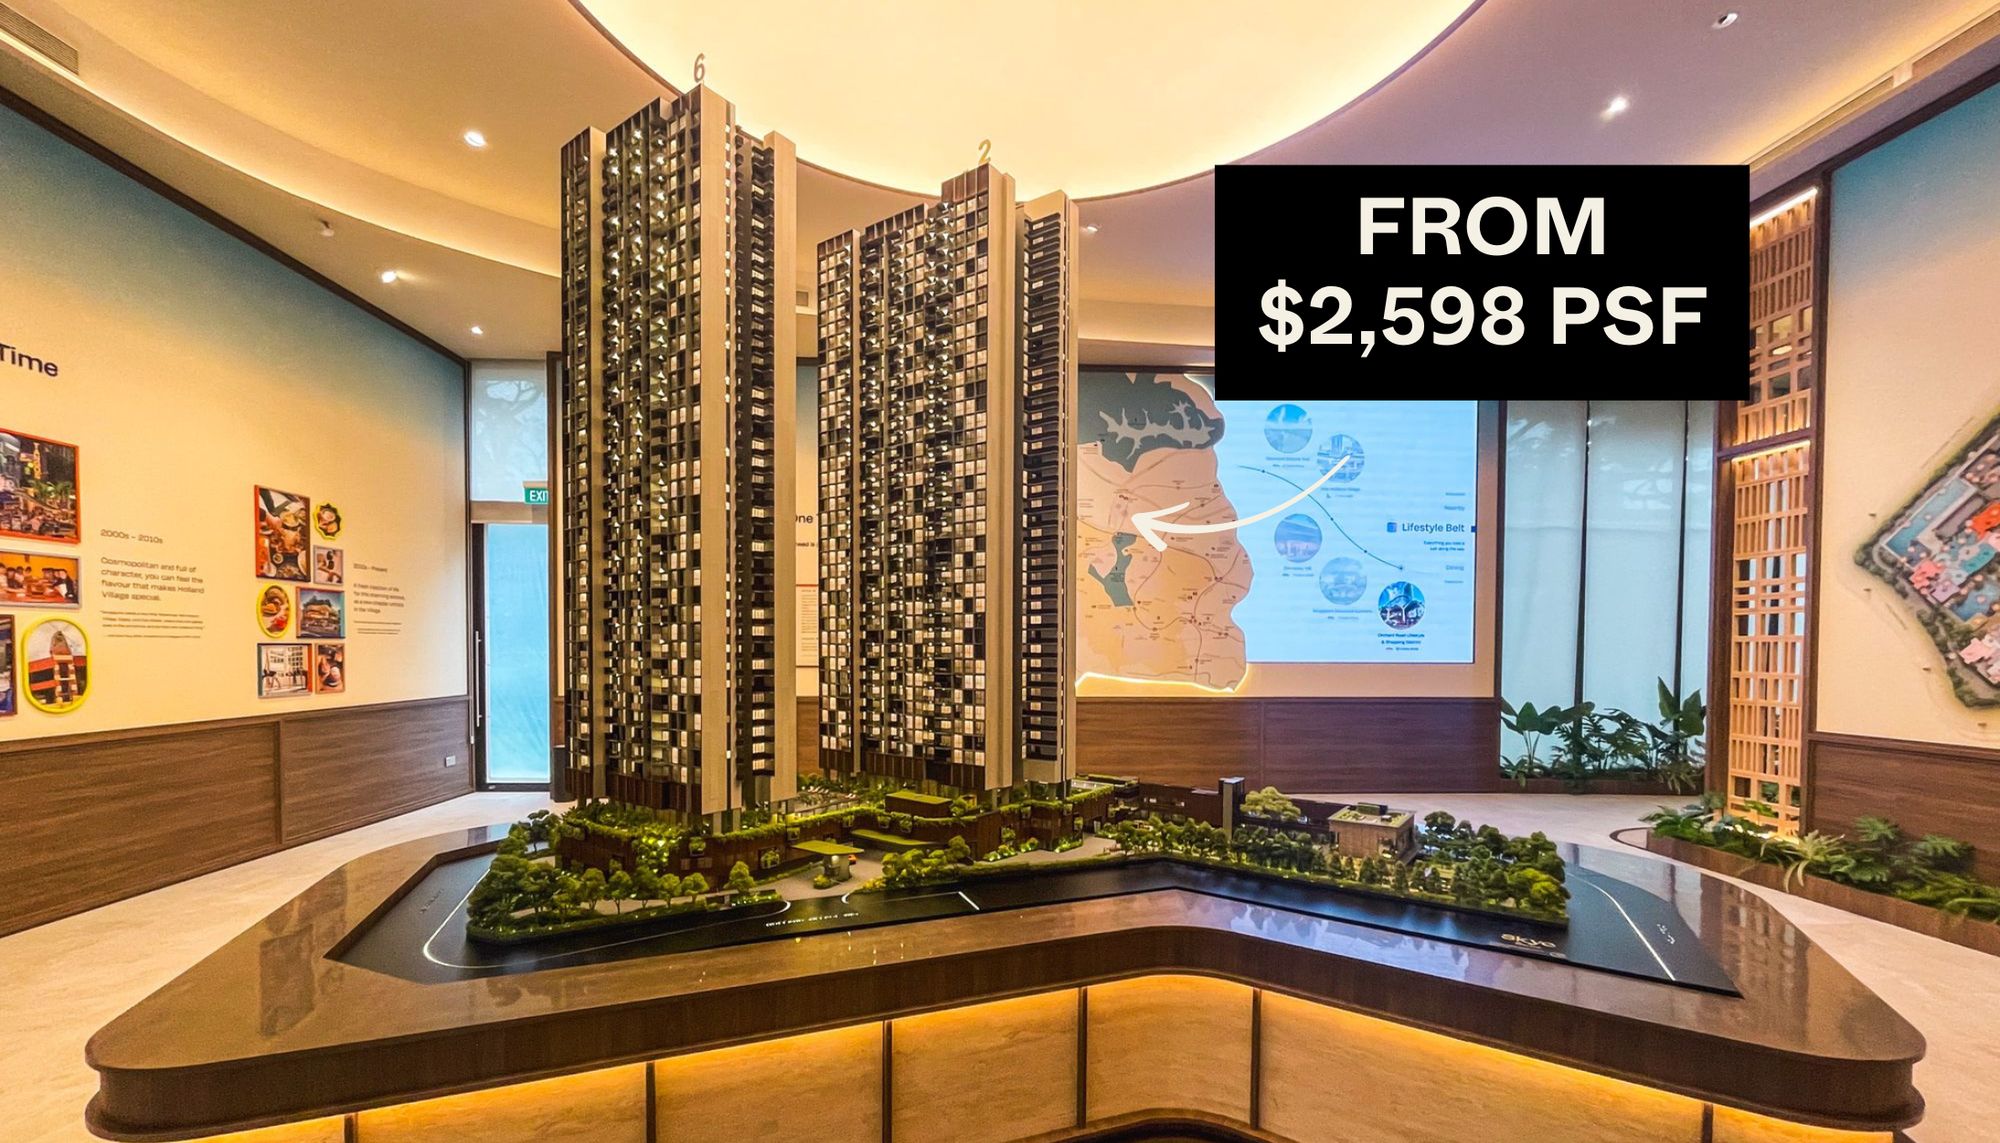
In many ways, the pricing review gets to the core of Skye at Holland’s appeal. Beyond the usual considerations of location and build quality (which we’ve covered in detail in the full review), the real talking point here is its relative affordability within Holland Village. For a new launch in this area, the numbers stand out not because they’re low in absolute terms, but because of how they compare against the historical norm and current competition.
In this review, we’ll take a closer look at where Skye at Holland sits on the pricing spectrum, how it stacks up against surrounding projects, and why its price point has caught the attention of buyers who might otherwise have written off Holland V as out of reach.
Quick Summary
- Skye at Holland launches from $2,598 psf, among the lowest new-launch entry points in District 10.
- Compact unit sizes keep the overall quantum competitive, with two-bedders from $1.51 million and three-bedders from $2.4 million.
- Resale comparisons show its entry prices sit at the low end across two-, three-, and four-bedroom units in Holland V.
- The closest peer, One Holland Village Residences, is priced higher across all unit types despite similar layouts.
- Buyer demand in D10 is strongest in the $2.1 million to $2.5 million range, directly aligned with Skye’s two- and three-bedroom offerings.
Our key considerations when it comes to Skye at Holland’s price
In the following, we will look at:
- District performance: How District 10 (D10) has been doing across market segments and tenures, and what that means for a 2025 CCR launch.
- Resale benchmarks: How Skye at Holland’s entry prices stack up against nearby resale condos, both by psf and quantum.
- Nearest competitor check: How Skye at Holland’s prices and layouts compare to the closest real alternative in the same catchment.
- New launch context by bedroom type: Where each bedroom type sits against current-launch minimums and medians in the CCR and wider market.
- Exit strategy: Who the likely buyers are at resale, expected quantum for each bedroom type, supply in the area versus demand, and historical profit and loss patterns for similar units.
Indicative starting prices for Skye at Holland
Unit type | Estimated size (sqft) | Indicative starting price | Estimated starting $PSF |
2 Bedroom | 581 – 743 | $1,510,000 | $2,598 |
3 Bedroom | 915 – 1,076 | $2,400,000 | $2,623 |
4 Bedroom | 1,238 – 1,464 | $3,340,000 | $2,698 |
5 Bedroom | 1,765 | ||
Average Starting $PSF | $2,640 |
Now let’s see how non-landed private homes (condos) performed in D10, over the past decade
We will include all transactions, including new sale, resale, and sub sale:
All projects and tenures
Year | D10 | All non-landed private properties |
2014 | $1,858 | $1,289 |
2015 | $1,841 | $1,180 |
2016 | $1,878 | $1,232 |
2017 | $1,880 | $1,304 |
2018 | $2,029 | $1,435 |
2019 | $2,384 | $1,560 |
2020 | $2,152 | $1,513 |
2021 | $2,336 | $1,600 |
2022 | $2,565 | $1,712 |
2023 | $2,540 | $1,869 |
2024 | $2,434 | $1,886 |
Annualised | 2.74% | 3.88% |

For the past decade, District 10’s performance has been steady, though its high starting base makes percentage gains look smaller.
Average prices moved from $1,858 psf in 2014 to $2,434 psf in 2024, translating to an annualised growth of about 2.74 per cent.
In contrast, the overall non-landed private property market grew from $1,289 to $1,886 psf in the same period, or an annualised 3.88 per cent.
99-year leasehold properties
Year | D10 | All non-landed private properties |
2014 | $1,582 | $1,195 |
2015 | $1,605 | $1,104 |
2016 | $1,523 | $1,166 |
2017 | $1,555 | $1,230 |
2018 | $1,508 | $1,359 |
2019 | $2,268 | $1,474 |
2020 | $2,029 | $1,453 |
2021 | $2,057 | $1,517 |
2022 | $2,186 | $1,595 |
2023 | $2,205 | $1,783 |
2024 | $2,651 | $1,854 |
Annualised | 5.30% | 4.49% |

There’s a notable change when we focus on leasehold condos in D10.
For 99-year projects, average prices rose from $1,582 psf in 2014 to $2,651 psf in 2024. That’s an annualised gain of 5.30 per cent – stronger than the overall non-landed leasehold market, which grew from $1,195 to $1,854 psf over the same period (4.49 per cent annualised).
999-year/freehold properties
Year | D10 | All non-landed private properties |
2014 | $1,902 | $1,505 |
2015 | $1,894 | $1,438 |
2016 | $1,984 | $1,470 |
2017 | $1,946 | $1,501 |
2018 | $2,118 | $1,617 |
2019 | $2,438 | $1,797 |
2020 | $2,188 | $1,688 |
2021 | $2,411 | $1,812 |
2022 | $2,657 | $1,995 |
2023 | $2,626 | $2,111 |
2024 | $2,331 | $2,003 |
Annualised | 2.05% | 2.90% |

The freehold/999-year segment of D10 has been more subdued.
From 2014 to 2024, average prices moved from $1,902 to $2,331 psf, or an annualised gain of just 2.05 per cent. In comparison, freehold condos in the wider market saw a stronger 2.90 per cent annualised growth.
As such, we can see that freehold in D10 didn’t seem to perform as well as leasehold; likely because they started higher and had less room for appreciation. This is worth keeping in mind for Skye at Holland, whenever someone points out it’s not freehold.
An interesting quirk: As a collective whole, D10 underperforms the overall non-landed market. But breaking down by tenure, its 99-year projects actually outpaced the broader market. It’s actually the 999-year/freehold segment that lagged behind the wider market; even though D10 is famous for its high number of freehold projects.
Now let’s compare D10’s performance to the three different regions: OCR, RCR, and CCR
All tenures
Year | D10 | CCR | RCR | OCR |
2014 | $1,858 | $1,971 | $1,408 | $1,062 |
2015 | $1,841 | $1,846 | $1,383 | $1,010 |
2016 | $1,878 | $1,968 | $1,390 | $1,008 |
2017 | $1,880 | $1,940 | $1,464 | $1,053 |
2018 | $2,029 | $2,161 | $1,594 | $1,139 |
2019 | $2,384 | $2,294 | $1,726 | $1,225 |
2020 | $2,152 | $2,181 | $1,681 | $1,229 |
2021 | $2,336 | $2,318 | $1,808 | $1,252 |
2022 | $2,565 | $2,451 | $1,893 | $1,381 |
2023 | $2,540 | $2,512 | $2,102 | $1,518 |
2024 | $2,434 | $2,330 | $2,159 | $1,653 |
Annualised | 2.74% | 1.69% | 4.37% | 4.53% |

D10’s performance sits in the middle of the pack. Prices rose by an annualised 2.74 per cent, which is ahead of the broader CCR (1.69 per cent); but this is well behind both the RCR (4.37 per cent) and OCR (4.53 per cent).
This isn’t too surprising, as projects in the RCR and OCR cost less and have more room for percentage price growth.
99-year leasehold properties
Year | D10 | CCR | RCR | OCR |
2014 | $1,582 | $2,073 | $1,453 | $1,025 |
2015 | $1,605 | $1,857 | $1,417 | $993 |
2016 | $1,523 | $2,106 | $1,420 | $999 |
2017 | $1,555 | $1,984 | $1,509 | $1,050 |
2018 | $1,508 | $2,153 | $1,636 | $1,139 |
2019 | $2,268 | $2,319 | $1,739 | $1,225 |
2020 | $2,029 | $2,226 | $1,714 | $1,222 |
2021 | $2,057 | $2,327 | $1,873 | $1,228 |
2022 | $2,186 | $2,311 | $1,970 | $1,354 |
2023 | $2,205 | $2,316 | $2,186 | $1,520 |
2024 | $2,651 | $2,312 | $2,230 | $1,661 |
Annualised | 5.30% | 1.10% | 4.38% | 4.95% |

For 99-year properties, D10 again looks to be doing well. The annualised gain of 5.0 per cent is well ahead of the wider CCR leasehold segment (just 1.10 per cent) and even edges out the RCR (4.38 per cent) and OCR (4.95 per cent).
This is unexpected, as conventional wisdom often claims that “leasehold properties surrounded by freehold” don’t perform well.
999-year/freehold properties
Year | D10 | CCR | RCR | OCR |
2014 | $1,902 | $1,940 | $1,415 | $1,261 |
2015 | $1,894 | $1,855 | $1,320 | $1,178 |
2016 | $1,984 | $1,896 | $1,339 | $1,135 |
2017 | $1,946 | $1,939 | $1,404 | $1,100 |
2018 | $2,118 | $2,203 | $1,526 | $1,161 |
2019 | $2,438 | $2,316 | $1,715 | $1,260 |
2020 | $2,188 | $2,182 | $1,640 | $1,238 |
2021 | $2,411 | $2,341 | $1,690 | $1,326 |
2022 | $2,657 | $2,551 | $1,774 | $1,518 |
2023 | $2,626 | $2,638 | $1,948 | $1,514 |
2024 | $2,331 | $2,371 | $2,044 | $1,597 |
Annualised | 2.05% | 2.03% | 3.74% | 2.39% |

D10’s freehold properties moved in tandem with the wider CCR, with a negligible difference of 2.05 versus 2.03 per cent; but it lagged behind the RCR at 3.74 per cent and the OCR at 2.39 per cent.
With that in mind, let’s see how resale prices near Skye at Holland measure up
For this comparison, we’re focusing on projects located within a 15-minute walk of Holland Village MRT. The data reflects resale and sub sale transactions recorded between 2024 and June 2025.
Project | Completion year | Tenure | No. of units | Unit mix | Avg size | Avg $PSF | Avg price | No. of tnx |
URBAN EDGE @ HOLLAND V | 2007 | Freehold | 31 | 2, 3 | 1482 | $1,831 | $2,695,000 | 3 |
WILLYN VILLE | 1982 | Freehold | 37 | 2, 4 | 1330 | $2,022 | $2,640,000 | 2 |
THE MERASAGA | 1995 | 99-years | 116 | 2, 3, 4 | 1231 | $2,043 | $2,500,000 | 3 |
THE FORD @ HOLLAND | 2009 | Freehold | 75 condos, 10 landed | 1, 2, 3, 4 | 817 | $2,070 | $1,698,000 | 7 |
LEEDON 2 | 1996 | Freehold | 72 | 2, 3 | 1026 | $2,095 | $2,136,000 | 3 |
HOLLAND RESIDENCES | 2012 | Freehold | 83 | 1, 2, 3, 4 | 1322 | $2,136 | $2,767,600 | 5 |
YGK GARDEN | 2008 | Freehold | 16 | 3 | 2067 | $2,168 | $4,480,000 | 1 |
WARNER COURT | 1985 | Freehold | 36 | 2, 3, 4 | 1270 | $2,204 | $2,800,000 | 1 |
LOFT@HOLLAND | 2014 | Freehold | 41 | 1 | 546 | $2,237 | $1,041,629 | 3 |
PARVIS | 2012 | Freehold | 248 | 2, 3, 4 | 1968 | $2,381 | $4,652,250 | 8 |
MOOI RESIDENCES | 2024 | Freehold | 24 | 2, 3, 4 | 592 | $2,432 | $1,440,000 | 1 |
SKYE AT HOLLAND | Starting from $2,598 | |||||||
ONE HOLLAND VILLAGE RESIDENCES | 2024 | 99-years | 296 | 1, 2, 3, 4, 5 | 1238 | $3,781 | $4,680,000 | 1 |
The majority of nearby projects are freehold, and many transacted at lower $PSF rates than Skye at Holland’s starting $2,598 psf. For example, Warner Court ($2,204 psf), Holland Residences ($2,136 psf), and The Ford @ Holland ($2,070 psf) all averaged lower $PSF prices. However, these older projects also have much larger average unit sizes – ranging from 1,200 to almost 2,000 sq ft – which keeps the quantum (overall price) much higher.
The only project with a higher average $PSF is One Holland Village Residences at $3,781 psf; but there’s just one sub sale transaction so far, so we can’t conclude much from it.
Next, we’ll break it down into unit types/sizes
2-bedroom units
Project | Avg $PSF | Avg price | No. of tnx |
MOOI RESIDENCES | $2,432 | $1,440,000 | 1 |
SKYE AT HOLLAND | Starting from $1,510,000 | ||
URBAN EDGE @ HOLLAND V | $1,888 | $1,585,000 | 1 |
LEEDON 2 | $2,183 | $1,668,000 | 1 |
WILLYN VILLE | $2,139 | $1,980,000 | 1 |
THE MERASAGA | $2,140 | $2,050,000 | 1 |
HOLLAND RESIDENCES | $2,206 | $2,149,000 | 2 |
PARVIS | $2,391 | $2,368,000 | 1 |
WARNER COURT | $2,204 | $2,800,000 | 1 |

Average $PSF for two-bedroom units ranged from around $1,888 at Urban Edge to $2,432 at Mooi Residences, with overall quantum prices between $1.44 million and $2.8 million.
Skye at Holland’s two-bedders start from $1.51 million, putting them at the lower end despite a higher starting $PSF than most. This is because the older units tended to be larger and cost more overall.
3-bedroom units
Project | Avg $PSF | Avg price | No. of tnx |
LEEDON 2 | $2,052 | $2,370,000 | 2 |
SKYE AT HOLLAND | Starting from $2,400,000 | ||
THE FORD @ HOLLAND | $2,127 | $2,450,000 | 1 |
THE MERASAGA | $1,994 | $2,725,000 | 2 |
HOLLAND RESIDENCES | $2,089 | $3,180,000 | 3 |
URBAN EDGE @ HOLLAND V | $1,803 | $3,250,000 | 2 |
YGK GARDEN | $2,168 | $4,480,000 | 1 |
PARVIS | $2,316 | $4,530,000 | 2 |
ONE HOLLAND VILLAGE RESIDENCES | $3,781 | $4,680,000 | 1 |

Resale three-bedders in the area mostly hover between $2.37 million (Leedon 2) and $4.53 million (Parvis).
As such, Skye at Holland’s entry from $2.4 million places it at the lower end of this range, making it very competitive. Remember, it’s also the newest among them, which makes its lower price more remarkable.
Project | Avg $PSF | Avg price | No. of tnx |
WILLYN VILLE | $1,904 | $3,300,000 | 1 |
SKYE AT HOLLAND | Starting from $3,340,000 | ||
THE FORD @ HOLLAND | $2,085 | $3,950,000 | 1 |
PARVIS | $2,404 | $5,158,000 | 5 |

For four-bedder units, resale prices span from $3.3 million at Willyn Ville to over $5.15 million at Parvis. Skye at Holland’s four-bedders start at around $3.34 million, again positioning it at the entry level in terms of quantum. On a $PSF basis, Skye will come in expectedly higher, given that older projects have more square footage.
Given that most of the nearby projects are boutique developments, transaction volumes are naturally thin, often just one or two sales over the past 18 months. Even so, the pattern is clear: across the two-, three-, and four-bedroom segments, Skye at Holland’s indicative starting prices sit at the lower end compared to surrounding condos.
Across the two-, three-, and four-bedroom segments, Skye at Holland’s indicative starting prices sit at the lower end compared to surrounding condos
Also, none of the nearby projects offer five-bedroom units, which means Skye at Holland is filling a gap in the area’s supply.
Speaking of size, let’s compare the square footage with other nearby projects
2-bedroom units
Project | Min. size (sq ft) |
SKYE AT HOLLAND | Starting from 581 |
MOOI RESIDENCES | 592 |
ONE HOLLAND VILLAGE RESIDENCES | 689 |
LEEDON 2 | 764 |
URBAN EDGE @ HOLLAND V | 840 |
WILLYN VILLE | 861 |
THE MERASAGA | 947 |
HOLLAND RESIDENCES | 958 |
THE FORD @ HOLLAND | 980 |
PARVIS | 990 |
WARNER COURT | 1,141 |
3-bedroom units
Project | Min. size (sq ft) |
MOOI RESIDENCES | 850 |
SKYE AT HOLLAND | Starting from 915 |
ONE HOLLAND VILLAGE RESIDENCES | 1,098 |
THE FORD @ HOLLAND | 1,109 |
LEEDON 2 | 1,109 |
URBAN EDGE @ HOLLAND V | 1,227 |
THE MERASAGA | 1,346 |
HOLLAND RESIDENCES | 1,356 |
PARVIS | 1,701 |
YGK GARDEN | 2,067 |
WARNER COURT | 2,637 |
4-bedroom units
Project | Min. size (sq ft) |
SKYE AT HOLLAND | Starting from 1238 |
MOOI RESIDENCES | 1,335 |
WILLYN VILLE | 1,518 |
THE MERASAGA | 1,701 |
THE FORD @ HOLLAND | 1,894 |
PARVIS | 1,991 |
ONE HOLLAND VILLAGE RESIDENCES | 2,088 |
HOLLAND RESIDENCES | 2,185 |
WARNER COURT | 2,713 |
When it comes to size, Skye at Holland has the smallest units on average. Its two- and four-bedroom units are the smallest among nearby projects, starting from just 581 sq ft and 1,238 sq ft respectively.
For three-bedders, it is the second smallest at 915 sq ft, just above Mooi Residences at 850 sq ft. This makes Mooi Residences the most comparable project in terms of unit size. However, there was only a single two-bedroom transaction there in the past 18 months, so we need to be careful about drawing any conclusions from that.
Now let’s look at nearby resale projects, with prices close to Skye at Holland
Mooi Residences’ profitability
The following includes all sub sale and resale transactions
Losses
Description | 2BR | Entire Project (Average) |
Average gains | -$140,000 | -$140,000 |
Average purchase price | $1,580,048 | $1,580,048 |
ROI | -8.86% | -8.86% |
No. of tnx | 1 | 1 |
Average holding period (years) | 3.0 | 3.0 |
Mooi Residences is the closest to Skye at Holland in terms of size. Unfortunately, a single transaction doesn’t tell us much. This sole transaction recorded a loss of $140,000 over a short holding period of three years; but we can’t read much into this. We include it here for completeness only.
Leedon 2’s profitability
The following includes all sub sale and resale transactions
Gains
Description | 2BR | 3BR | Entire Project (Average) |
Average gains | $287,199 | $361,302 | $324,251 |
Average purchase price | $967,547 | $1,243,125 | $1,105,336 |
ROI | 45.04% | 34.40% | 39.72% |
No. of tnx | 21 | 30 | 51 (Total) |
Average holding period (years) | 12.2 | 11.8 | 12.0 |
Losses
Description | 2BR | 3BR | Entire Project (Average) |
Average gains | -$304,356 | -$494,211 | -$399,284 |
Average purchase price | $982,100 | $1,450,750 | $1,216,425 |
ROI | -31.38% | -33.98% | -32.68% |
No. of tnx | 10 | 7 | 17 (Total) |
Average holding period (years) | 7.9 | 6.8 | 7.4 |
Leedon 2 gives us more transactions to work with. Across 51 profitable transactions, average gains came in at around $324,000 (39.7 per cent ROI) with holding periods of about 12 years.
Compared to Skye at Holland’s indicative pricing, Leedon 2 offers larger units at an accordingly lower $PSF. This does drive up the quantum though.
Willyn Ville’s profitability
The following includes all sub sale and resale transactions
More from Stacked
The Arden Review: One Of The Cheapest New Launches Of 2023 With 3.2m High Ceilings
When I think about Bukit Panjang, two things instinctively come to mind: big forested areas and the mega HDB estate…
Gains
Description | 2BR | 4BR | Entire Project (Average) |
Average gains | $501,765 | $1,563,750 | $1,032,758 |
Average purchase price | $756,228 | $811,019 | $783,623 |
ROI | 68.68% | 192.21% | 130.44% |
No. of tnx | 9 | 4 | 13 (Total) |
Average holding period (years) | 12.1 | 16.9 | 14.5 |
Losses
Description | 2BR | 4BR | Entire Project (Average) |
Average gains | -$84,000 | -$275,000 | -$179,500 |
Average purchase price | $628,660 | $989,543 | $809,101 |
ROI | -13.41% | -27.79% | -20.60% |
No. of tnx | 2 | 1 | 3 (Total) |
Average holding period (years) | 3.9 | 7.4 | 5.6 |
Willyn Ville has shown strong long-term performance, with average gains of over $1 million (130.4 per cent ROI) across 13 profitable transactions held for about 14 years.
Compared to Skye at Holland, Willyn Ville units are larger, freehold, and come at lower $PSF levels; however, as a boutique project, it lacks the scale and facilities of a mid-sized development. For buyers, this will probably make Skye at Holland the more attractive option, if they prefer liquidity and amenities over freehold status.
That said, the project closest in comparison to Skye at Holland is One Holland Village Residences.
It is the newest 99-year leasehold development on an adjacent plot, with a small-to-mid-sized scale that feels more comparable. With only one sub sale transaction so far, resale data is limited; so for now, the best comparison lies in looking at its average new launch prices and a simple price matrix.
You can see a full review for One Holland Village Residences here.
No. of bedrooms | Min. price | Max price | Average new sale price |
2 | $1,609,163 | $3,213,760 | $2,183,026 |
3 | $2,562,190 | $5,110,000 | $3,204,573 |
4 | $6,415,910 | $11,351,280 | $7,727,539 |
5 | $11,402,300 | $11,402,300 | $11,402,300 |
No. of bedrooms | Min. $PSF | Max. $PSF | Average new sale $PSF |
2 | $2,317 | $3,172 | $2,713 |
3 | $2,315 | $3,391 | $2,777 |
4 | $3,072 | $3,426 | $3,249 |
5 | $3,300 | $3,300 | $3,300 |
Skye At Holland’s pricing for reference
Unit type | Estimated size (sqft) | Indicative starting price | Estimated starting $PSF |
2 Bedroom | 581 – 743 | $1,510,000 | $2,598 |
3 Bedroom | 915 – 1,076 | $2,400,000 | $2,623 |
4 Bedroom | 1,238 – 1,464 | $3,340,000 | $2,698 |
One Holland Village Residences’ minimum prices – across all unit types – are higher than those at Skye at Holland. This is partly explained by its larger unit sizes, as One Holland’s starting $PSF is lower in most cases (the exception being the four-bedders, where One Holland starts from above $3,000 psf).
For buyers, this means Skye at Holland provides a cheaper entry into the same area, albeit with smaller layouts.
The $PSF range seen at One Holland may also provide a useful, if somewhat limited, benchmark at this point. If Skye at Holland’s units can appreciate at the same pace, buyers today could see meaningful upside.
With that in mind, it’s worth looking beyond just numbers.
Let’s compare the floor plans of Skye at Holland with those at One Holland Village Residences, to see how the two compare. We will be comparing the smallest unit for each layout, in both condos.
Two-bedroom units

The two-bedroom units at One Holland Village Residences are larger than those at Skye at Holland. However, Skye at Holland is a post-GFA harmonisation project, so the difference may be less than it appears on paper.
Both are two-bedroom, one-bathroom layouts with a dumbbell configuration, and their overall design is almost identical. Skye at Holland carves out a small dining corner off the living space, while at One Holland Village Residences, the dining is positioned closer to the living area. The main differentiator is the balcony: OHV offers a larger outdoor space with folding doors that allow the living area to extend outside, whereas Skye’s balcony is smaller with a standard sliding partition. Both projects include Jack and Jill bathrooms, which improve accessibility.
Neither layout is decisively better than the other though. Given how similar they are, Skye at Holland could have the advantage here – if it presents a lower price than One Holland’s resale two-bedders.

The three-bedders at One Holland Village Residences are much larger than those at Skye at Holland; even setting aside GFA harmonisation, the size gap remains tangible.
Both are three-bedroom, two-bathroom layouts, but Skye’s use of a Jack and Jill arrangement effectively creates two ensuite bedrooms. At One Holland, only the master is ensuite. In both projects, the living and dining areas are well segregated, and all bedrooms can comfortably fit double beds.
One Holland has a balcony that extends across the living room and an adjacent bedroom; and with folding doors, it can function as an outdoor dining space while freeing up the original dining area as a study.
One Holland also has an enclosed kitchen with a utility and WC, giving it more functionality than Skye’s simpler layout.
Even so, Skye at Holland’s design remains practical, and its pricing is significantly lower. Buyers who emphasise absolute size may still go for One Holland; but Skye at Holland presents a more affordable alternative, and can capture buyers who find One Holland’s pricing less palatable.

The four-bedroom unit at One Holland Village Residences is a lot larger, even setting aside GFA harmonisation. Skye offers a four-bedroom, two-bathroom layout, while One Holland provides three bathrooms plus a powder room. Both come with private lifts.
Skye has a conventional arrangement, while One Holland uses a dumbbell design that minimises the need for corridor space. In the kitchen, both projects provide wet and dry areas, along with a yard, WC, and store. However, One Holland’s dry kitchen is more expansive, designed as an island, while Skye’s is a wall-facing counter.
As we’ve seen in previous layouts, One Holland features larger balconies; this one extends from the living room to the junior master and can be accessed from both. Living and dining spaces are side by side at One Holland, while Skye separates them more distinctly.
Both master bedrooms are generously sized, but One Holland’s master bath goes further with a double vanity, bathtub, and separate shower, compared to a standard layout at Skye. This is one area where sheer square footage makes a difference.
The main issue is that One Holland’s four-bedders are almost double the price, so it’s not really a balanced comparison. It comes down to whether you want – or can afford – a much more luxury-oriented unit. Frankly, most buyers are priced out of One Holland’s four-bedders.
Now, let’s look at Sky at Holland’s pricing versus new launches, as of September 2025
Project | Tenure | District | Average $PSF for new sale transactions | Average developer’s profit margin (based on average $PSF) | Average quantum |
Canberra Crescent Residences | 99-year | 27 | $1,985 | 29.25% | $1,615,551 |
Springleaf Residence | 99-year | 26 | $2,176 | 28.90% | $1,847,722 |
Lyndenwoods | 99-year | 5 | $2,462 | – | $2,262,991 |
Bloomsbury Residences | 99-year | 5 | $2,503 | 20.57% | $1,927,345 |
ELTA | 99-year | 5 | $2,548 | 18.18% | $2,090,020 |
Skye At Holland | Starting from $2,598 | ||||
One Marina Gardens | 99-year | 1 | $2,952 | 25.02% | $1,953,295 |
Aurea | 99-year | 7 | $2,964 | – | $3,318,410 |
Promenade Peak | 99-year | 9 | $2,969 | 33.19% | $2,582,522 |
Arina East Residences | Freehold | 15 | $2,983 | 26.29% | $2,541,822 |
River Green | 99-year | 9 | $3,120 | 38.19% | $2,007,283 |
Meyer Blue | Freehold | 15 | $3,230 | – | $3,408,917 |
Upperhouse at Orchard | 99-year | 10 | $3,305 | – | $2,768,831 |
W Residences Marina View | 99-year | 1 | $3,344 | – | $3,417,500 |
The Robertson Opus | 999-year | 9 | $3,356 | – | $2,917,685 |
With an indicative starting psf of $2,598, Skye at Holland is below the average $PSF of most current new launches.
Consider that Upperhouse at Orchard is averaging $3,305 psf, significantly higher than Skye’s entry point. Likewise, other 99-year leasehold launches in the CCR, such as Promenade Peak ($2,969 psf), River Green ($3,120 psf), and W Residences Marina View ($3,344 psf), are all transacting above Skye’s indicative pricing. Of course, we have to again caveat that this is the lowest indicative, and the average pricing at Skye at Holland would likely end up around the $2,900 to $3,000 psf mark.
In any case, it does highlight Skye at Holland’s price point given they don’t push it up too high: for many buyers, it represents a CCR foothold at a lower starting price.
But overall price is what matters more to most buyers, so let’s compare based on quantum next:
Despite being a CCR condo, Skye at Holland’s starting prices are comparable to projects in the RCR and, in some cases, even the OCR.
This is unusual for a D10 launch, where buyers often expect a higher price.
We also see that a handful of other new launches in D10, such as Grange 1866, Boulevard 88, and The Giverny Residences, are all freehold; and they’re positioned at significantly higher $PSF levels:
Project | Tenure | District | Average $PSF for new sale transactions | Average developer’s profit margin (based on average $PSF) | Average quantum |
Skye At Holland | Starting from $2,598 | ||||
Grange 1866 | Freehold | 10 | $3,037 | – | $2,183,916 |
Upperhouse at Orchard | 99-year | 10 | $3,305 | – | $2,768,831 |
Boulevard 88 | Freehold | 10 | $3,711 | – | $8,014,757 |
The Giverny Residences | Freehold | 10 | – | – | – |
Compared to the other ongoing launches in D10, Skye at Holland has the lowest $PSF when measured by its starting prices.
Some of these neighbouring developments still have a handful of unsold units, but they are positioned at much higher prices. Here are the most affordable options still available in these other projects:
2-bedroom units
Project | Tenure | District | 2-bedroom prices |
Skye At Holland | 99-year | District 10 | $1,510,000 |
Grange 1866 | Freehold | District 10 | $2,285,000 |
Upperhouse at Orchard | 99-year | District 10 | $2,303,000 |
Boulevard 88 | Freehold | District 10 | $4,811,100 |
3-bedroom units
Project | Tenure | District | 3-bedroom prices |
Skye At Holland | 99-year | District 10 | $2,400,000 |
The Giverny Residences | Freehold | District 10 | $5,497,000 |
Boulevard 88 | Freehold | District 10 | $7,061,000 |
4-bedroom units
Project | Tenure | District | 4-bedroom prices |
Skye At Holland | 99-year | District 10 | $3,340,000 |
Upperhouse at Orchard | 99-year | District 10 | $7,054,000 |
The Giverny Residences | Freehold | District 10 | $9,566,000 |
For two-bedders, Skye starts from $1.51 million – far below Grange 1866 ($2.29 million), Upperhouse at Orchard ($2.30–$3.30 million), and Boulevard 88 at nearly $4.8 million.
In the three-bedder category, Skye’s entry from $2.4 million is again the lowest, compared to $5.5 million at The Giverny Residences and over $7 million at Boulevard 88.
And for four-bedders, Skye starts at $3.34 million, while comparable units at Upperhouse begin from about $7 million, and The Giverny Residences from nearly $9.6 million.
Now let’s look at whether Skye at Holland is priced right for its given area, based on surrounding demographics
We’ll go into further detail on the area’s HDB upgraders versus those moving from private homes later, in the exit strategy section below. For now, let’s look at who living nearby could plausibly afford, or be enticed, to buy into Skye at Holland:
Existing private property owners
Price range | No. of transactions (done between 2024 and June 2025) |
Under $1M | 21 |
Between $1M – $1.5M | 86 |
Between $1.6M – $2M | 121 |
Between $2.1M – $2.5M | 215 |
Between $2.6M – $3M | 207 |
Between $3.1M – $3.5M | 133 |
Between $3.6M – $4M | 119 |
Between $4.1M – $4.5M | 63 |
Between $4.6M – $5M | 46 |
Above $5M | 175 |

Among existing private property owners, most transactions fell within the $2.1 to $2.5 million range, followed closely by the $2.6 to $3 million bracket.
This lines up with two-bedders and, in some cases, resale three-bedders. Skye at Holland’s starting price of $1.51 million for its two-bedders falls below this range, making it an accessible option even for buyers who might otherwise be stretching into the $2 million bracket.
Skye’s three-bedders, starting from $2.4 million, sit squarely within the sweet spot for this buyer pool, so we would expect good demand.
HDB upgraders
Price range | No. of transactions (done between 2024 to June 2025) |
Under $1M | 6 |
Between $1M – $1.5M | 31 |
Between $1.6M – $2M | 28 |
Between $2.1M – $2.5M | 43 |
Between $2.6M – $3M | 39 |
Above $3M | 38 |

For HDB upgraders, the bulk of transactions in D10 also fell within the $2.1 to $2.5 million range, with $2.6 to $3 million units coming in a close second. This mirrors the existing private property owners, so we can say the demand is more or less concentrated in this price band.
This makes Skye’s three-bedders, which start from $2.4 million, especially well targeted in terms of pricing. While its two-bedders (starting from $1.51 million) are an easy reach for many upgraders, we’re not sure if HDB upgraders – who are mainly family buyers – will be willing to settle for the size reduction. For reference, the typical 4-room flat is around 960 to 1,000 sq ft.
Now let’s look at supply and demand levels in D10, and how they might affect Skye at Holland on exit
Here’s what the supply of condo units in Singapore looks like at the moment:
Bedrooms | CCR | RCR | OCR |
1BR | 18% | 17% | 9% |
2BR | 28% | 30% | 24% |
3BR | 36% | 43% | 52% |
4BR | 17% | 9% | 13% |
5BR | 1% | 1% | 2% |
Three-bedders are the most abundant units, being the most common size of private non-landed homes; so it’s not surprising that more than half the OCR is made up of these.
In contrast, the CCR (where D10 sits) shows a much higher proportion of one and two-bedders: 46 per cent combined versus just 33 per cent in the OCR.
No. of bedrooms | 1BR | 2BR | 3BR | 4BR | 5BR |
Percentage in D10 | 7% | 6% | 4% | 3% | 0% |
In District 10 overall, three-bedders make up the largest share of supply, with two-bedders next in line – a pattern that mirrors the broader CCR.
But when we zoom in on Holland V, there are actually more two-bedders than three-bedders. Four-bedders are in shorter supply, and five-bedders are virtually non-existent.
This is advantageous for Skye At Holland, which offers a full spread of unit types. It caters to the demand for two- and three-bedders that dominate the area, but also introduces five-bedders.
Here’s a look at Skye’s unit mix:
Unit type | Estimated size (sqft) | Number of units | Unit breakdown |
2 Bedroom | 581 | 74 | |
2 Bedroom Premium | 667 – 678 | 148 | |
2 Bedroom Premium + Study | 732 – 743 | 148 | 55.56% |
3 Bedroom | 915 | 74 | |
3 Bedroom Premium | 1,076 | 74 | 22.22% |
4 Bedroom (with private lift) | 1,238 | 74 | |
4 Bedroom Premium (with private lift) | 1,464 | 37 | 16.67% |
5 Bedroom Premium (with private lift) | 1,765 | 37 | 5.56% |
Skye at Holland’s unit mix mirrors the unit supply we see in the surrounding area, where two- and three-bedders dominate, while larger formats are much less common. Overall, the price point and unit mix are well-aligned with potential buyers in the area; both for HDB upgraders and those moving from private.
Now let’s look at possible exit strategies for Skye at Holland
We’ll do this by looking at those who bought in D10 in recent years. We’ll examine the properties that buyers previously owned, before they purchased condos in the district. This gives us a clearer sense of whether future resale demand is more likely to come from HDB upgraders, existing condo owners in other areas, or buyers moving laterally within the CCR.
Year | HDB | Unknown | Private | % HDB Upgraders | % of existing private property owners |
2020 | 145 | 103 | 707 | 15% | 74% |
2021 | 304 | 204 | 1587 | 15% | 76% |
2022 | 271 | 182 | 1331 | 15% | 75% |
2023 | 236 | 103 | 903 | 19% | 73% |
2024 | 136 | 21 | 839 | 14% | 84% |
The data shows that most D10 buyers are existing private property owners, making up roughly three-quarters of purchases in recent years.
HDB upgraders form a smaller share, typically between 14 and 19 per cent. So while there’s some upgrader demand in D10, exit strategies should be targeted more at existing private home owners.
Next, we’ll examine how profitable each unit type has been in the resale market across D10.
This will give us a sense of what to expect, when the units of various sizes are sold later on.
Year | 1-bedroom average $PSF | 2-bedroom average $PSF | 3-bedroom average $PSF | 4-bedroom average $PSF | 5-bedroom average $PSF |
2014 | $1,904 | $1,611 | $1,586 | $1,859 | $1,249 |
2015 | $1,784 | $1,585 | $1,633 | $2,006 | $1,834 |
2016 | $1,779 | $1,653 | $1,855 | $1,772 | $2,706 |
2017 | $1,819 | $1,837 | $1,819 | $1,963 | $2,059 |
2018 | $1,846 | $1,778 | $1,892 | $2,024 | $2,429 |
2019 | $1,887 | $1,814 | $1,816 | $2,366 | $1,888 |
2020 | $1,788 | $1,760 | $1,771 | $2,207 | $1,902 |
2021 | $1,896 | $1,873 | $1,918 | $2,283 | $1,932 |
2022 | $1,984 | $2,076 | $2,154 | $2,535 | $2,371 |
2023 | $2,175 | $2,257 | $2,155 | $2,511 | $2,181 |
2024 | $2,225 | $2,557 | $2,180 | $2,316 | $2,054 |
Annualised | 1.57% | 4.73% | 3.23% | 2.22% | 5.10% |
Over the last 10 years, five-bedders in District 10 recorded the strongest annualised growth, with two-bedders close behind.
In contrast, one- and four-bedders saw much more modest appreciation during the same period.
Now let’s zero in further, and examine the profitability of units close to Skye at Holland.
For consistency, we’re only including transactions where the units were purchased from 2014 onwards and sold between 2024 and June 2025.
2-bedroom units
Gains
Project | Average purchase price | Average sale price | Average gains | Average ROI | Average holding period (years) | No. of transactions |
HOLLAND RESIDENCES | $1,818,000 | $2,138,000 | $320,000 | 17.60% | 7.06 | 1 |
THE MERASAGA | $1,550,000 | $2,050,000 | $500,000 | 32.26% | 3.76 | 1 |
LEEDON 2 | $1,120,000 | $1,668,000 | $548,000 | 48.93% | 7.28 | 1 |
Average/total | $1,496,000 | $1,952,000 | $456,000 | 32.93% | 6.03 | 3 |
Losses
Project | Average purchase price | Average sale price | Average gains | Average ROI | Average holding period (years) | No. of transactions |
MOOI RESIDENCES | $1,580,000 | $1,440,000 | -$140,000 | -8.86% | 3.0 | 1 |
Average/total | $1,580,000 | $1,440,000 | -$140,000 | -8.86% | 3.0 | 1 |
Resale performance for two-bedroom units has been mixed. Holland Residences, The Merasaga, and Leedon 2 all recorded gains, averaging around $456,000 or a 32.9 per cent ROI, though each case involved just a single transaction.
One outlier, a two-bedder resale at Mooi Residences, resulted in a loss of about $140,000; but we can’t read too much into this market quirk.
Skye at Holland’s indicative starting price of $1.51 million is lower than most of these transactions, aside from Mooi Residences.
3-bedroom units
Gains
Project | Average purchase price | Average sale price | Average gains | Average ROI | Average holding period (years) | No. of transactions |
ONE HOLLAND VILLAGE RESIDENCES | $4,190,911 | $4,680,000 | $489,089 | 11.67% | 2.07 | 1 |
HOLLAND RESIDENCES | $2,490,000 | $3,060,000 | $570,000 | 22.89% | 7.25 | 1 |
THE MERASAGA | $2,180,000 | $2,700,000 | $520,000 | 23.85% | 6.67 | 1 |
YGK GARDEN | $3,025,000 | $4,480,000 | $1,455,000 | 48.10% | 7.49 | 1 |
Average/total | $2,971,478 | $3,730,000 | $758,522 | 26.63% | 5.87 | 4 |
For three-bedders, all the recorded transactions in nearby projects over the past 18 months were profitable, with average gains of about $759,000 (26.6 per cent ROI).
YGK Garden saw the highest uplift at $1.45 million, while even the shortest-held unit – a sub sale at One Holland Village Residences – still achieved a gain.
Compared to these projects, Skye at Holland’s indicative starting price of $2.4 million is notably lower, though this also reflects its smaller unit sizes. As with the two-bedders, the limited sample size makes it difficult to draw broad conclusions, but the trend suggests three-bedders in this area generally do well.
4-bedroom units
Gains
Project | Average purchase price | Average sale price | Average gains | Average ROI | Average holding period (years) | No. of transactions |
PARVIS | $3,784,444 | $4,920,000 | $1,135,556 | 30.18% | 7.8 | 2 |
Average/total | $3,784,444 | $4,920,000 | $1,135,556 | 30.18% | 7.8 | 2 |
For four-bedders, the only available data comes from Parvis, where two transactions averaged gains of about $1.14 million over a holding period of almost eight years. Skye at Holland’s indicative starting price of $3.34 million is lower than these, though Parvis units are notably larger.
Taken together, the limited data suggest that two-bedders have achieved the highest average ROI, followed by four-bedders and then three-bedders.
However, the very low transaction volumes across projects mean these figures may not be fully representative of wider trends. What we can observe is that most profitable units were held for a longer period, and that many of the nearby developments are freehold.
Exit strategy considerations:
Resale demand in District 10 is dominated by existing private property owners, who typically account for three-quarters of purchases. HDB upgraders form a smaller but steady minority, around 15 to 20 per cent in recent years. This suggests that resale demand for Skye at Holland will depend more on repeat private owners than on first-time upgraders.
This suggests that resale demand for Skye at Holland will depend more on repeat private owners, than on first-time upgraders.
Unit type also matters. Two- and three-bedders have historically drawn the most consistent demand in District 10, reflecting investor appeal and family use, respectively. Four- and five-bedders are less common in Holland Village, which creates scarcity value even though the quantum is higher. Skye’s mix leans heavily toward smaller formats but also introduces larger ones, giving it coverage across the spectrum.
The local supply picture reinforces this. In Holland Village, two-bedders outnumber three-bedders, while four-bedders are relatively scarce and five-bedders are almost non-existent. Skye at Holland matches this pattern, offering a broad spread of smaller units while plugging the gap for larger families.
As for how units have actually fared, transaction records in surrounding projects seem solid: resale activity has generally resulted in positive outcomes for sellers, with losses confined to rare outliers.
This doesn’t change the fact that transaction volumes are, in some cases, lower than we’d like, but this is an inevitable fact in boutique-heavy Holland V.
Conclusion
Skye at Holland demonstrates an ongoing trend that we’ve seen in the CCR: developers are avoiding building oversized super-luxury units today, and instead are focusing on compact but more efficient units, with a lower overall quantum.
So even though Skye at Holland’s indicative starting $PSF of $2,598 ranks high for the area, its overall quantum is on the lower end. This makes it a surprisingly affordable project considering it’s a new launch in D10.
On the resale front, the closest comparable is One Holland Village Residences, as it is also new and just next door. With just one sub-sale so far, the data is too limited to reveal much for now. But based on new sale prices, One Holland Village Residences sits higher across all unit types.
What matters is that both groups are most active in the $2.1 million to $2.5 million price bracket
In addition, the buyer pool in D10 is still dominated by existing private property owners, though there is a steady stream of HDB upgraders. What matters is that both groups are most active in the $2.1 million to $2.5 million price bracket – a sweet spot that aligns with Skye at Holland’s two- and three-bedders.
All in, Skye At Holland distinguishes itself in D10 with competitive pricing (again, assuming that prices are not staged up too aggressively), and this will interest anyone who’s been waiting for a shot at a CCR address.
For more pricing reviews for new launches, follow us on Stacked Pro. If you’d like to get in touch for a more in-depth consultation, you can do so here.
Ryan J
A seasoned content strategist with over 17 years in the real estate and financial journalism sectors, Ryan has built a reputation for transforming complex industry jargon into accessible knowledge. With a track record of writing and editing for leading financial platforms and publications, Ryan's expertise has been recognised across various media outlets. His role as a former content editor for 99.co and a co-host for CNA 938's Open House programme underscores his commitment to providing valuable insights into the property market.Read next from New Launch Condo Analysis

Property Investment Insights Are Older One- and Two-Bedders in District 10 Holding Up Against the New Launches? We Break It Down

Property Investment Insights Old vs New Family-Sized Condos in District 9: A Data-Driven Analysis of Value in 2025

Property Investment Insights Are Older One- and Two-Bedders in District 9 Holding Up Against the New Launches? We Break It Down

New Launch Condo Analysis Queenstown’s First New Launch In 7 Years Comes With Full Facilities — Even With Just 462 Units
Latest Posts

On The Market Three Rare Bungalows With Unique Design Hit The Market For $13.98m – Each With Over 9,300 Sq Ft Of Space

Editor's Pick Why I Sold My 40-Year-Old Jurong Flat For A Newer Bukit Panjang One: A Buyer’s Case Study

Editor's Pick 5 Ways To Get A Better Price For Your Property When The Market Is Changing

Property Market Commentary Are Singapore’s Oldest HDB Flats Finally Losing Value? A 2025 Price Update

Singapore Property News The World’s Real Estate Is Now Worth US$393 Trillion In 2025. Here’s Where Singapore Fits In

Property Trends The Room That Changed the Most in Singapore Homes: What Happened to Our Kitchens?

Editor's Pick We Toured A Unique Landed Street Where No One Has Sold a Property for 14 Years

Singapore Property News Why Old ECs Now Make More Sense Than Million-Dollar Flats

Editor's Pick Skye At Holland Condo Review: Attractive Entry Price To Holland Village From $2,598 PSF

On The Market A Rare 1930s Art Deco Home In Alexandra With 33,000 Sq Ft of Land Is Up For Rent

On The Market The Cheapest 4-Room HDB Flats Still Available Right Now – From $410,000

Property Market Commentary 5 Ways Singapore’s Condo Layouts Have Changed Over The Years (And What We No Longer Value)

Editor's Pick Why These “Ulu” Estates May Be The Next Property Investment Hotspots In Singapore (By 2035)

On The Market 5 Biggest Condos In Singapore You Can Buy Right Now For Less Than $1.8M

Property Advice 5 Telltale Signs to Watch Before Property Prices Move In Singapore
