


On paper, a one-bedder seems like the most obvious choice for a landlord. Its relatively smaller size and corresponding lower price tag doesn’t just mean lower capital commitment; it often means a higher rental yield, lower maintenance, and renovation costs. But today, you’ll hear many more objections to this conventional approach – sometimes directly from property agents.
You’ll be told one-bedders fare much worse in terms of capital gains, are generally tougher to sell, and less versatile as an investment asset. In short, you’ll hear arguments that it’s no longer worth buying a one-bedder, and you may as well stretch the budget a bit to get a two-bedder. To determine if this is true, we examined the rental and resale numbers over the past five years to see if one-bedders still make sense:
Note: The analysis below uses transaction data from 2020 to 28th December 2025.
So many readers write in because they're unsure what to do next, and don't know who to trust.
If this sounds familiar, we offer structured 1-to-1 consultations where we walk through your finances, goals, and market options objectively.
No obligation. Just clarity.
Learn more here.
Let’s begin by looking at average rental rates, in the prime districts where compact units are typically bought for investment
We will only be looking at Districts 1, 9, 10, and 11 because these tend to be popular areas where one and two-bedders are bought as rental assets.
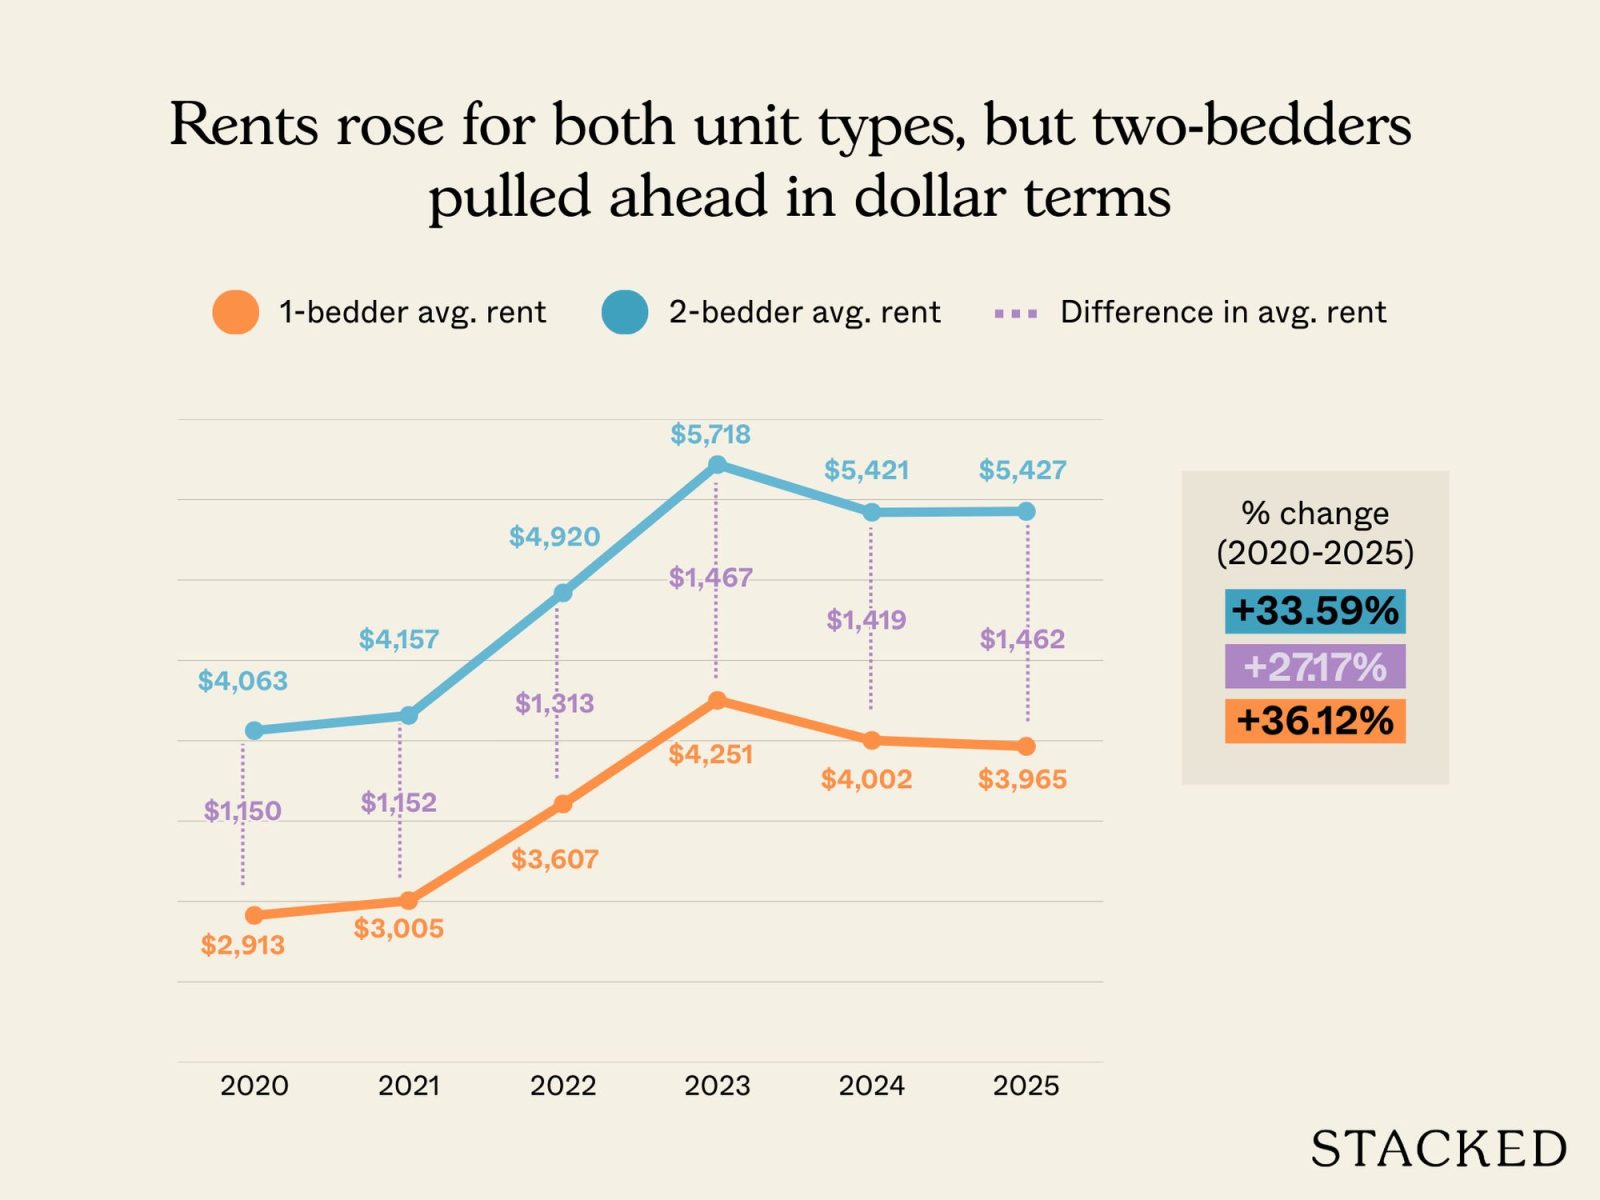
Average rent for 1 and 2-bedders in D1, 9, 10 and 11
| Year | 1-bedder avg rent | 2-bedder avg rent | Difference in avg rent |
| 2020 | $2,913 | $4,063 | $1,150 |
| 2021 | $3,005 | $4,157 | $1,152 |
| 2022 | $3,607 | $4,920 | $1,313 |
| 2023 | $4,251 | $5,718 | $1,467 |
| 2024 | $4,002 | $5,421 | $1,419 |
| 2025 | $3,965 | $5,427 | $1,462 |
| % change from 2020 to 2025 | 36.12% | 33.59% | 27.17% |
At first glance, rental growth for both unit types has been broadly similar over the past five years. One-bedders have outperformed slightly by about 2.5 percentage points, but this gap is quite small; it’s also ultimately an abstraction.
For most investors, the absolute rental amount is probably more important. The monthly rental gap between one- and two-bedders widened from about $1,150 in 2020 to roughly $1,460 in 2025. This is an increase of around 27%. So while one-bedders remain cheaper to enter, two-bedders are pulling ahead in absolute rental income.
Let’s also take a look at rental volumes.
The number of leases signed can also reflect on the demand for either unit type.
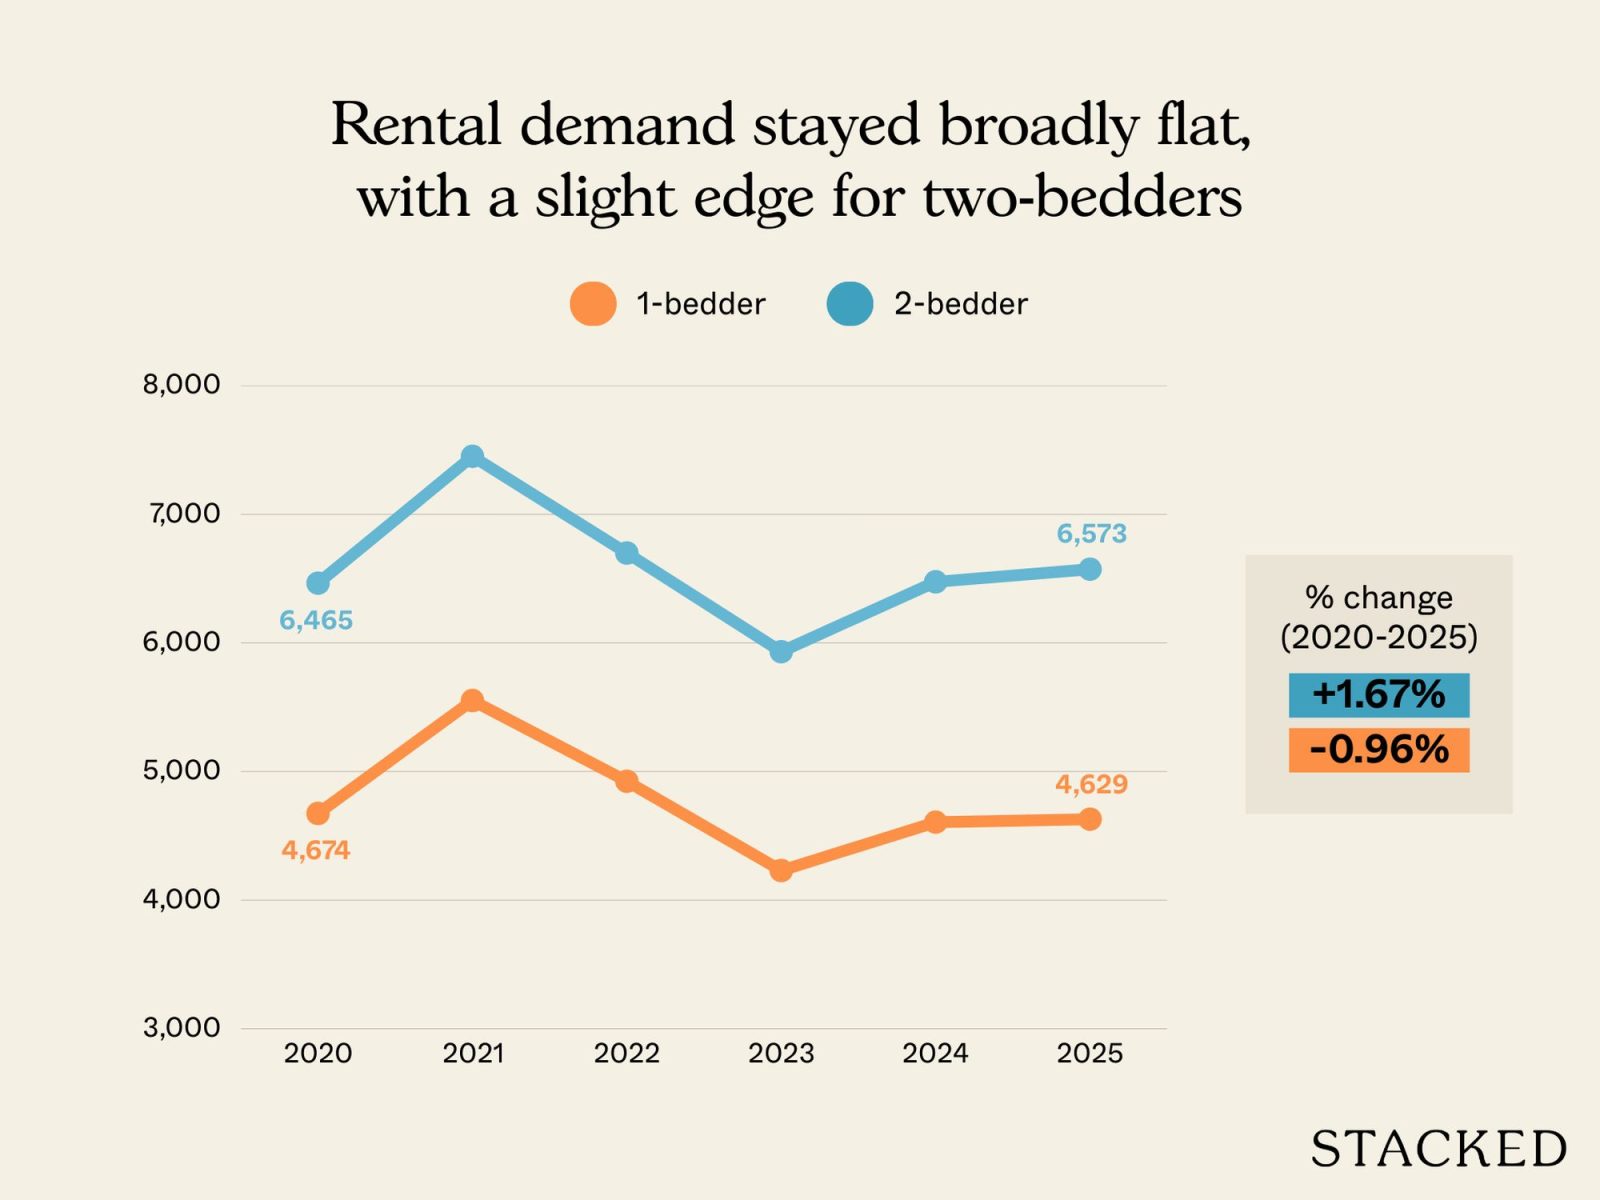
Rental transaction volume
| Year | 1-bedder | 2-bedder |
| 2020 | 4674 | 6465 |
| 2021 | 5552 | 7451 |
| 2022 | 4924 | 6699 |
| 2023 | 4230 | 5932 |
| 2024 | 4606 | 6475 |
| 2025 | 4629 | 6573 |
| % change from 2020 to 2025 | -0.96% | 1.67% |
From 2020 to 2025, the change in one-bedder rental volumes were essentially flat, in fact they dipped marginally by just under 1%. Two-bedders, on the other hand, saw a modest increase of about 1.7% over the same period.
Now we can’t be too quick to jump to conclusions here; it’s possible, for instance, that the lower number of leases signed are just due to longer leases being signed. In this case there could be fewer lease renewals, which makes the volume appear to drop.
However, it could substantiate some of what we hear on the ground, which is that:
- Two-bedders are viable short-term accommodation options for small families who are waiting for their flat or condo to be ready.
- When rental rates are high, tenants sometimes prefer a unit where they can split the cost with a room mate
- Professionals prefer a unit where one room can be used for other purposes like a home office
These factors expand the prospective tenant pool for two-bedders, and may help explain why their rental volumes have held up slightly better.
Next, we take a look at the gross rental yields of one and two-bedders
For reference, gross rental yield = [annual rental income / cost of unit] x100
We will look only at resale units prices. This is to prevent any distortions from developer sales since average sales prices at new launch projects tend to increase over the entire sales period (thus affecting the yield calculation above). In addition, new launches often take more than three years to complete, and there’s nothing to rent out during that time.
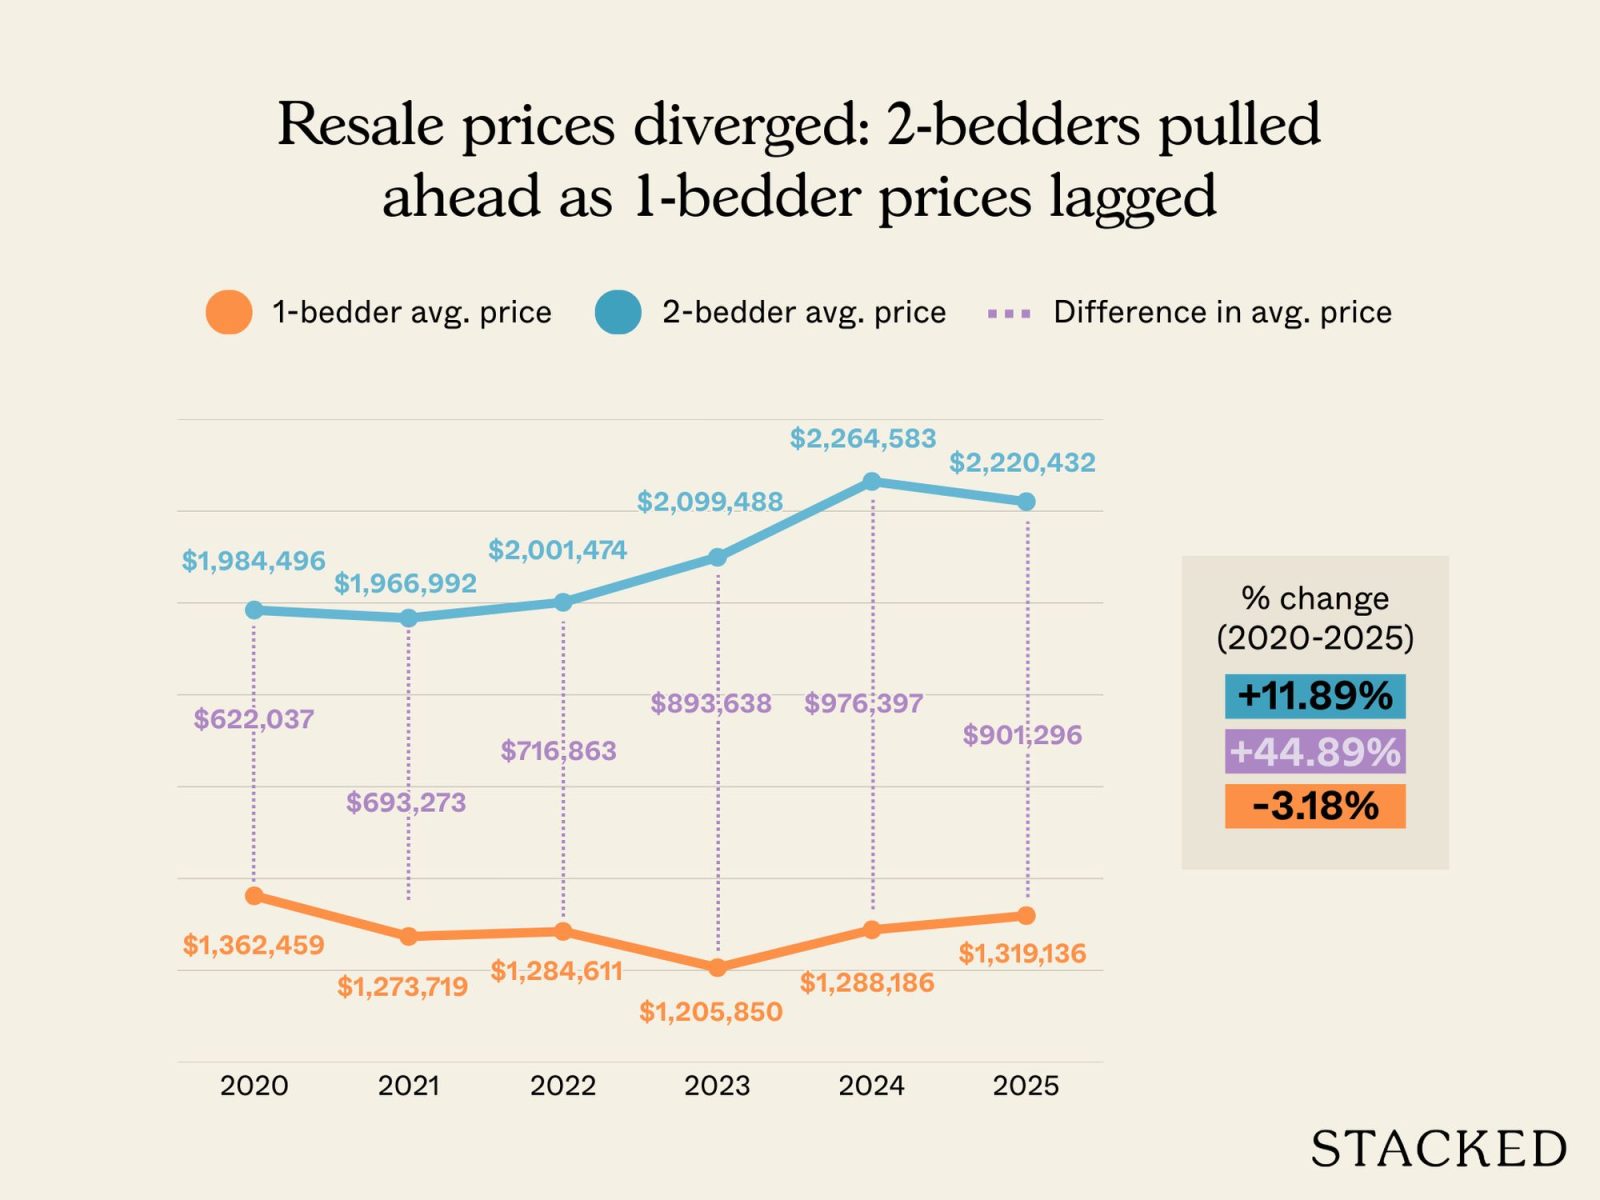
Average resale prices (only includes resale tnx)
| Year | 1-bedder avg price | 2-bedder avg price | Difference in avg price |
| 2020 | $1,362,459 | $1,984,496 | $622,037 |
| 2021 | $1,273,719 | $1,966,992 | $693,273 |
| 2022 | $1,284,611 | $2,001,474 | $716,863 |
| 2023 | $1,205,850 | $2,099,488 | $893,638 |
| 2024 | $1,288,186 | $2,264,583 | $976,397 |
| 2025 | $1,319,136 | $2,220,432 | $901,296 |
| % change from 2020 to 2025 | -3.18% | 11.89% | 44.89% |
Rental yield
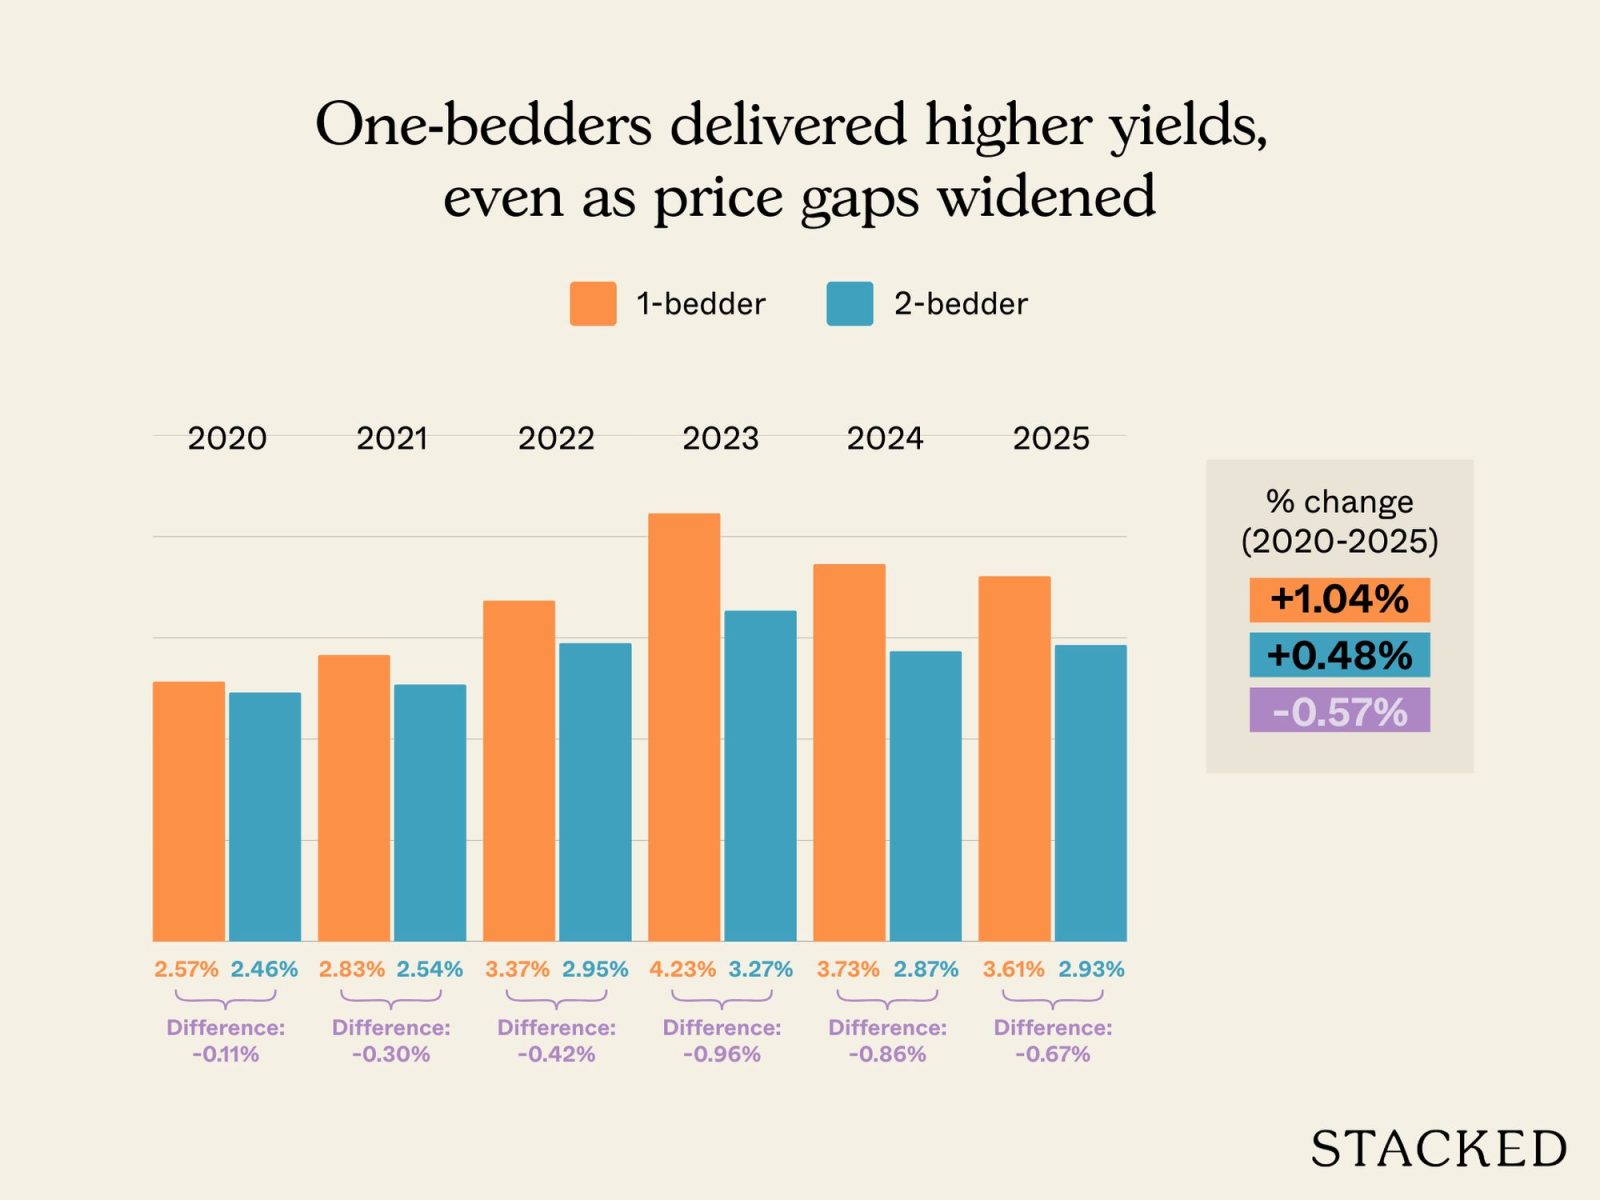
| Year | 1-bedder | 2-bedder | Difference in rental yield |
| 2020 | 2.57% | 2.46% | -0.11% |
| 2021 | 2.83% | 2.54% | -0.30% |
| 2022 | 3.37% | 2.95% | -0.42% |
| 2023 | 4.23% | 3.27% | -0.96% |
| 2024 | 3.73% | 2.87% | -0.86% |
| 2025 | 3.61% | 2.93% | -0.67% |
| % change from 2020 to 2025 | 1.04% | 0.48% | -0.57% |
Over the past five years, we can see that resale prices have dipped for one-bedders, whilst two-bedders have seen better price appreciation. While capital gains are a separate issue from rental yields, this is still an important detail for landlords because when it comes time to exit, a two-bedder might see stronger gains.
This is related to the same factors that make two-bedders more rentable, namely they cater to a larger pool of prospective buyers, whereas one-bedders accommodate a more niche group.
That said, because one-bedders are bought at a lower price compared to two-bedders, rental yields are proportionately higher. The yield advantage was more pronounced in 2022 and 2023, due to the housing shortage in the post Covid-19 pandemic period, but we can see it has moderated in the past two years.
To be specific, let’s look at the numbers in each of our three prime districts
This will give us a sense of whether one- versus two-bedders perform the same way, particularly in these three key districts.
Average rent for 1 and 2-bedders in D1
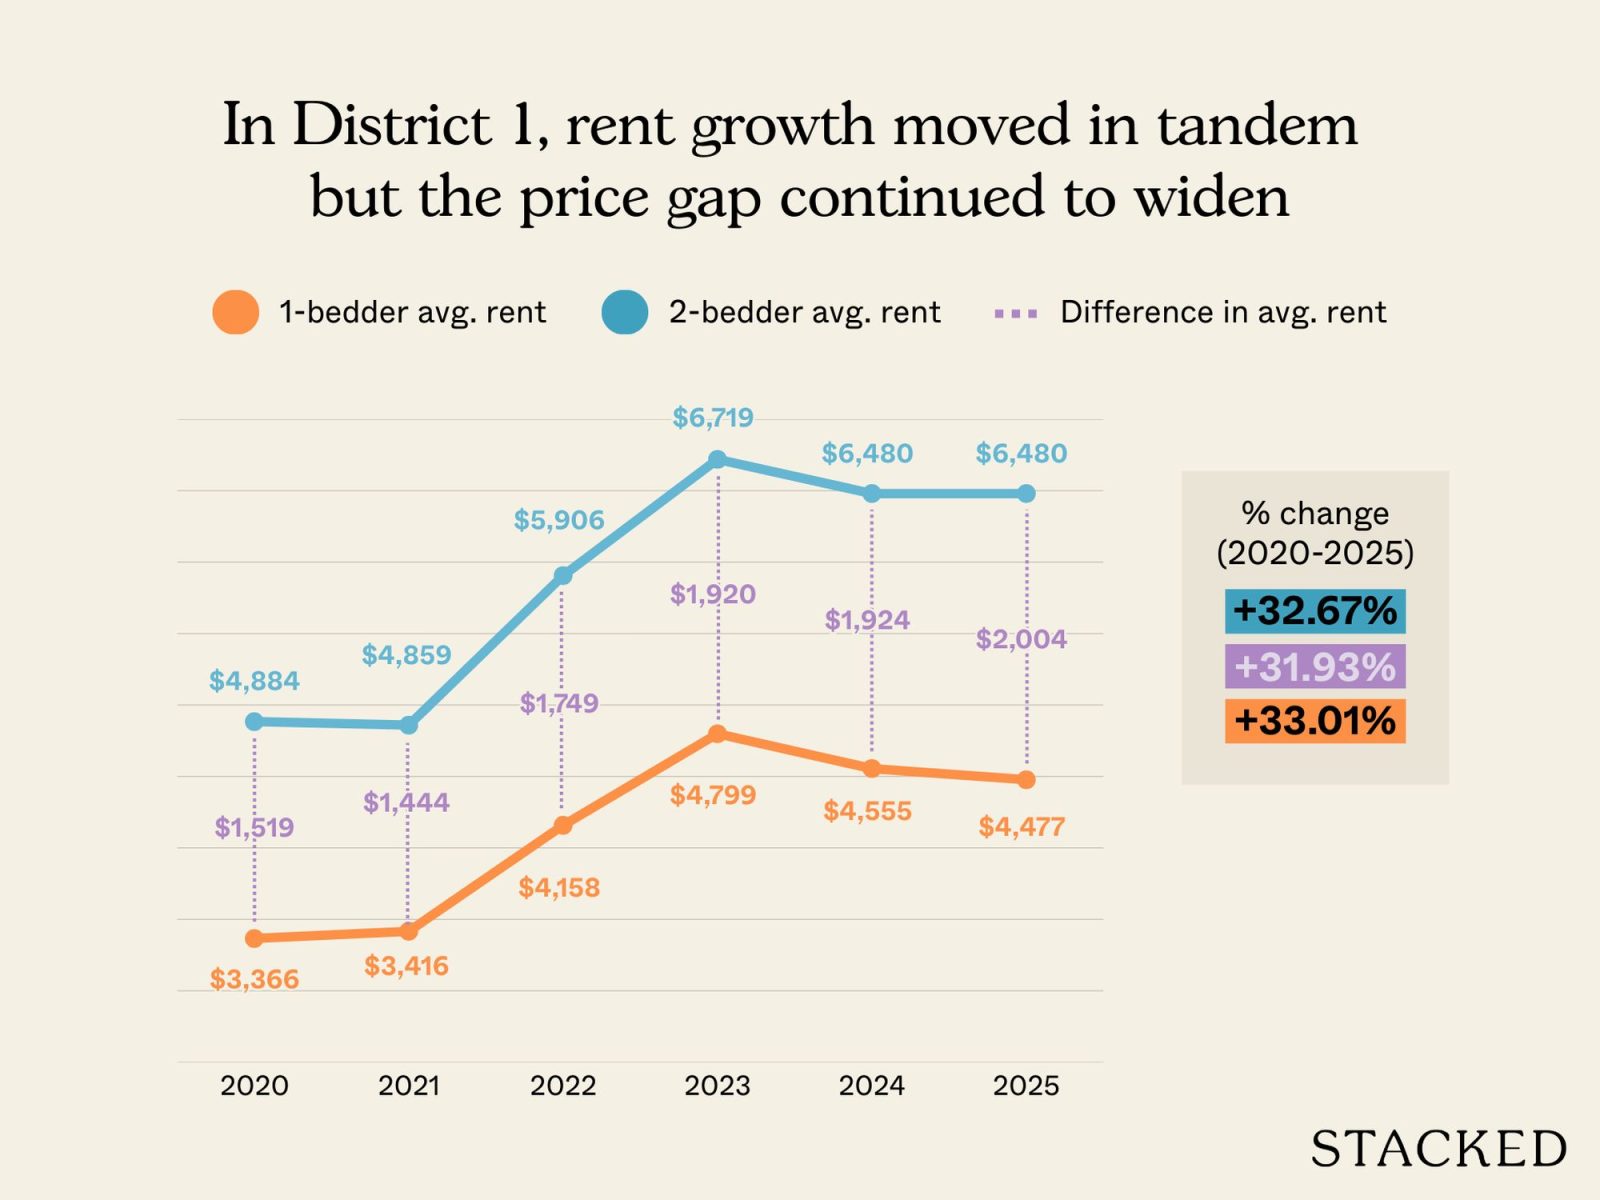
| Year | 1-bedder avg rent | 2-bedder avg rent | Difference in avg rent |
| 2020 | $3,366 | $4,884 | $1,519 |
| 2021 | $3,416 | $4,859 | $1,444 |
| 2022 | $4,158 | $5,906 | $1,749 |
| 2023 | $4,799 | $6,719 | $1,920 |
| 2024 | $4,555 | $6,480 | $1,924 |
| 2025 | $4,477 | $6,480 | $2,004 |
| % change from 2020 to 2025 | 33.01% | 32.67% | 31.93% |
In percentage terms, neither unit type clearly outperformed the other. However, in terms of absolute average yearly rents, the monthly rental gap between one- and two-bedders widened from around $1,520 in 2020 to just over $2,000 by 2025, and that’s an increase of nearly 32%. This mirrors the broader trend seen earlier where the average rent for two-bedders tend to pull ahead.
Rental transaction volume in D1
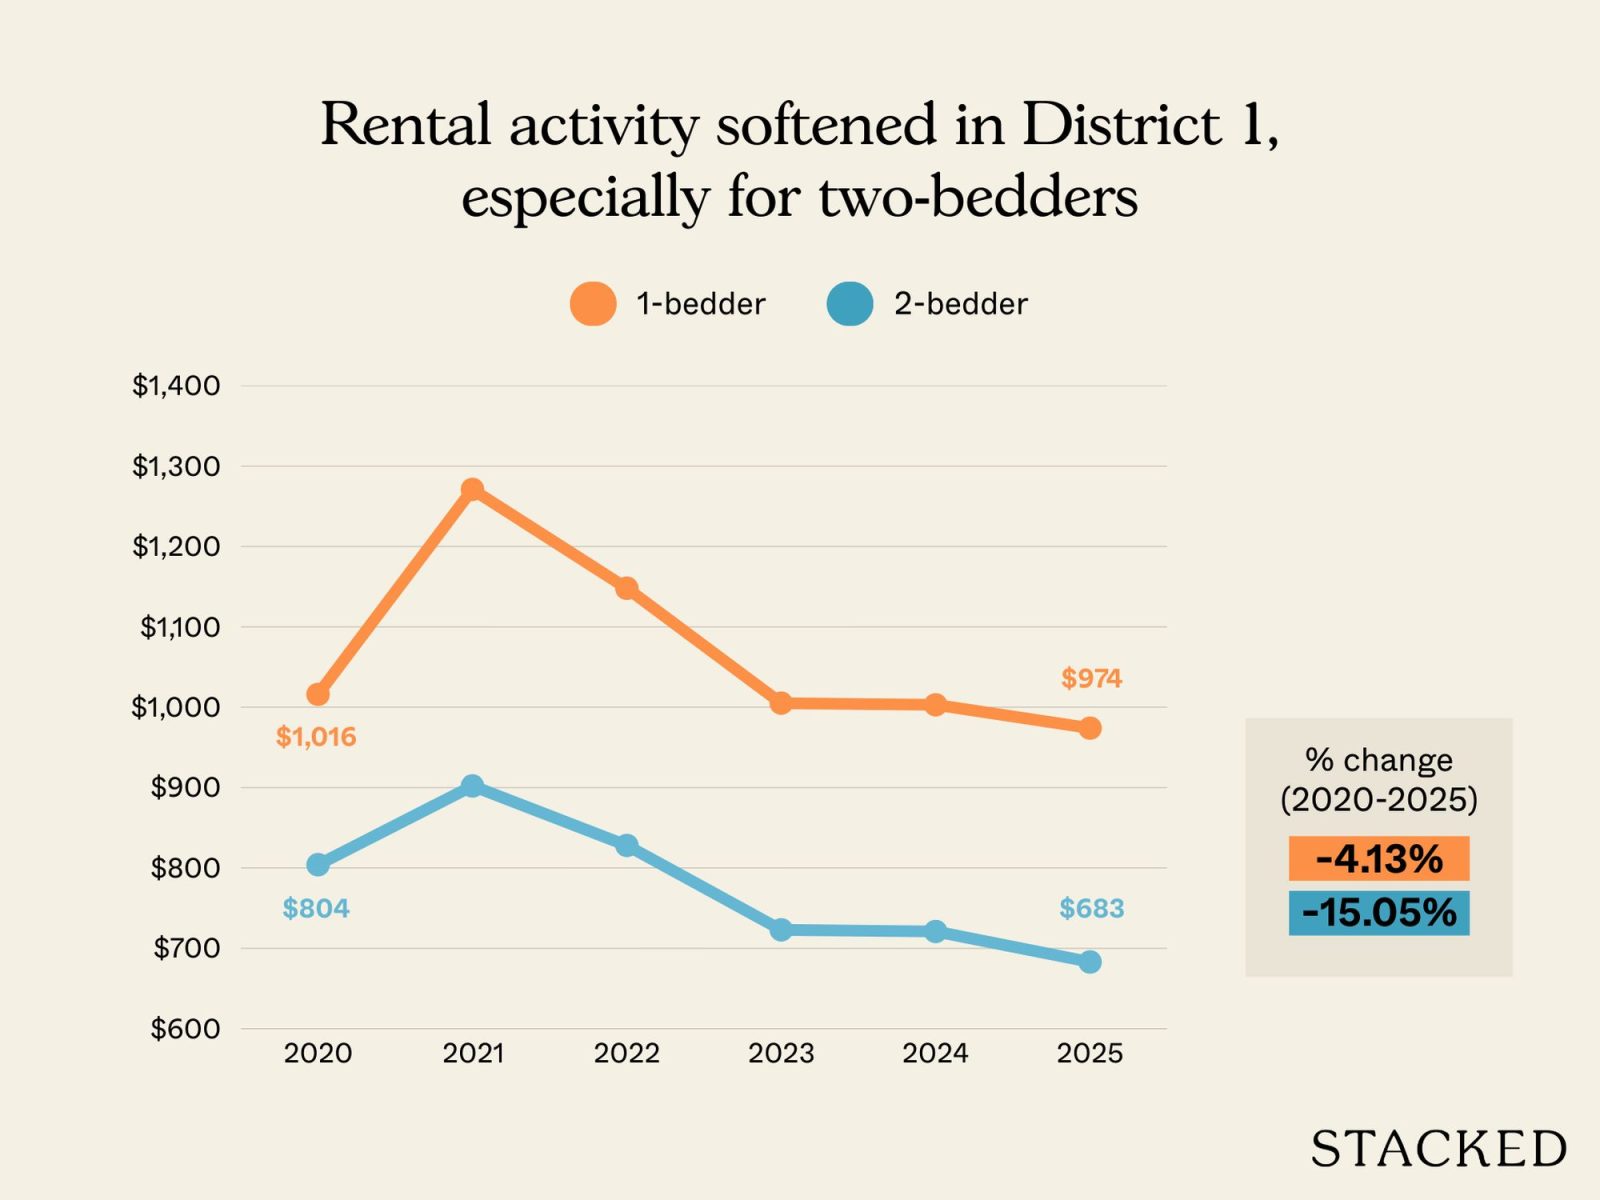
| Year | 1-bedder | 2-bedder |
| 2020 | 1016 | 804 |
| 2021 | 1271 | 902 |
| 2022 | 1148 | 828 |
| 2023 | 1005 | 723 |
| 2024 | 1003 | 721 |
| 2025 | 974 | 683 |
| % change from 2020 to 2025 | -4.13% | -15.05% |
District 1 sees a different pattern in rental volume, compared to the other three districts in our comparison. In District 1, we see that the rental volumes for two-bedders decreased more than compared to one-bedders there.
This could be due to the profile of most projects in District 1, which usually sees a heavier presence of singles and mobile professionals in the rental catchment, rather than couples or young families.
Average resale prices in D1 (only includes resale tnx)
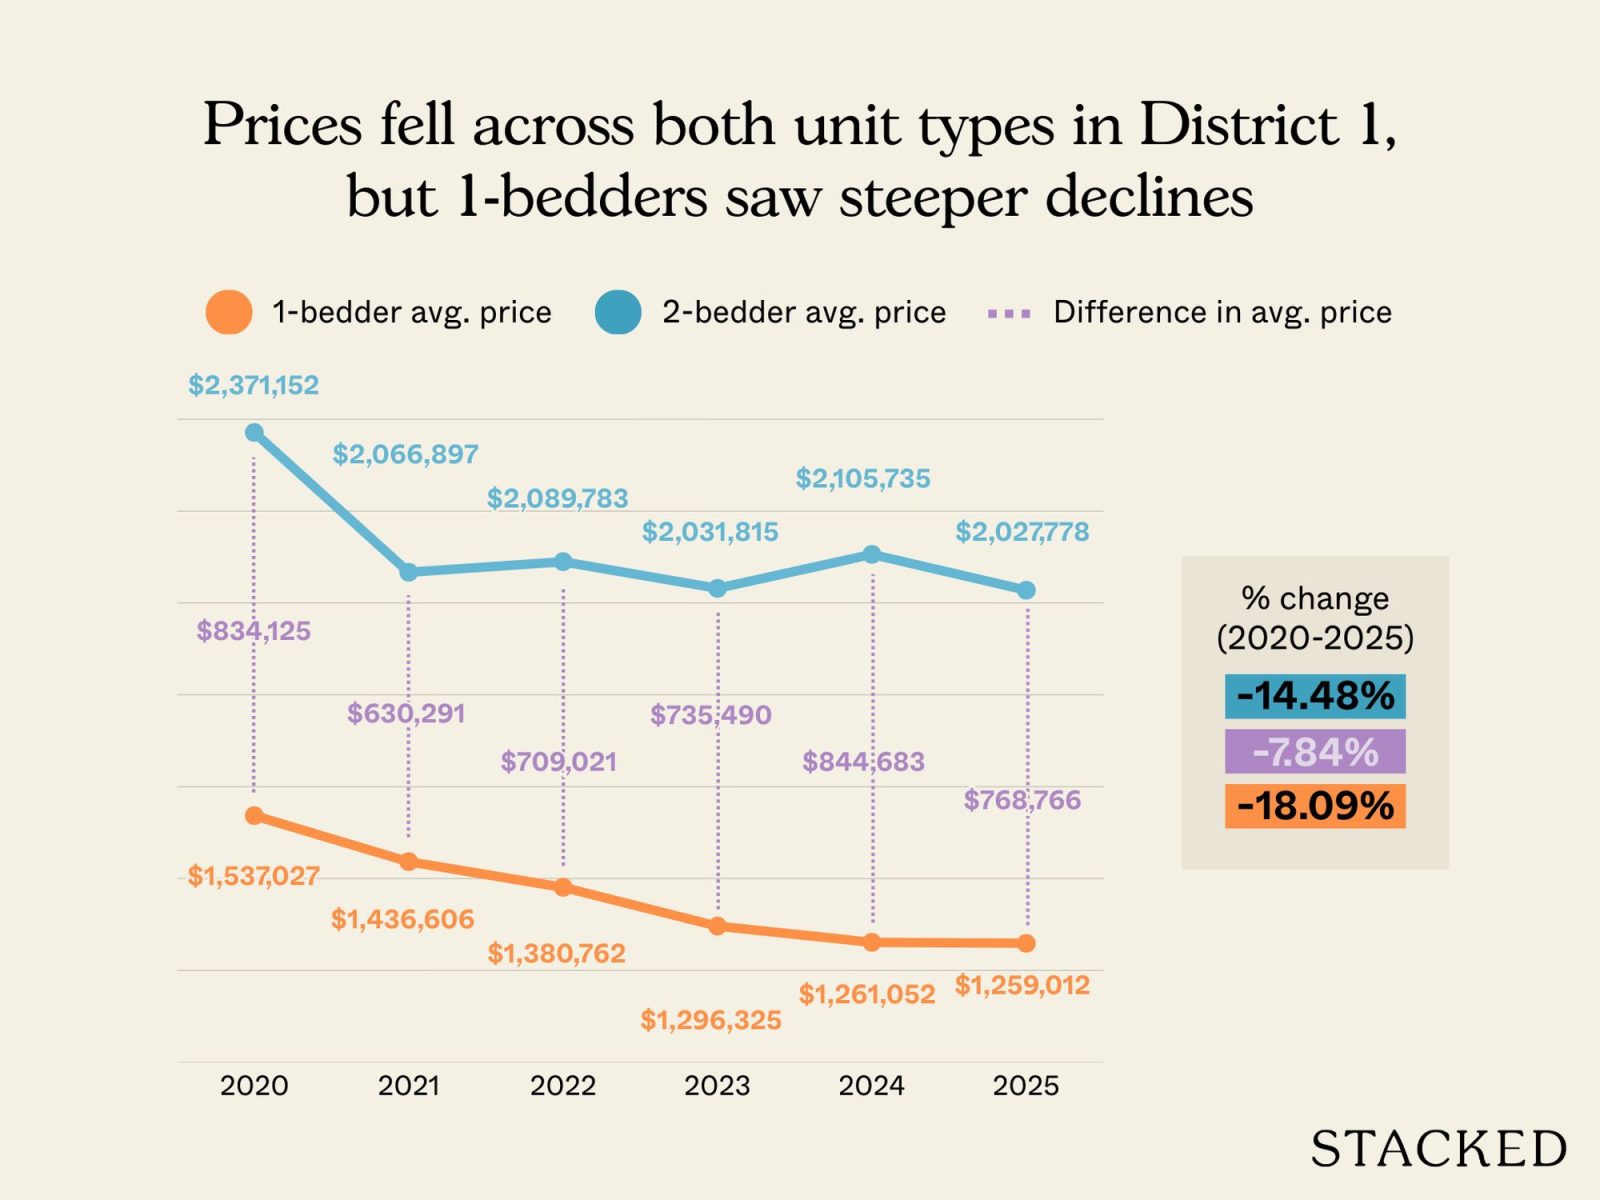
| Year | 1-bedder avg price | 2-bedder avg price | Difference in avg price |
| 2020 | $1,537,027 | $2,371,152 | $834,125 |
| 2021 | $1,436,606 | $2,066,897 | $630,291 |
| 2022 | $1,380,762 | $2,089,783 | $709,021 |
| 2023 | $1,296,325 | $2,031,815 | $735,490 |
| 2024 | $1,261,052 | $2,105,735 | $844,683 |
| 2025 | $1,259,012 | $2,027,778 | $768,766 |
| % change from 2020 to 2025 | -18.09% | -14.48% | -7.84% |
Resale prices in District 1 declined across the board from 2020 to 2025. One-bedders saw a sharper drop of around 18% which fits the wider pattern we saw earlier.
Rental yield in D1
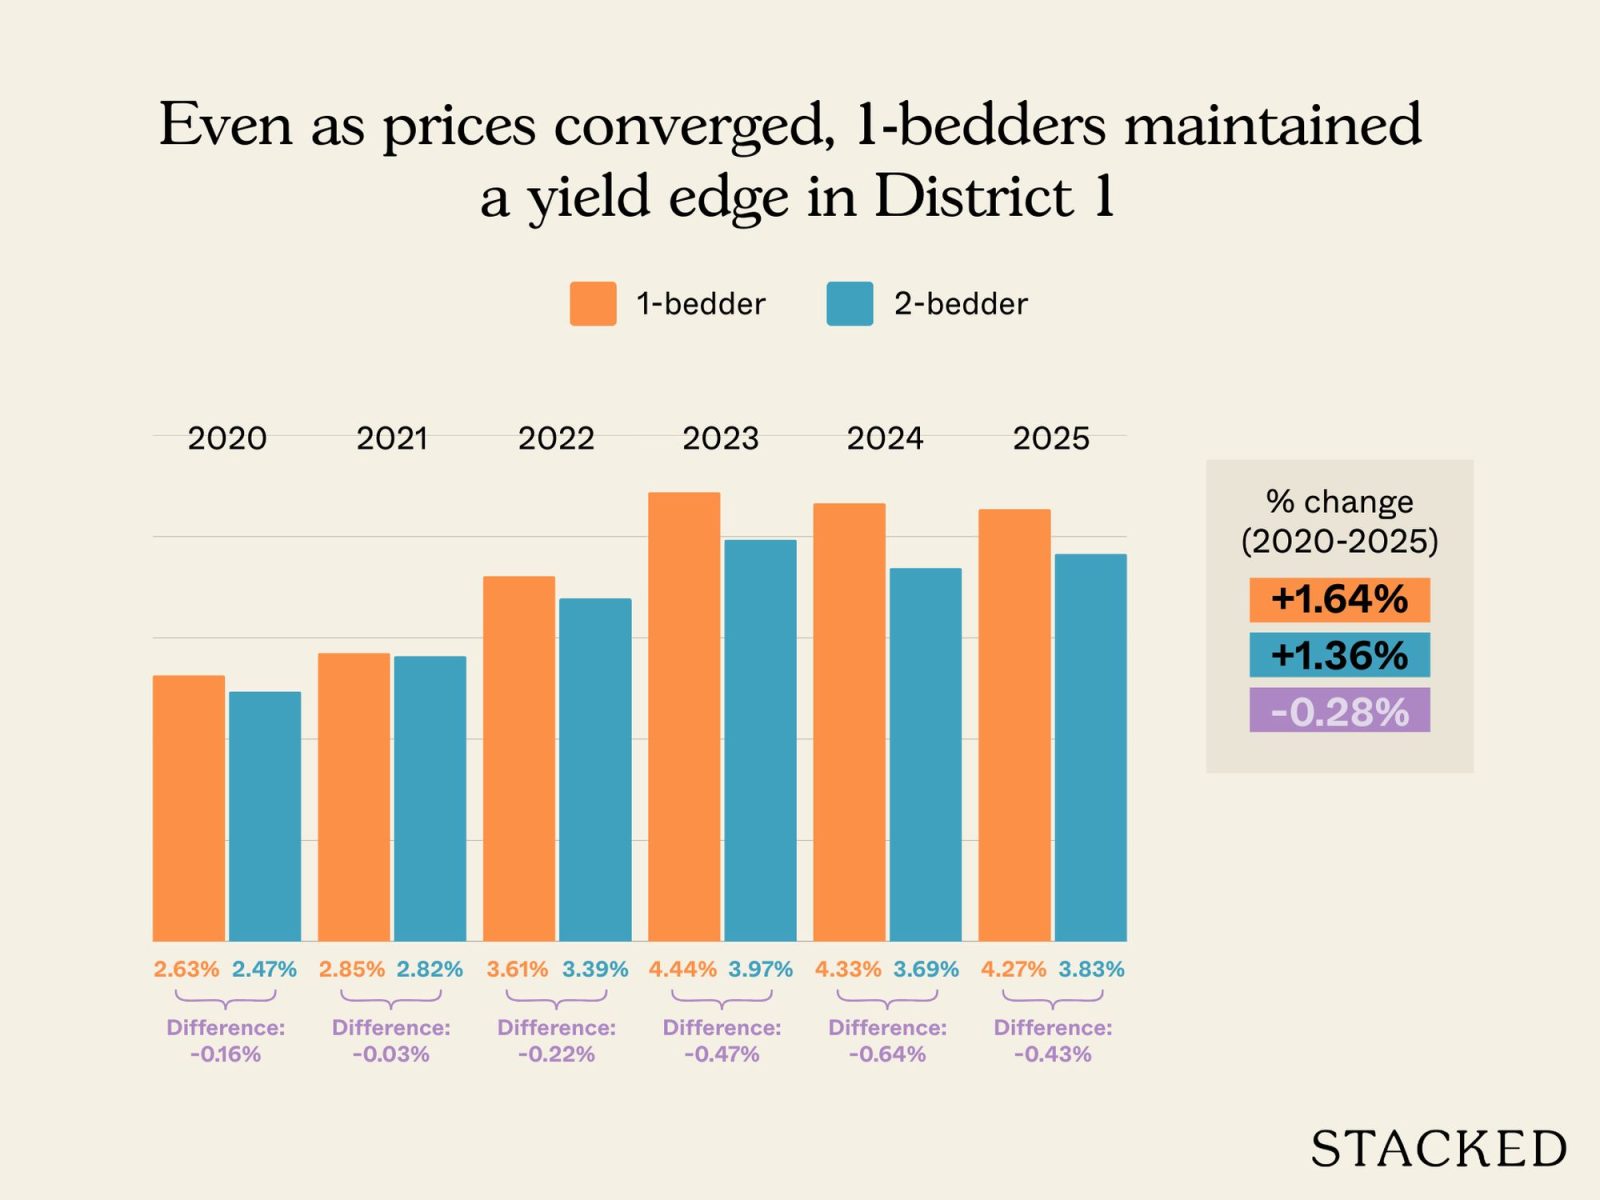
| Year | 1-bedder | 2-bedder | Difference in rental yield |
| 2020 | 2.63% | 2.47% | -0.16% |
| 2021 | 2.85% | 2.82% | -0.03% |
| 2022 | 3.61% | 3.39% | -0.22% |
| 2023 | 4.44% | 3.97% | -0.47% |
| 2024 | 4.33% | 3.69% | -0.64% |
| 2025 | 4.27% | 3.83% | -0.43% |
| % change from 2020 to 2025 | 1.64% | 1.36% | -0.28% |
The difference in yield growth is almost negligible, with one-bedders improving slightly more in percentage terms. However, we do note that the price difference of the one and two-bedders have narrowed, even though the yield gap isn’t too wide. This might tilt more buyers toward the two-bedders.
Now let’s move on to District 9 (D9)
Average rent for 1 and 2-bedders in D9
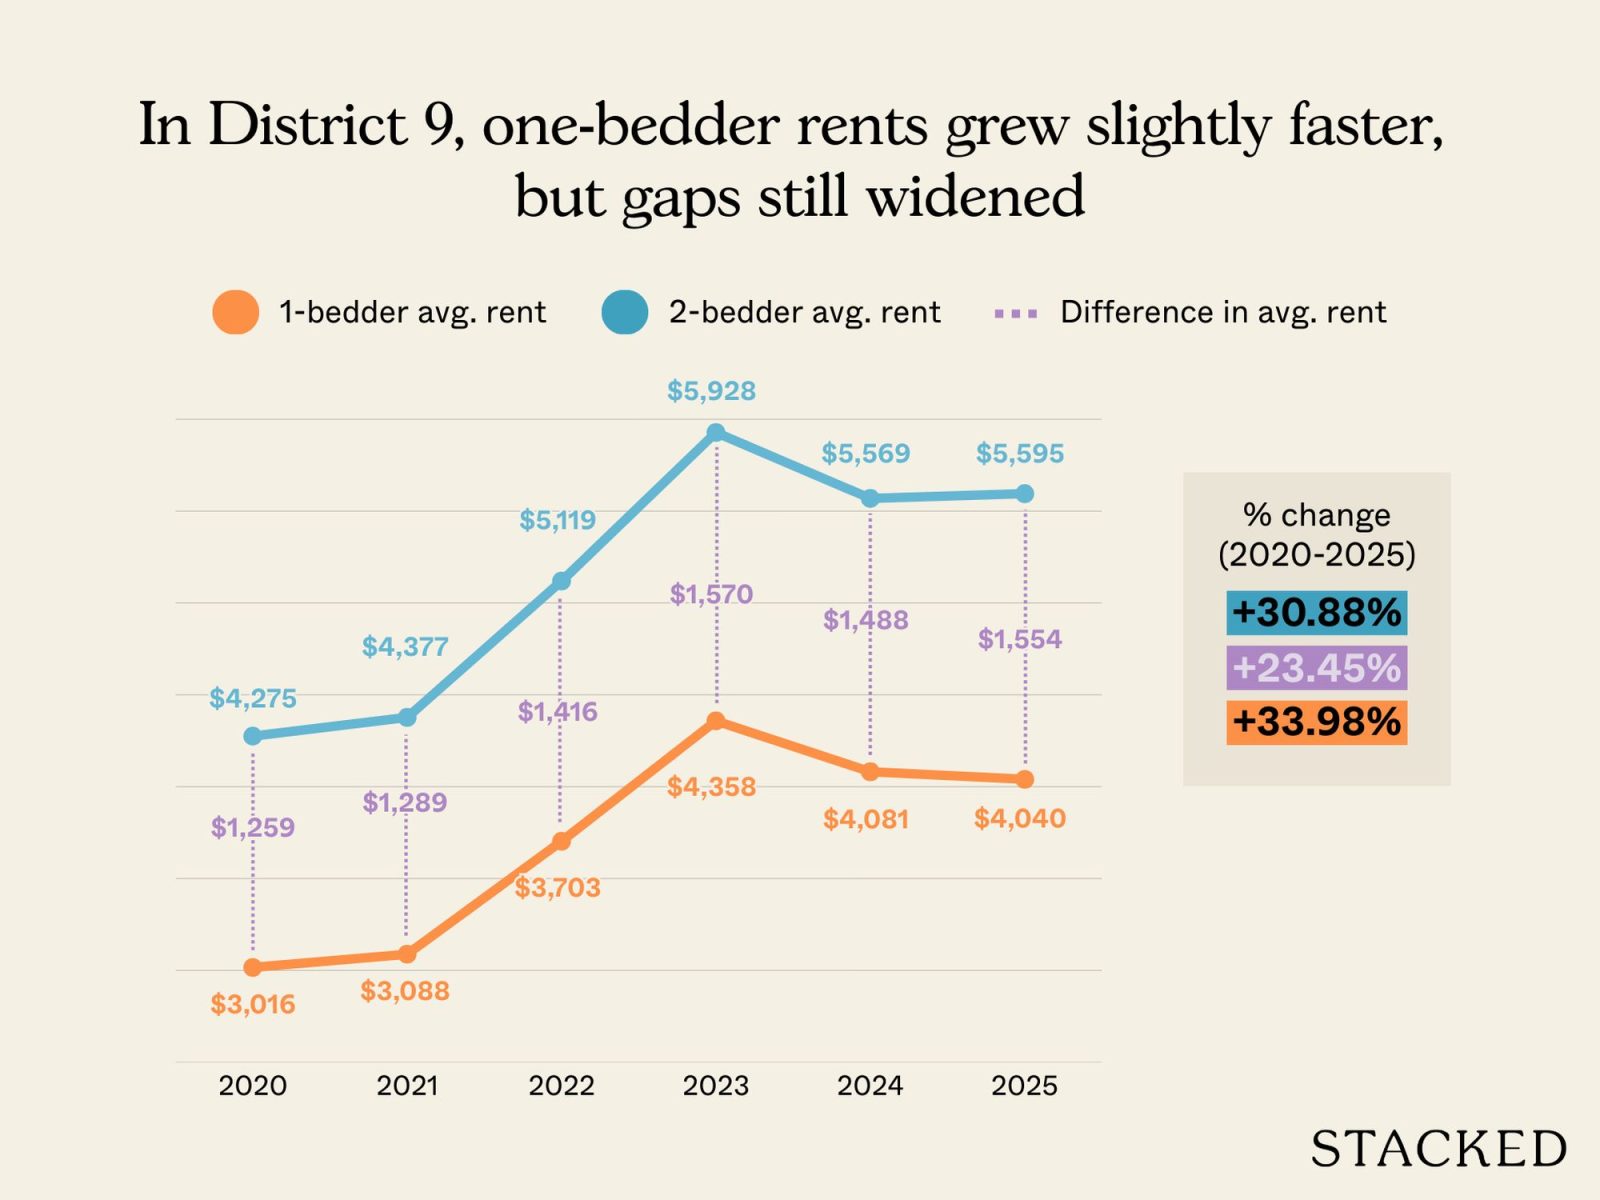
| Year | 1-bedder avg rent | 2-bedder avg rent | Difference in avg rent |
| 2020 | $3,016 | $4,275 | $1,259 |
| 2021 | $3,088 | $4,377 | $1,289 |
| 2022 | $3,703 | $5,119 | $1,416 |
| 2023 | $4,358 | $5,928 | $1,570 |
| 2024 | $4,081 | $5,569 | $1,488 |
| 2025 | $4,040 | $5,595 | $1,554 |
| % change from 2020 to 2025 | 33.98% | 30.88% | 23.45% |
Rental growth over the past five years has also been broadly similar for one- and two-bedders, though one-bedders edged ahead slightly in percentage terms.
As before, the more meaningful trend lies in rental prices. The monthly gap in rents between one- and two-bedders widened from around $1,260 in 2020 to approximately $1,550 by 2025, an increase of about 23%. So even though rental growth rates were close, two-bedders were ahead in dollar terms.
Transaction volume in D9
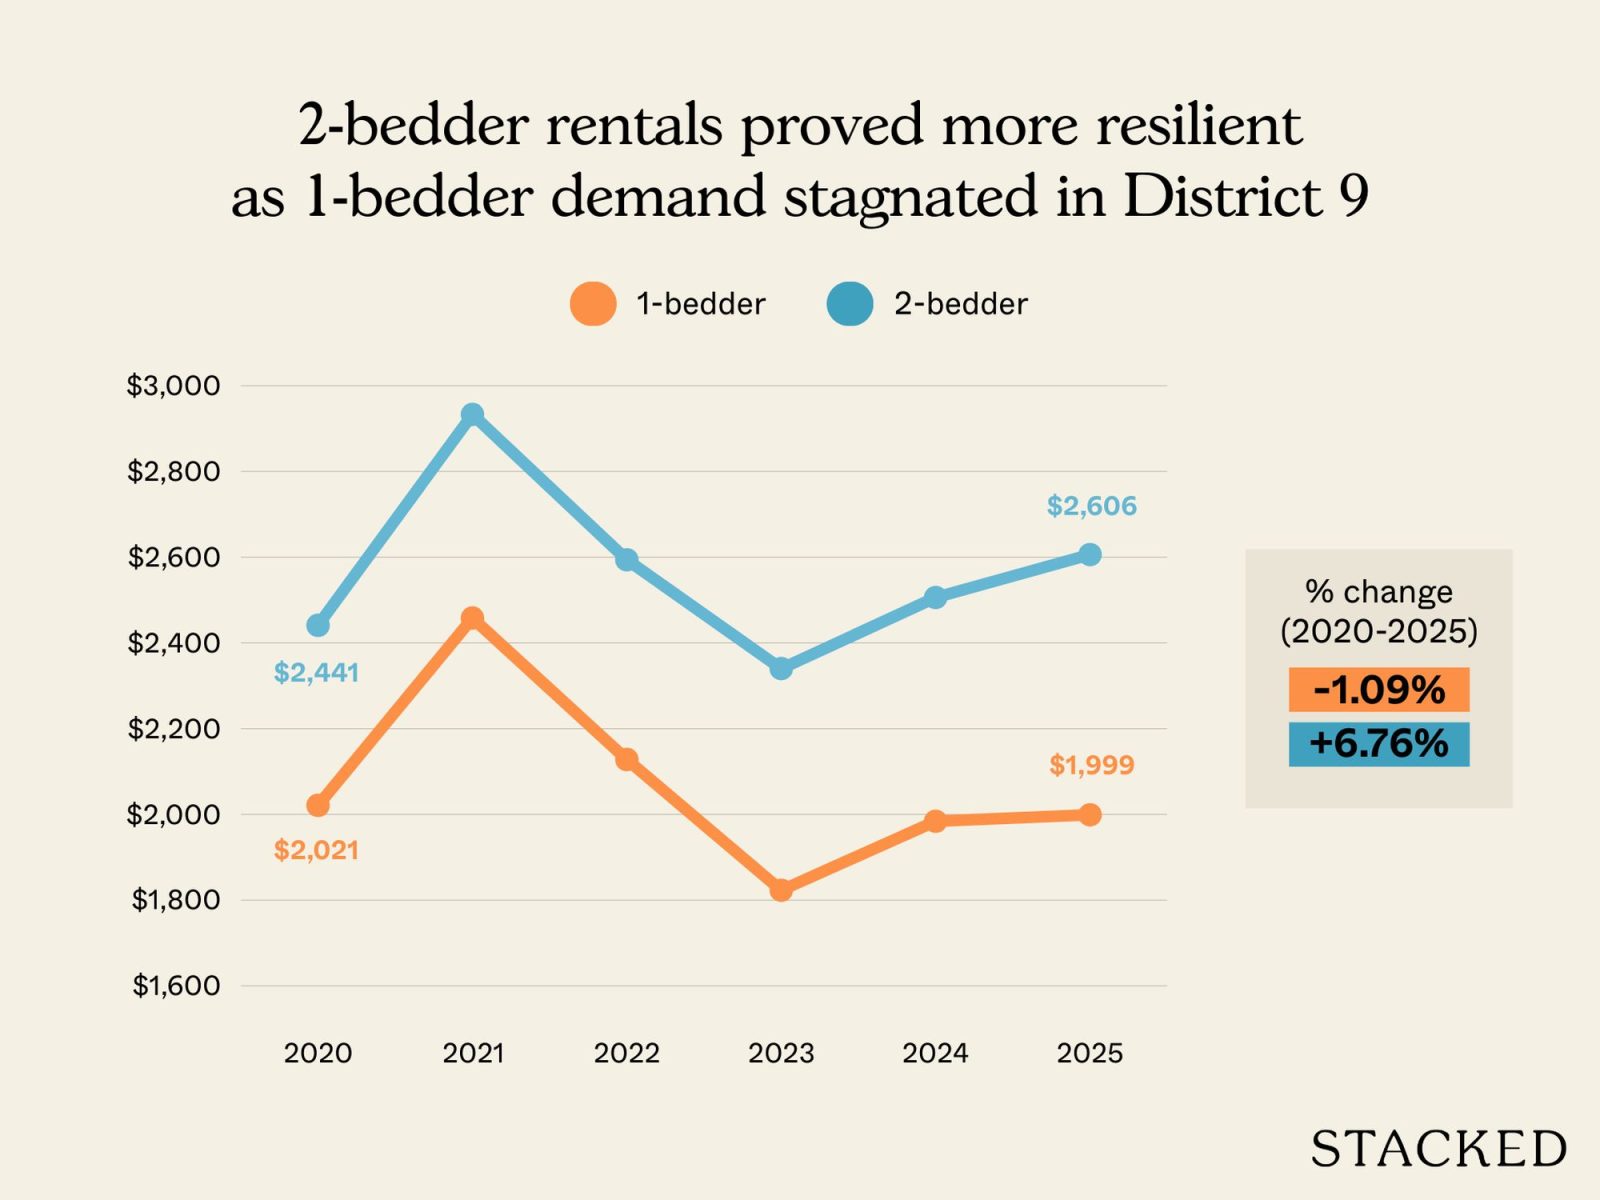
| Year | 1-bedder | 2-bedder |
| 2020 | 2021 | 2441 |
| 2021 | 2458 | 2933 |
| 2022 | 2128 | 2594 |
| 2023 | 1823 | 2340 |
| 2024 | 1984 | 2506 |
| 2025 | 1999 | 2606 |
| % change from 2020 to 2025 | -1.09% | 6.76% |
There’s a clear and substantial jump in the number of tenants signing two-bedder leases, compared to one-bedders.
Average resale prices in D9 (only includes resale tnx)

| Year | 1-bedder avg price | 2-bedder avg price | Difference in avg price |
| 2020 | $1,327,174 | $2,128,657 | $801,484 |
| 2021 | $1,343,290 | $2,065,412 | $722,122 |
| 2022 | $1,342,664 | $2,081,375 | $738,711 |
| 2023 | $1,247,807 | $2,214,465 | $966,658 |
| 2024 | $1,330,600 | $2,168,017 | $837,417 |
| 2025 | $1,320,016 | $2,263,368 | $943,351 |
| % change from 2020 to 2025 | -0.54% | 6.33% | 17.70% |
The gap in average rents between the two unit types widened quite a bit, from just over $800,000 in 2020 to about $943,000 by 2025, an increase of close to 18%. This is also reflected in the percentage change over the same period.
Coupled with the higher leasing volume, this signifies much greater demand and support for two-bedder layouts in D9.
Rental yield in D9

| Year | 1-bedder | 2-bedder | Difference in rental yield |
| 2020 | 2.73% | 2.41% | -0.32% |
| 2021 | 2.76% | 2.54% | -0.22% |
| 2022 | 3.31% | 2.95% | -0.36% |
| 2023 | 4.19% | 3.21% | -0.98% |
| 2024 | 3.68% | 3.08% | -0.60% |
| 2025 | 3.67% | 2.97% | -0.71% |
| % change from 2020 to 2025 | 0.95% | 0.56% | -0.39% |
As in other prime districts, one-bedders consistently delivered higher gross rental yields. The yield gap also widened noticeably during the post-Covid-19 pandemic period, reaching almost a full percentage point in 2023, before narrowing again.
While the yield gap is narrow, it exists alongside stronger resale price performance for two-bedders, plus higher leasing volume. As such, we’d say the argument tilts strongly in favour of two-bedders, as compared to a gross yield with a difference of just 0.39%.
Next let’s look in District 10 (D10)
Average rent for 1 and 2-bedders in D10

| Year | 1-bedder avg rent | 2-bedder avg rent | Difference in avg rent |
| 2020 | $2,569 | $3,763 | $1,195 |
| 2021 | $2,659 | $3,884 | $1,225 |
| 2022 | $3,161 | $4,628 | $1,468 |
| 2023 | $3,824 | $5,451 | $1,627 |
| 2024 | $3,681 | $5,222 | $1,541 |
| 2025 | $3,683 | $5,236 | $1,553 |
| % change from 2020 to 2025 | 43.38% | 39.15% | 30.05% |
By now the pattern is familiar: two-bedders record lower growth percentage wise, but pulled ahead in absolute rent. The rental gap widened from around $1,200 in 2020 to approximately $1,550 by 2025, which is an increase of about 30%.
Transaction volume
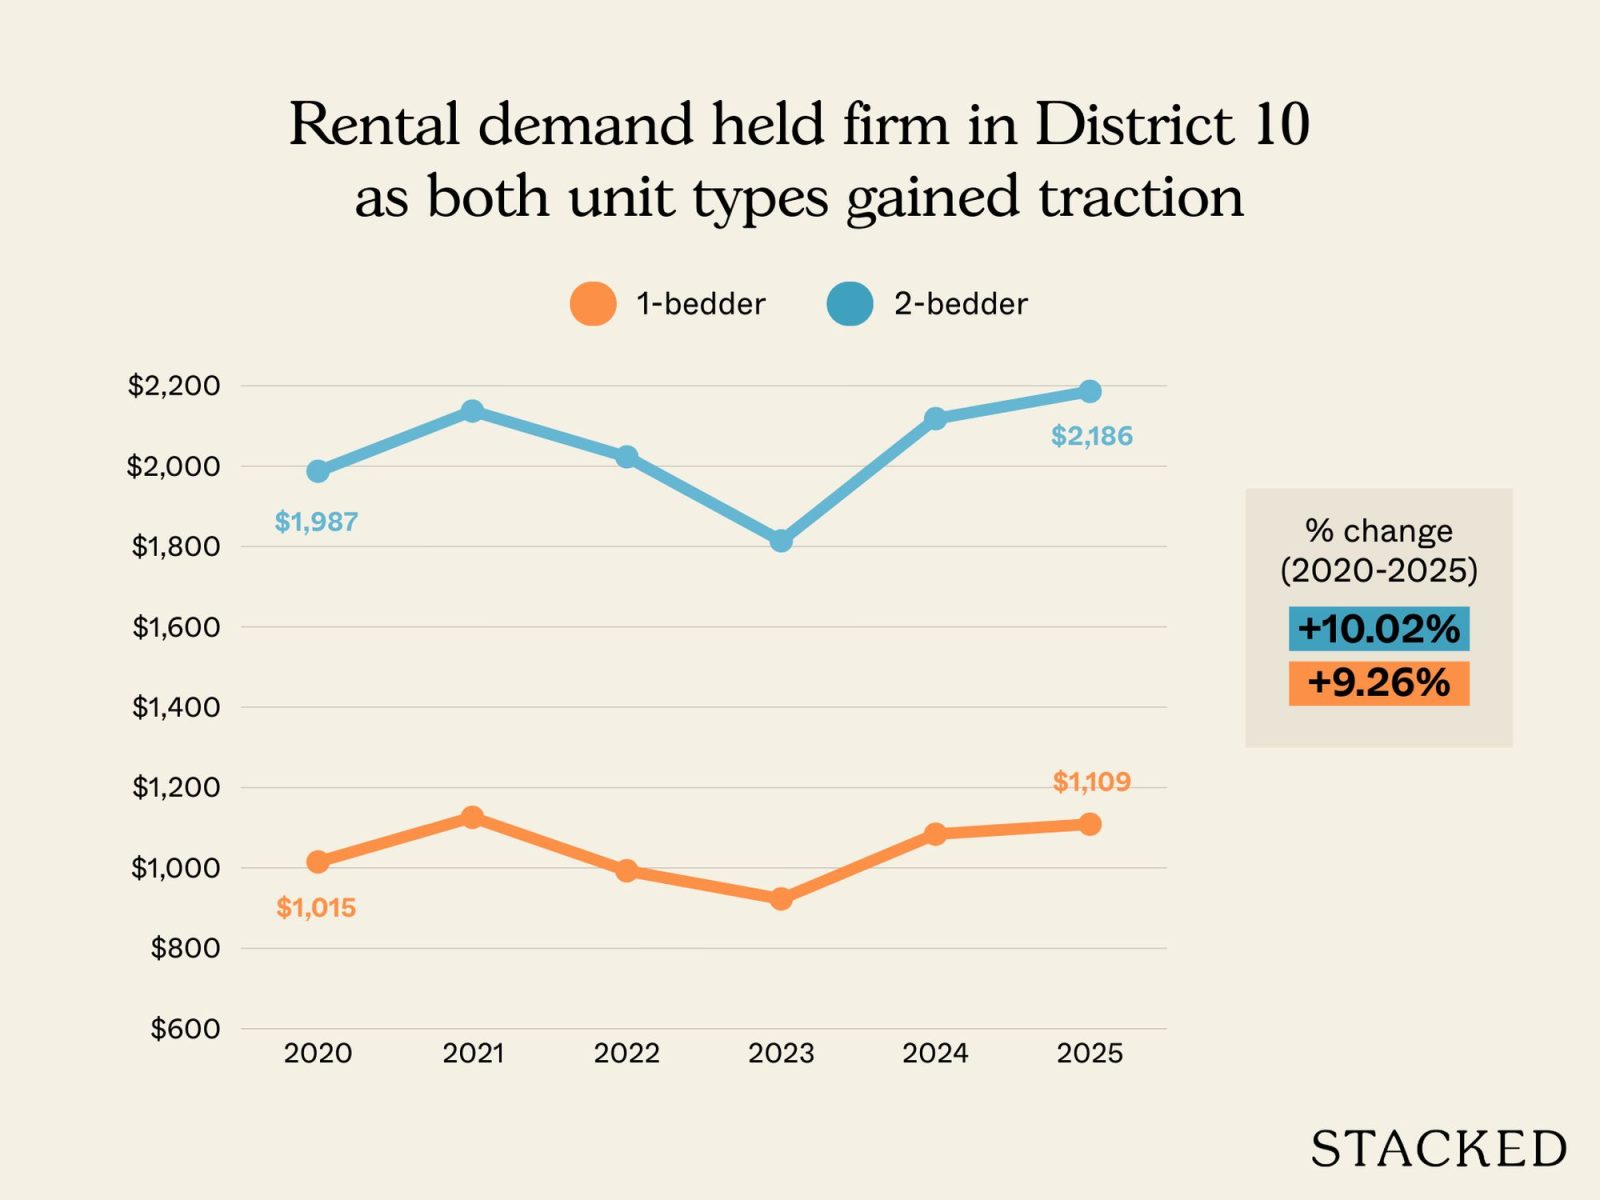
| Year | 1-bedder | 2-bedder |
| 2020 | 1015 | 1987 |
| 2021 | 1126 | 2137 |
| 2022 | 993 | 2023 |
| 2023 | 923 | 1814 |
| 2024 | 1084 | 2118 |
| 2025 | 1109 | 2186 |
| % change from 2020 to 2025 | 9.26% | 10.02% |
Rental transaction volumes in District 10 increased for both unit types over the five-year period. Two-bedders continue to record a significantly higher absolute number of leases, but demand between the two is more balanced compared to what we saw in District 1 and District 9.
Average resale prices in D10 (only includes resale tnx)
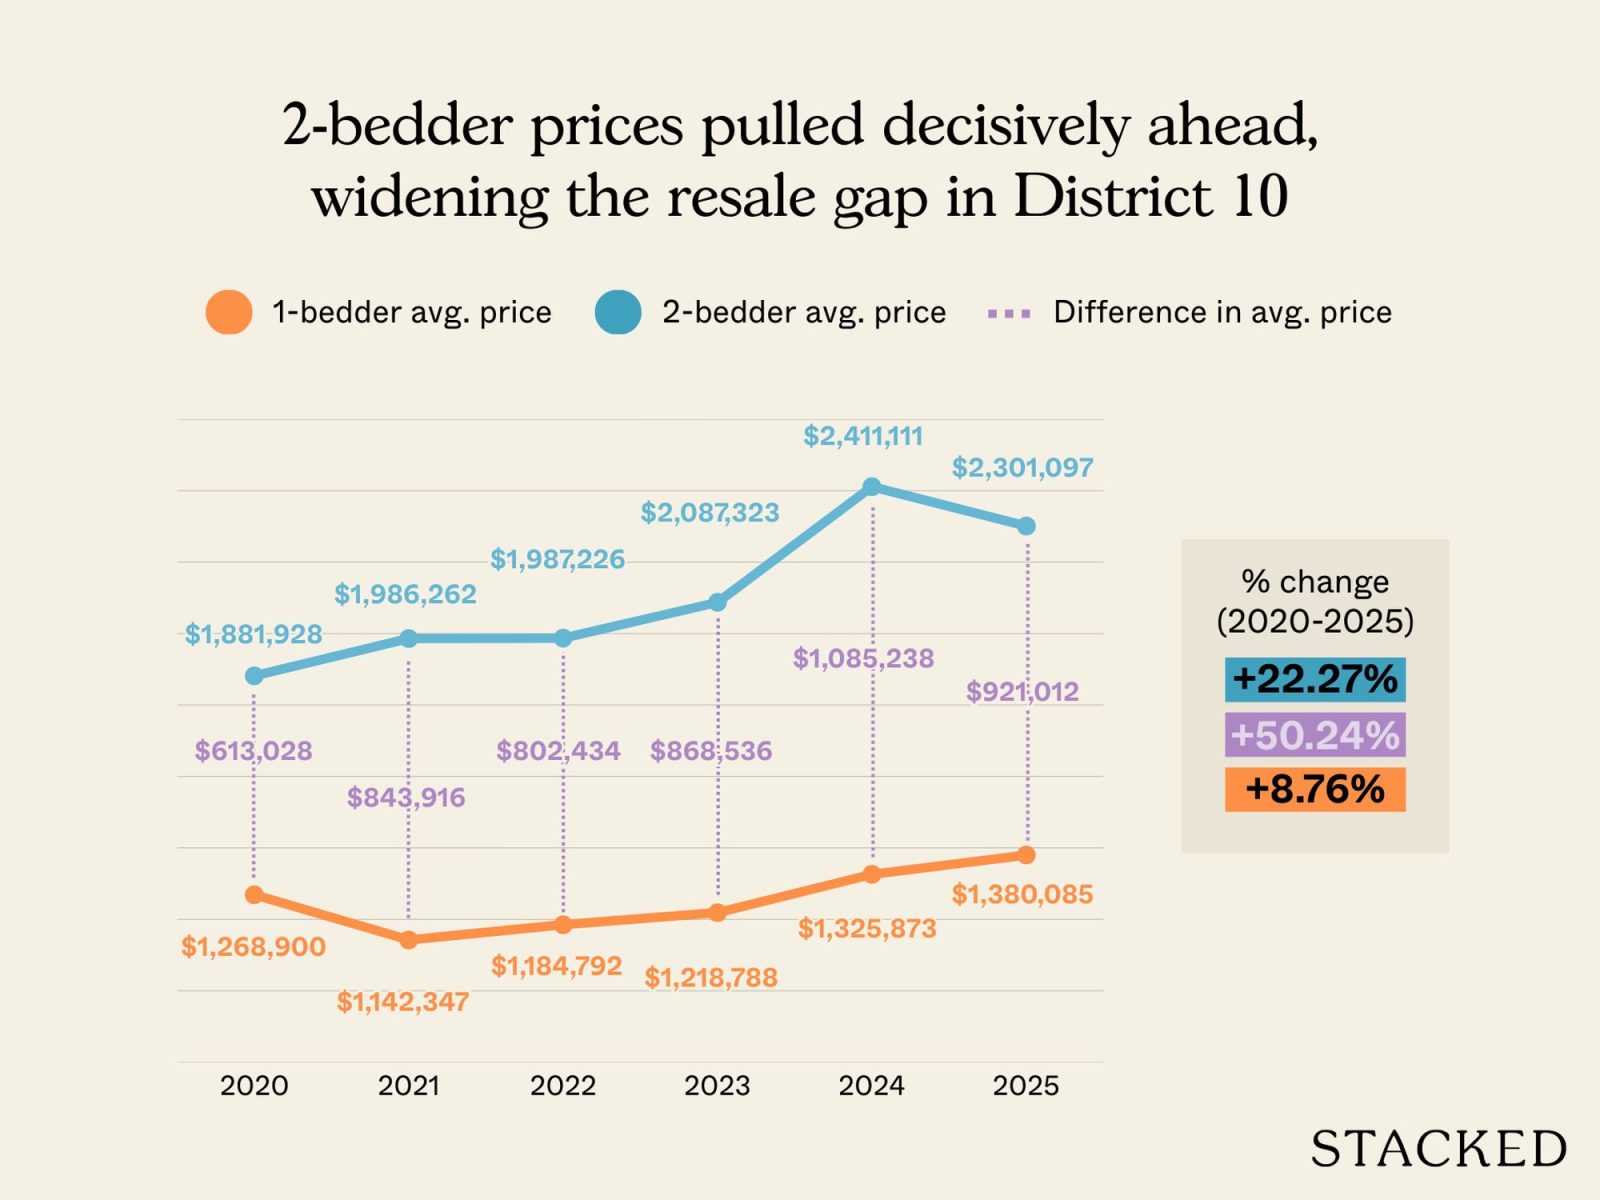
| Year | 1-bedder avg price | 2-bedder avg price | Difference in avg price |
| 2020 | $1,268,900 | $1,881,928 | $613,028 |
| 2021 | $1,142,347 | $1,986,262 | $843,916 |
| 2022 | $1,184,792 | $1,987,226 | $802,434 |
| 2023 | $1,218,788 | $2,087,323 | $868,536 |
| 2024 | $1,325,873 | $2,411,111 | $1,085,238 |
| 2025 | $1,380,085 | $2,301,097 | $921,012 |
| % change from 2020 to 2025 | 8.76% | 22.27% | 50.24% |
What’s notable here is the gap in average rent between one- and two-bedders. What began as a difference of just over $610,000 in 2020 expanded to more than $920,000 by 2025, an increase of about 50%. This is a significant trend that should factor into the exit strategies of most landlords in this market.
Rental yield in D10

| Year | 1-bedder | 2-bedder | Difference in rental yield |
| 2020 | 2.43% | 2.40% | -0.03% |
| 2021 | 2.79% | 2.35% | -0.45% |
| 2022 | 3.20% | 2.79% | -0.41% |
| 2023 | 3.76% | 3.13% | -0.63% |
| 2024 | 3.33% | 2.60% | -0.73% |
| 2025 | 3.20% | 2.73% | -0.47% |
| % change from 2020 to 2025 | 0.77% | 0.33% | -0.44% |
Rental yields in District 10 improved for one- and two-bedders between 2020 and 2025. But the situation has changed quite a bit during those five years. In 2020 there was almost no difference in the rental yields between one- and two-bedders. But after the Covid-19 pandemic, the two segments began to diverge before narrowing again slightly in 2025.
As in the other districts, we see a recurring pattern here: the two-bedders benefitted more from price growth, while one-bedders remained more efficient in terms of rental income.
Finally, let’s look at District 11 (D11)
Average rent for 1 and 2-bedders in D11
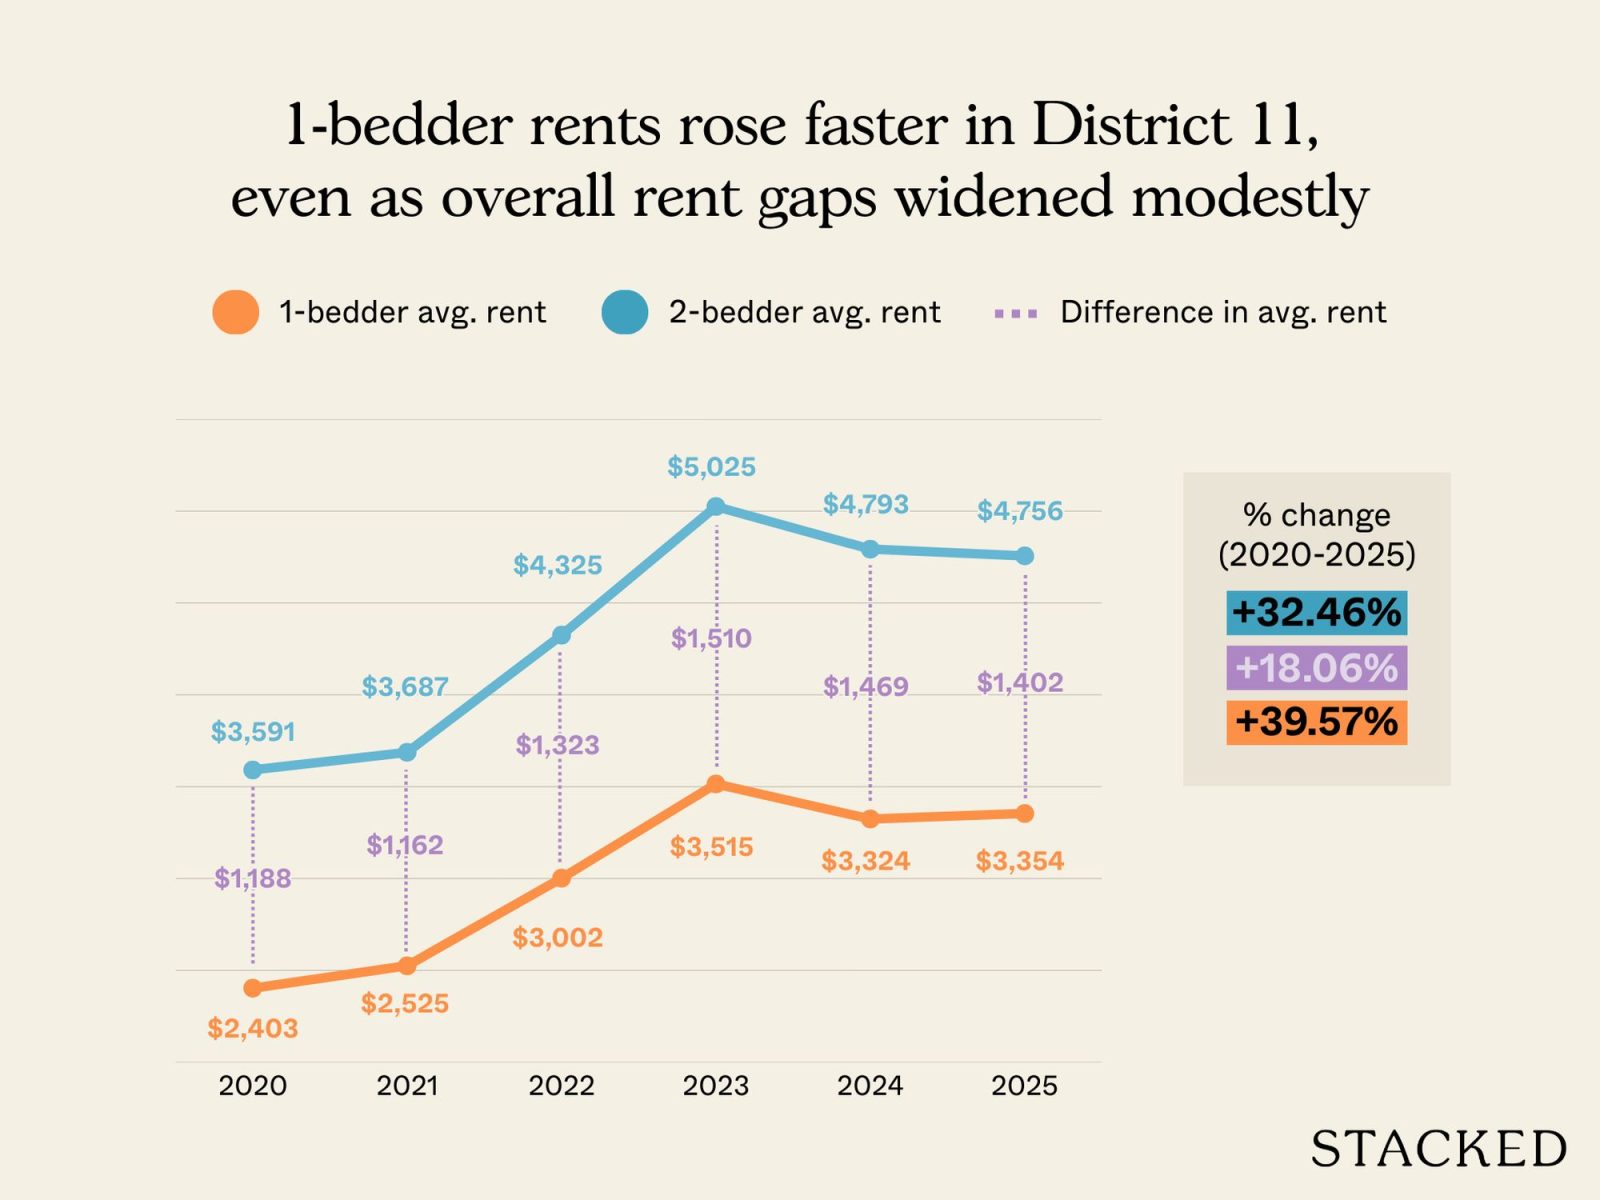
| Year | 1-bedder avg rent | 2-bedder avg rent | Difference in avg rent |
| 2020 | $2,403 | $3,591 | $1,188 |
| 2021 | $2,525 | $3,687 | $1,162 |
| 2022 | $3,002 | $4,325 | $1,323 |
| 2023 | $3,515 | $5,025 | $1,510 |
| 2024 | $3,324 | $4,793 | $1,469 |
| 2025 | $3,354 | $4,756 | $1,402 |
| % change from 2020 to 2025 | 39.57% | 32.46% | 18.06% |
Rental growth for one- and two-bedders followed the same broad pattern in Distirct 11. Despite stronger percentage growth among the one-bedder rental market, two-bedders saw higher absolute rents. The monthly rental gap widened from around $1,190 in 2020 to about $1,400 by 2025, an increase of roughly 18%. This is more muted than what we saw in District 9 and District 10.
Transaction volume in D11

| Year | 1-bedder | 2-bedder |
| 2020 | 622 | 1233 |
| 2021 | 697 | 1479 |
| 2022 | 655 | 1254 |
| 2023 | 479 | 1055 |
| 2024 | 535 | 1130 |
| 2025 | 547 | 1098 |
| % change from 2020 to 2025 | -12.06% | -10.95% |
Leasing volumes have also fallen for both one- and two-bedders in District 11, but one-bedders saw a bigger decline. Two-bedders also recorded a higher number of leases, even as both segments recorded a decline in overall leasing volumes during this period.
Average resale prices in D11 (only includes resale tnx)
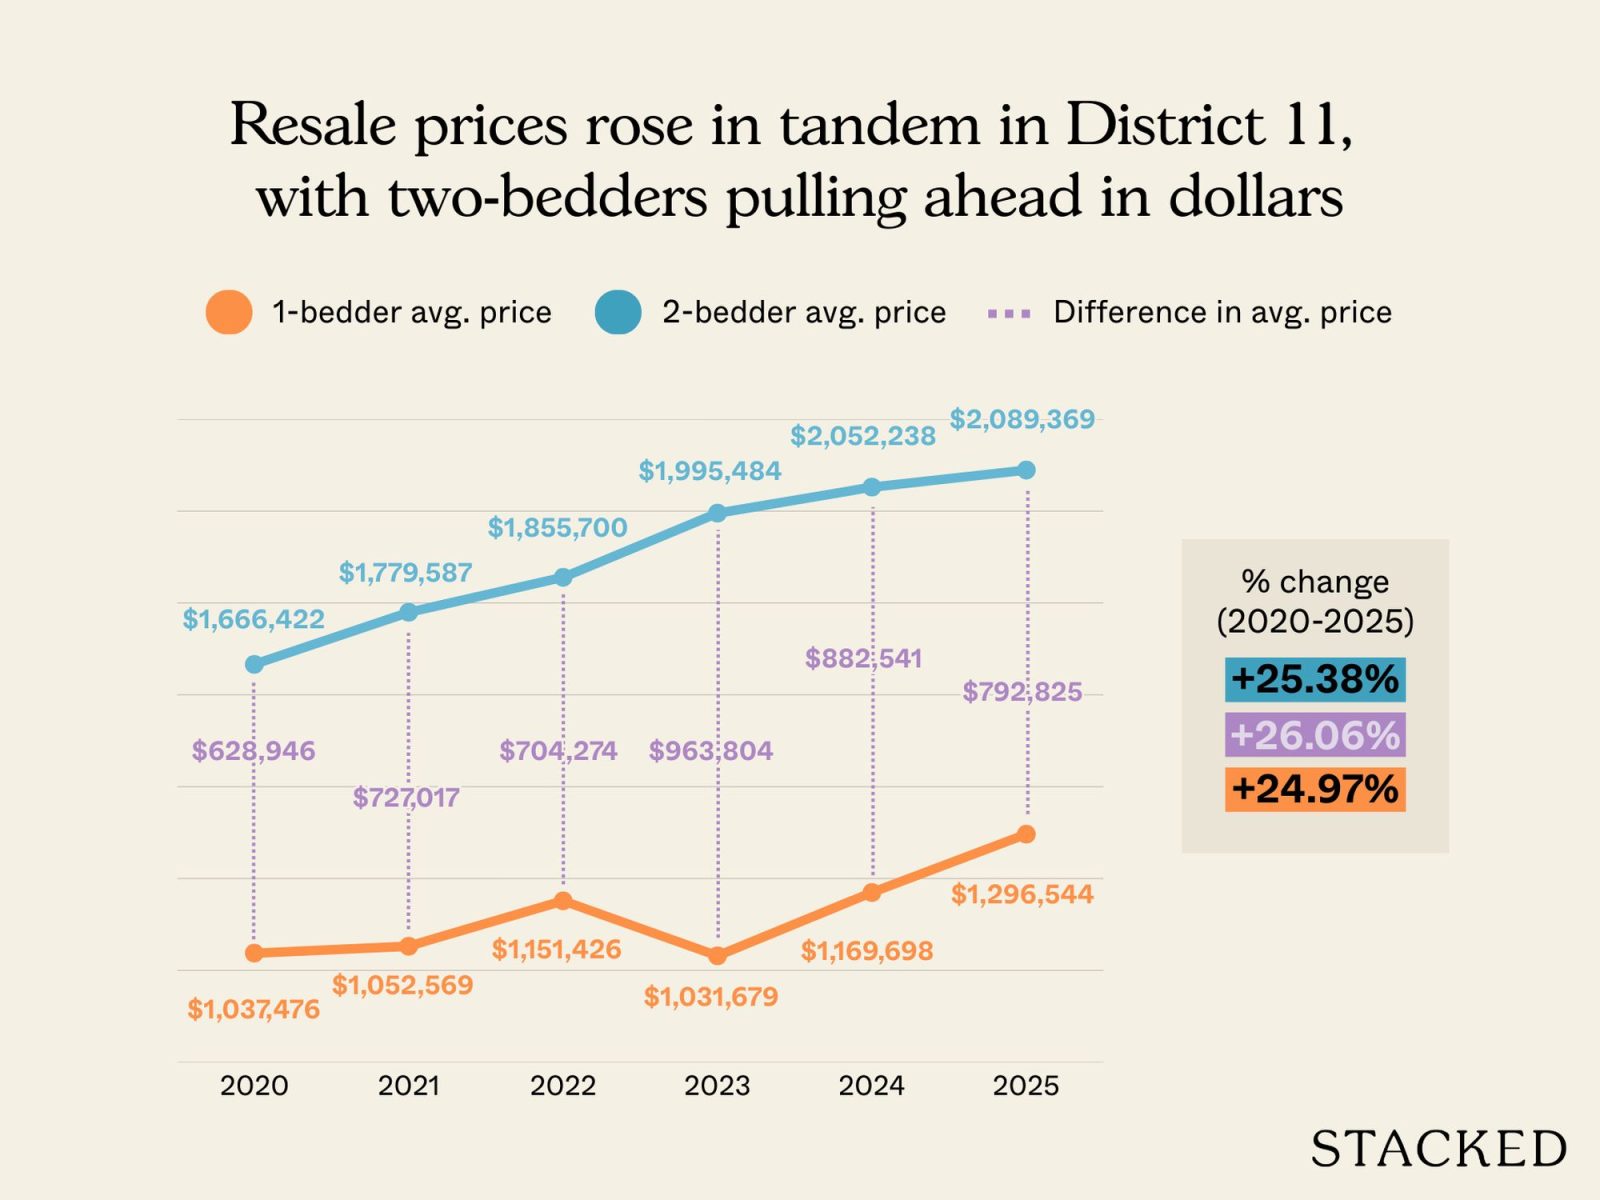
| Year | 1-bedder avg price | 2-bedder avg price | Difference in avg price |
| 2020 | $1,037,476 | $1,666,422 | $628,946 |
| 2021 | $1,052,569 | $1,779,587 | $727,017 |
| 2022 | $1,151,426 | $1,855,700 | $704,274 |
| 2023 | $1,031,679 | $1,995,484 | $963,804 |
| 2024 | $1,169,698 | $2,052,238 | $882,541 |
| 2025 | $1,296,544 | $2,089,369 | $792,825 |
| % change from 2020 to 2025 | 24.97% | 25.38% | 26.06% |
Percentage growth for one and two-bedders is almost similar, but as we have seen so far, there is a notable difference in absolute gains. Two-bedders delivered about $164,000 more than their one-bedder counterparts, a difference of around 26%.
Rental yield in D11
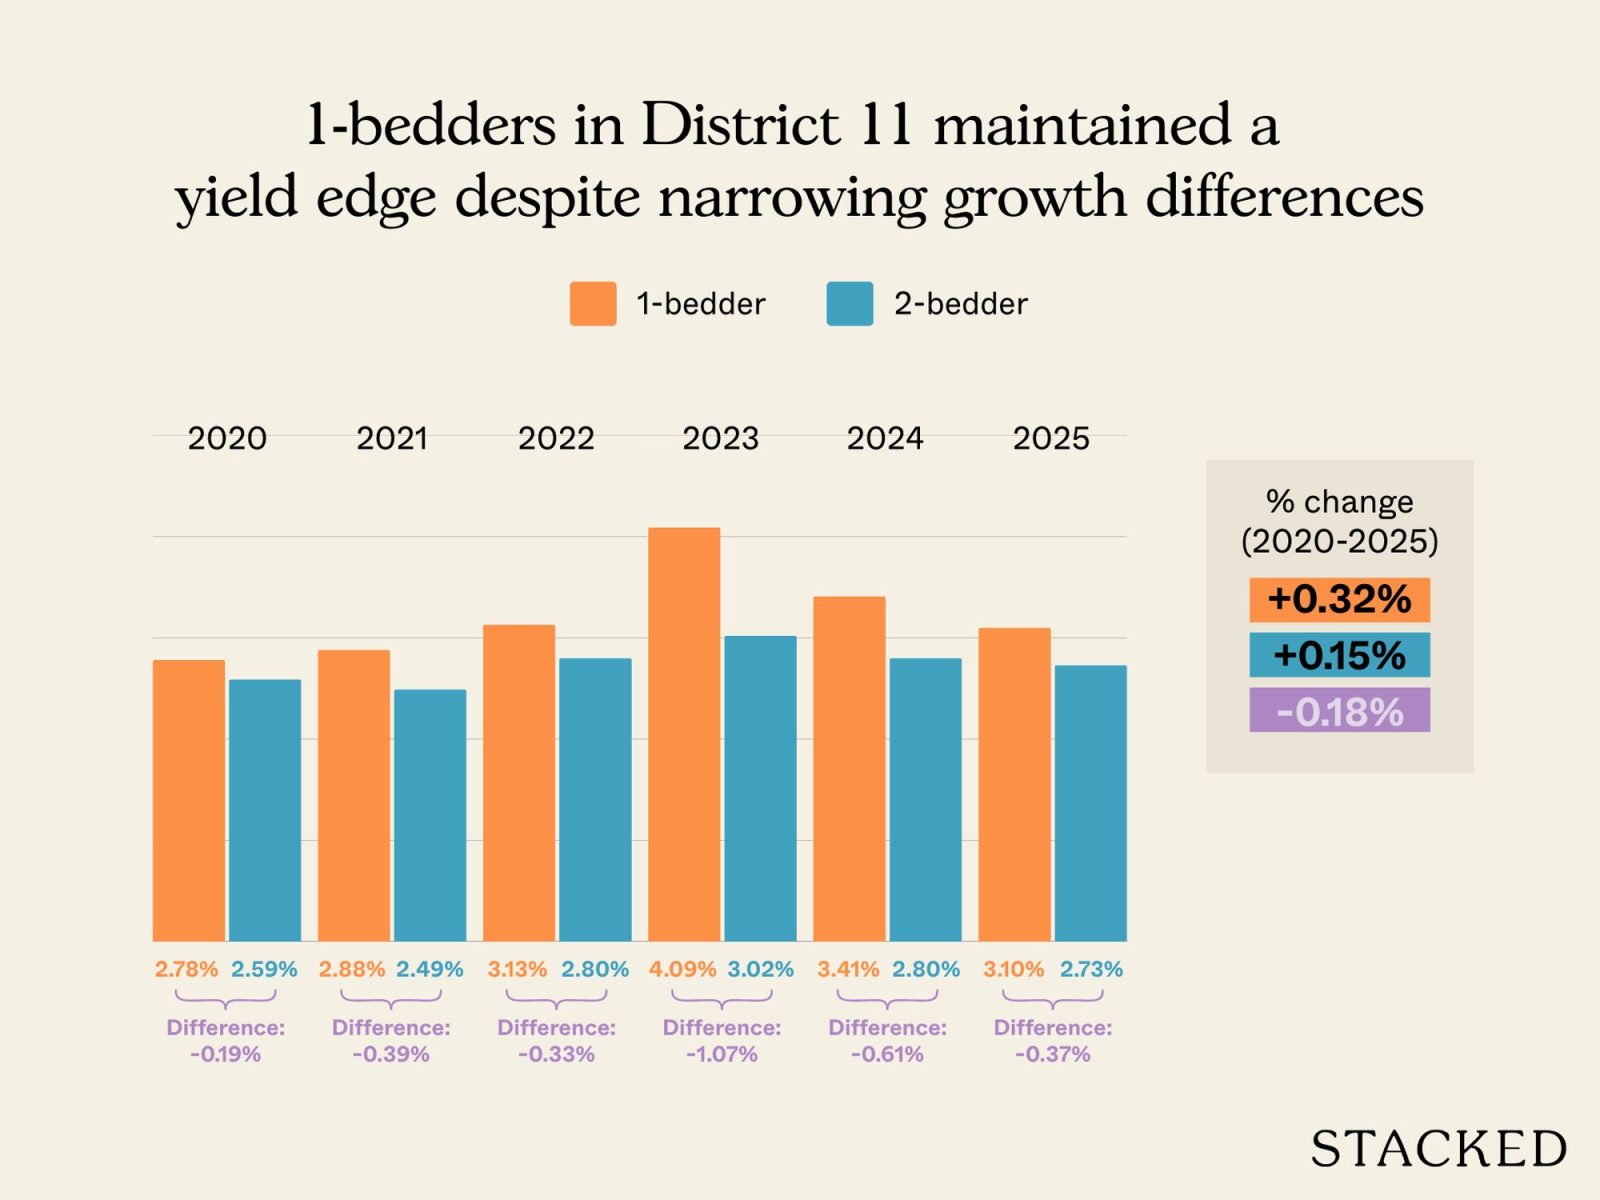
| Year | 1-bedder | 2-bedder | Difference in rental yield |
| 2020 | 2.78% | 2.59% | -0.19% |
| 2021 | 2.88% | 2.49% | -0.39% |
| 2022 | 3.13% | 2.80% | -0.33% |
| 2023 | 4.09% | 3.02% | -1.07% |
| 2024 | 3.41% | 2.80% | -0.61% |
| 2025 | 3.10% | 2.73% | -0.37% |
| % change from 2020 to 2025 | 0.32% | 0.15% | -0.18% |
This is a recurring pattern that we also saw in the other districts. Even though two-bedders delivered better absolute gains on resale (above), one-bedders were more yield-efficient.
As with the other prime districts, this reveals the main trade-off: one-bedders can bring in slightly higher yields, while two-bedders tend to perform better for gains.
Conclusion
If your intent is to “hold to the end,” such as by collecting rental income to sustain your retirement and perhaps never selling, a one-bedder could be a more efficient way to do this. The capital commitment is lower and weaker resale gains don’t matter if you’re not selling.
In almost every other regard however, two-bedders seem to make more sense. They provide an easier and (probably) more profitable exit, and their higher volume of leases could mean improved rentability.
We’ll also leave you with two more tips we have gathered after speaking to agents on the ground:
- A two-bed, two-bath layout tends to be easier to rent or sell than a two-bed, one-bath layout. Most residents prefer not to use the same bathroom, especially if they’re unrelated tenants.
- For example, if both tenants leave for work at the same time, one will have to agree to wake up earlier to shower and get ready (and the other walks into an unpleasant and damp bathroom, if the ventilation can’t cope.)
- A tenant who is single can sometimes be persuaded to pay more to rent your two-bedder. There’s at least a chance they’ll consider the luxury of more space. But a small family will respond to a one-bedder with a hard no, as it’s simply impossible to accommodate their lifestyle needs.
In this sense, a two-bedder also provides much more versatility, and this is something you might not see in the data.
At Stacked, we like to look beyond the headlines and surface-level numbers, and focus on how things play out in the real world.
If you’d like to discuss how this applies to your own circumstances, you can reach out for a one-to-one consultation here.
And if you simply have a question or want to share a thought, feel free to write to us at stories@stackedhomes.com — we read every message.
0 Comments