Sea View Vs Landed View: We Analysed Seaside Residences Resale Profits — Here’s What Paid Off


A seasoned content strategist with over 17 years in the real estate and financial journalism sectors, Ryan has built a reputation for transforming complex industry jargon into accessible knowledge. With a track record of writing and editing for leading financial platforms and publications, Ryan's expertise has been recognised across various media outlets. His role as a former content editor for 99.co and a co-host for CNA 938's Open House programme underscores his commitment to providing valuable insights into the property market.
In this Stacked Pro breakdown:
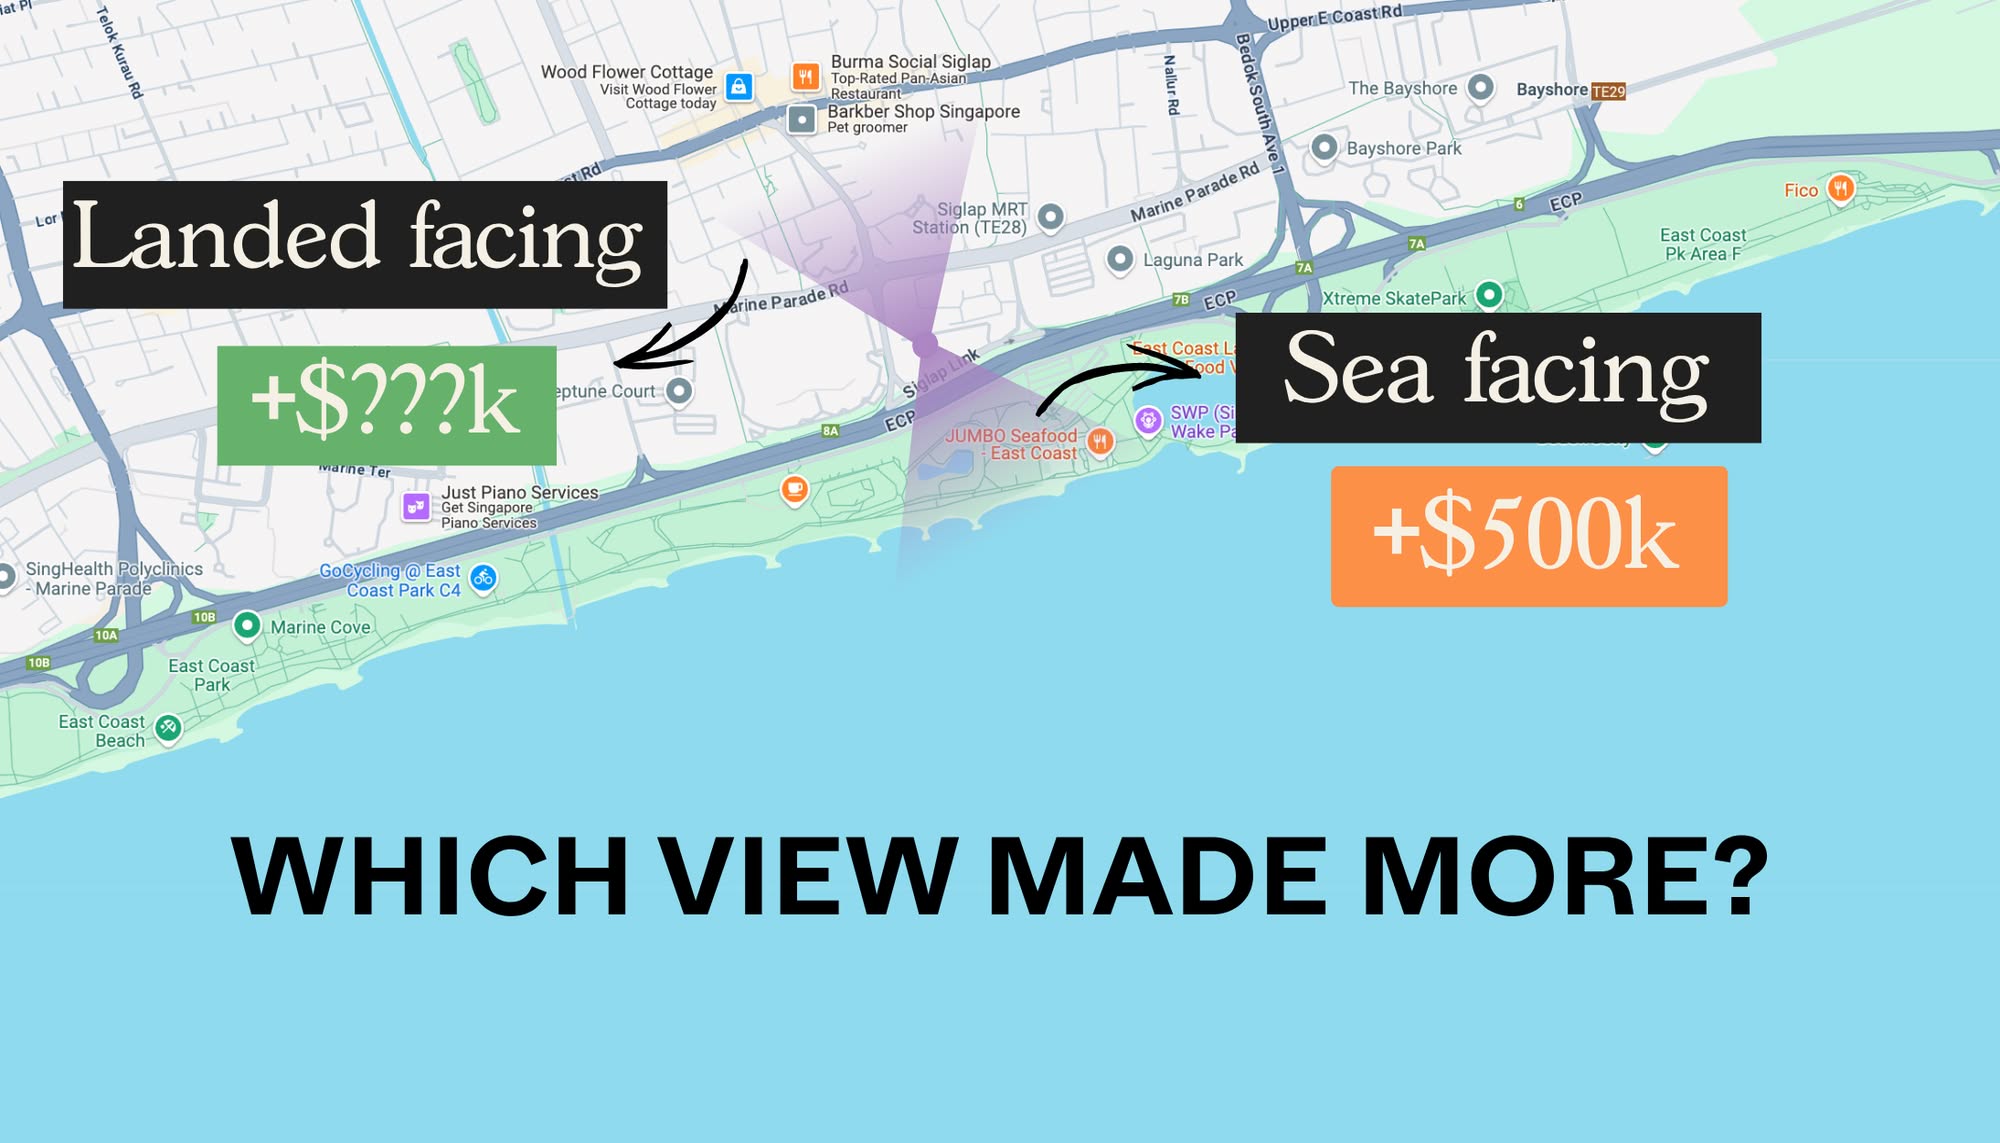
- We compared resale gains across sea-facing and landed-facing units at Seaside Residences
- Some sea-view stacks sold at a launch premium, but did they actually deliver better returns in the resale market?
- See how unit type, floor level, and view premiums played out across real 1- to 4-bedder transactions
Already a subscriber? Log in here.
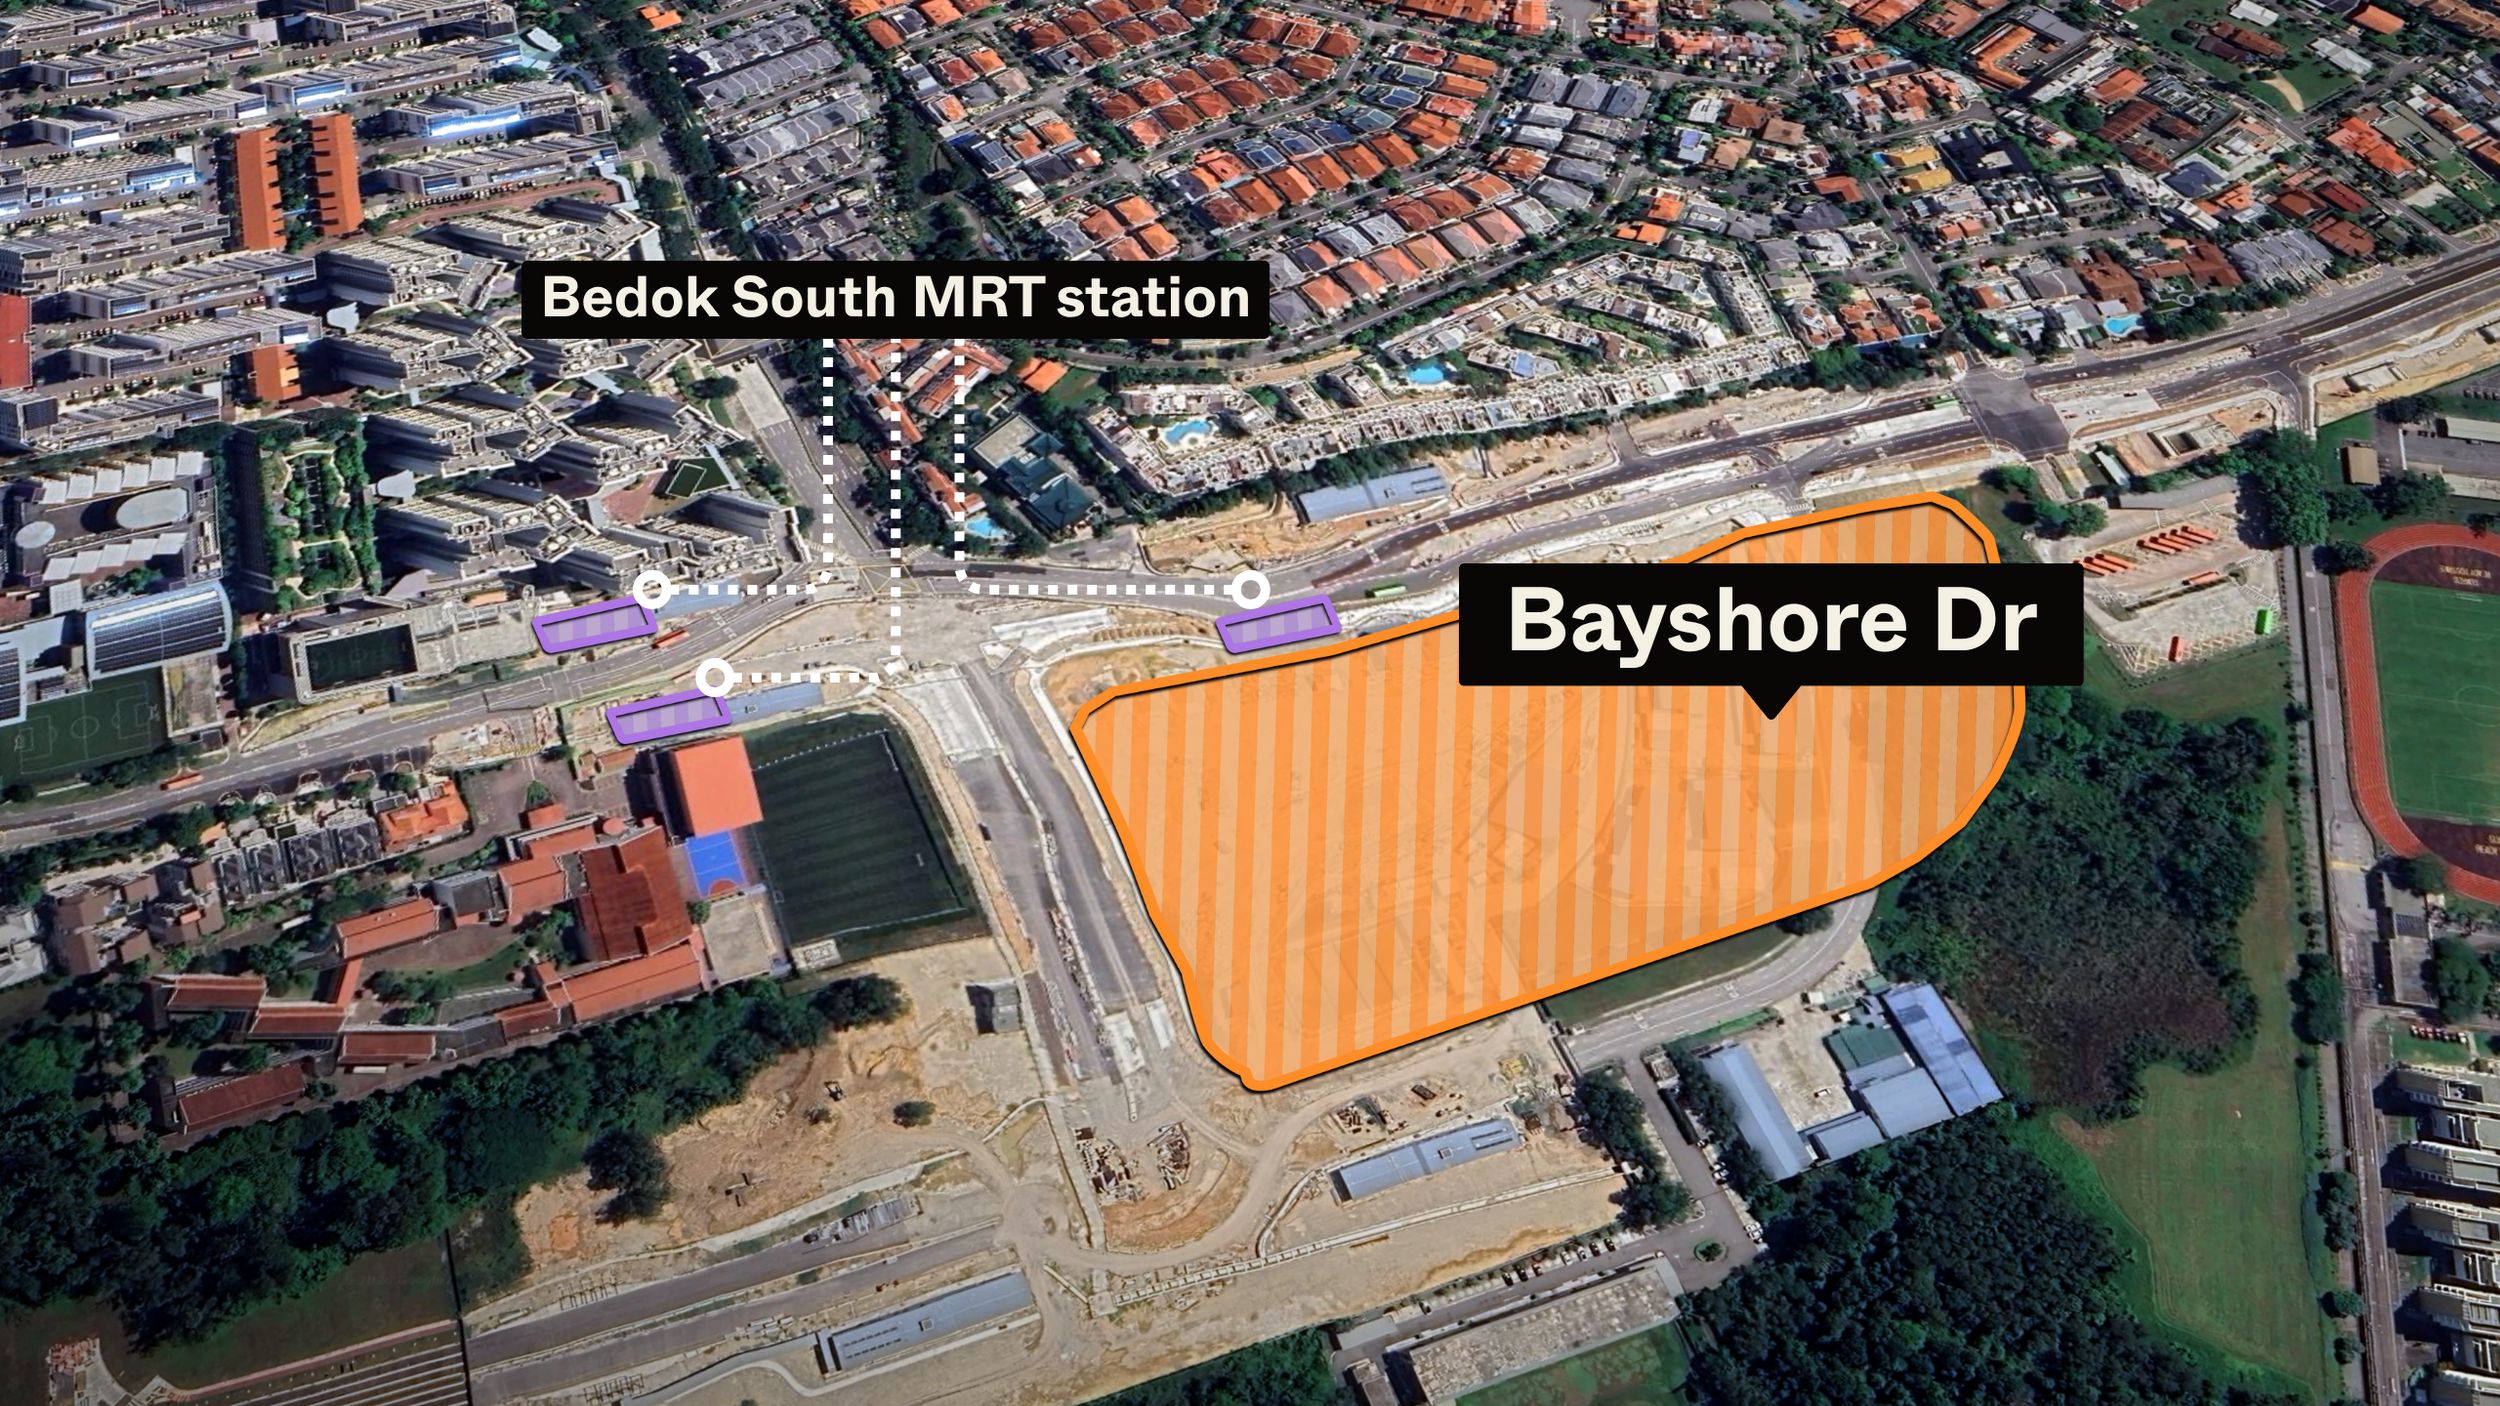
Does it matter to your resale gains, if your condo has a waterfront view, inward-facing view, greenery view, etc.? This is one of the most common questions we’re faced with, and it’s not viable to give a universal answer. It really boils down to the condo in question. So in this series on different views and the impact on pricing, we’re going to examine different projects on a standalone basis; and this week we’re focusing on Seaside Residences.
A profile of Seaside Residences
Seaside Residences is a leasehold condo that was completed quite recently, in 2021. It’s located at 10 Siglap Link, placing it in District 15. This 841-unit condo makes a good case study, as it’s both sizeable and has notably different facings:

There are 27 blocks in this project, and all the units have an outward facing. But notice that some units have a view of East Coast Beach, whilst some units have a view of the landed enclave along Marine Parade Road, in the direction of Victoria School.
(For some stacks, units overlook the condo facilities and have a partial sea view.)
Units facing East Coast Beach (Sea view)
As the name implies, Seaside Residences’ selling point is the full frontal sea view, in the direction of East Coast Beach. But the ECP is between the condo and the coastline, and this particular stretch has a lot of dense greenery with tall trees. As such, when we refer to units with a sea view facing, we’re referring mainly to units from the eighth floor and above. Lower floor units may be at or below the treeline.
Units facing Victoria School (Landed enclave)
Victoria School lies between the landed enclave and Seaside Residences. The school is six storeys tall, excluding the added height of the roof; so for a “proper” landed view, you’ll likely need a unit at the eighth floor or higher.
Next, we’ll look at price gains from different stacks, based on unit sizes.
1 + Study units, Block 12 (Stacks 8 and 10)
Stack 8 has unblocked sea views, while Stack 10 has a partial sea view.

Date | Size (sqft) | $PSF | Price | Address | $PSF difference |
29 Aug 2017 | 560 | $1,615 | $904,000 | 12 Siglap Link #02-08(Stack 8) | 2.22% |
22 Apr 2017 | 592 | $1,580 | $935,550 | 12 Siglap Link #02-10(Stack 10) | |
5 Feb 2018 | 560 | $1,674 | $937,000 | 12 Siglap Link #03-08(Stack 8) | 5.35% |
22 Apr 2017 | 592 | $1,589 | $940,500 | 12 Siglap Link #03-10(Stack 10) | |
22 Apr 2017 | 560 | $1,742 | $975,150 | 12 Siglap Link #09-08(Stack 8) | 2.41% |
1 May 2017 | 592 | $1,701 | $1,007,000 | 12 Siglap Link #09-10(Stack 10) | |
22 Apr 2017 | 560 | $1,753 | $981,090 | 12 Siglap Link #10-08(Stack 8) | -0.57% |
13 Jan 2018 | 592 | $1,763 | $1,044,000 | 12 Siglap Link #10-10(Stack 10) | |
20 Apr 2017 | 560 | $1,800 | $1,007,440 | 12 Siglap Link #16-08(Stack 8) | 3.69% |
22 Apr 2017 | 592 | $1,736 | $1,028,020 | 12 Siglap Link #16-10(Stack 10) | |
22 Apr 2017 | 560 | $1,835 | $1,027,040 | 12 Siglap Link #17-08(Stack 8) | 1.72% |
22 Apr 2017 | 592 | $1,804 | $1,068,000 | 12 Siglap Link #17-10(Stack 10) | |
22 Apr 2017 | 560 | $1,928 | $1,079,100 | 12 Siglap Link #23-08(Stack 8) | 0.31% |
16 Dec 2017 | 592 | $1,922 | $1,138,000 | 12 Siglap Link #23-10(Stack 10) | |
22 Apr 2017 | 560 | $1,940 | $1,086,030 | 12 Siglap Link #24-08(Stack 8) | 0.41% |
26 Jan 2018 | 592 | $1,932 | $1,144,000 | 12 Siglap Link #24-10(Stack 10) |
So far, this makes sense. Stack 8, which has an unblocked sea view, has a premium. But notice that as you go higher, the price psf difference narrows and even reverses at certain points (e.g., #10-08 vs. #10-10 at the 10th floor, where Stack 10 has a higher price psf). It could be that the premium for Stack 8 diminishes as both stacks gain better visibility, at the higher floors. Stack 8’s premium is actually more noticeable on lower to middle floors.
Next, we will compare the price gains between the above units:

Sold On | Address | Area (sqft) | Profit (S$) | Bought On | Days | Annualised (%) |
30 Sep 2022 | 12 Siglap Link #03-08(Stack 8) | 560 | 151,000 | 5 Feb 2018 | 1,698 | 3.3 |
23 Dec 2021 | 12 Siglap Link #10-10(Stack 10) | 592 | 166,000 | 13 Jan 2018 | 1,440 | 3.8 |
9 Jun 2021 | 12 Siglap Link #23-08(Stack 8) | 560 | 170,900 | 22 Apr 2017 | 1,509 | 3.6 |
14 May 2021 | 12 Siglap Link #20-10(Stack 10) | 592 | 174,000 | 9 Aug 2017 | 1,374 | 4 |
30 Oct 2023 | 12 Siglap Link #25-10(Stack 10) | 592 | 202,000 | 18 Aug 2017 | 2,264 | 2.7 |
27 April 2023 | 12 Siglap Link #09-08(Stack 8) | 560 | 224,850 | 22 Apr 2017 | 2,196 | 3.5 |
19 Mar 2024 | 12 Siglap Link #06-10(Stack 10) | 592 | 241,000 | 14 Dec 2017 | 2,287 | 3.5 |
27 Oct 2023 | 12 Siglap Link #18-10(Stack 10) | 592 | 246,000 | 23 Apr 2017 | 2,378 | 3.2 |
16 Aug 2024 | 12 Siglap Link #13-08(Stack 8) | 560 | 264,978 | 22 Apr 2017 | 2,673 | 3.3 |
The initial price difference between Stack 8 (unblocked sea view) and Stack 10 (partially blocked sea view) was clear from launch, with a price psf premium of 1.72 to 3.69 per cent for Stack 8.
(Although for reasons we can’t explain, there’s an odd quirk where #16 had a larger gap than #17. This may just be due to uneven demand between stacks and floors, which can happen in the chaos of a launch weekend).
But as the launch progressed, prices increased, and the gap between Stacks 8 and 10 narrowed, since Stack 10 units were sold later than Stack 8 units on the same floor.
Subsequently though, as units entered the resale market, we can see units in Stack 8 did not necessarily make higher profits than those in Stack 10; whether in terms of absolute quantum or annualised returns.
More from Stacked
They Paid A Premium For The Sea View (And Made $200K More): Inside Clement Canopy’s Resale Data
In this Stacked Pro breakdown:
In fact, the highest absolute profits on the table are from Stack 10: #18-10 with a $246,000 profit, and #06-10 at $241,000). But performance wise, the annualised percentage gains of both stacks are in a narrow range of three to four per cent; so the unblocked views of Stack 8 don’t have as big an advantage as we expected.
1+Study units, Block 16 (Stacks 23 and 25)
Stack 20 only has a partial sea view, while Stack 25 has an unblocked sea view.

Date | Size (sqft) | $PSF | Price | Address | $PSF difference |
27 Mar 2018 | 592 | 1,667 | 987,000 | 16 Siglap Link #02-23(Stack 23) | 5.58% |
14 Apr 2018 | 560 | 1,760 | 985,000 | 16 Siglap Link #02-25(Stack 25) | |
24 Mar 2018 | 592 | 1,677 | 993,000 | 16 Siglap Link #03-23(Stack 23) | 5.61% |
30 Mar 2018 | 560 | 1,771 | 991,000 | 16 Siglap Link #03-25(Stack 25) | |
8 Oct 2017 | 592 | 1,708 | 1,011,000 | 16 Siglap Link #09-23(Stack 23) | 5.97% |
23 May 2017 | 560 | 1,810 | 1,013,000 | 16 Siglap Link #09-25(Stack 25) | |
21 Jan 2018 | 592 | 1,736 | 1,028,000 | 16 Siglap Link #10-23(Stack 23) | 5.07% |
22 May 2017 | 560 | 1,824 | 1,021,000 | 16 Siglap Link #10-25(Stack 25) | |
25 Sep 2017 | 592 | 1,769 | 1,047,000 | 16 Siglap Link #15-23(Stack 23) | 7.18% |
7 May 2017 | 560 | 1,896 | 1,061,000 | 16 Siglap Link #15-25(Stack 25) | |
24 Jul 2017 | 592 | 1,779 | 1,053,000 | 16 Siglap Link #16-23(Stack 23) | 7.48% |
7 May 2017 | 560 | 1,912 | 1,070,000 | 16 Siglap Link #16-25(Stack 25) |
Stack 25 had a clear premium over 23, typically in the range of five to 7.48 per cent higher. This time, the premium also increased as the floors got higher:
For units on the 2nd and third floor, the premium gap between Stacks 25 and 23 where around 5.6 per cent. But when you get to floors 15 and 16, the gap between the two stacks climbs to over seven per cent.
We also noticed that Later transactions (September 2017 to July 2018) show an increasing premium for Stack 25. Speculatively, the developer may have adjusted prices due to demand.
Now let’s compare actual gains between these stacks:

Sold On | Address | Area (sqft) | Profit (S$) | Bought On | Days | Annualised (%) |
25 Nov 2020 | 16 Siglap Link #02-25(Stack 25) | 560 | -65,000 | 14 Apr 2018 | 956 | -2.6 |
3 Jan 2025 | 16 Siglap Link #04-25(Stack 25) | 560 | 159,000 | 2 Apr 2018 | 2,468 | 2.2 |
6 Oct 2023 | 16 Siglap Link #15-23(Stack 23) | 592 | 193,000 | 25 Sep 2017 | 2,202 | 2.8 |
11 Jul 2024 | 16 Siglap Link #13-25(Stack 25) | 560 | 215,000 | 7 May 2017 | 2,622 | 2.6 |
12 Jul 2024 | 16 Siglap Link #10-23(Stack 23) | 592 | 252,000 | 21 Jan 2018 | 2,364 | 3.4 |
20 Mar 2023 | 16 Siglap Link #07-23(Stack 23) | 592 | 257,000 | 25 Jan 2018 | 1,880 | 4.6 |
14 Nov 2024 | 16 Siglap Link #14-23(Stack 23) | 592 | 276,888 | 22 Nov 2017 | 2,549 | 3.4 |
26 May 2023 | 16 Siglap Link #27-23(Stack 23) | 775 | 325,060 | 23 Feb 2021 | 822 | 10.5 |
Stack 23, despite its partially blocked views, outperformed Stack 25. We can see units like #27-23 and #07-23 had significantly higher profits ($325,000 and $257,000, respectively).
Stack 25, on the other hand, is pulled down by the performance of #2-025 (loss of $65,000). Its other units also don’t match the scale of Stack 23’s gains. So, for this particular set of units, a better sea view didn’t help with gains.
Now let’s look at two-bedder units, Block 18 (Stack 27 vs 32)
(Note that Stack 32 starts from the fifth floor)
We can compare two different views here: Stack 27 has the sea view, while Stack 32 has a view looking toward the landed estate. Both stacks offer unimpeded views.

Date | Size (sqft) | $PSF | Price | Address | $PSF difference |
22 Apr 2017 | 786 | $1,605 | $1,261,260 | 18 Siglap Link #05-27(Stack 27) | 2.56% |
22 Apr 2017 | 678 | $1,565 | $1,061,000 | 18 Siglap Link #05-32(Stack 32) | |
27 Apr 2017 | 786 | $1,630 | $1,281,000 | 18 Siglap Link #06-27(Stack 27) | 3.69% |
29 Apr 2017 | 678 | $1,572 | $1,066,230 | 18 Siglap Link #06-32(Stack 32) | |
22 Apr 2017 | 786 | $1,753 | $1,377,090 | 18 Siglap Link #12-27(Stack 27) | 6.31% |
22 Apr 2017 | 678 | $1,649 | $1,118,000 | 18 Siglap Link #12-32(Stack 32) | |
22 Apr 2017 | 786 | $1,763 | $1,385,010 | 18 Siglap Link #13-27(Stack 27) | 6.40% |
22 Apr 2017 | 678 | $1,657 | $1,124,000 | 18 Siglap Link #13-32(Stack 32) | |
22 Apr 2017 | 786 | $1,855 | $1,457,280 | 18 Siglap Link #19-27(Stack 27) | -2.78% |
17 May 2019 | 678 | $1,908 | $1,294,050 | 18 Siglap Link #19-32(Stack 32) | |
22 Apr 2017 | 786 | $1,867 | $1,467,180 | 18 Siglap Link #20-27(Stack 27) | -3.56% |
30 May 2019 | 678 | $1,936 | $1,312,780 | 18 Siglap Link #20-32(Stack 32) | |
22 Apr 2017 | 786 | $1,962 | $1,542,000 | 18 Siglap Link #26-27(Stack 27) | -3.92% |
21 Sep 2020 | 678 | $2,042 | $1,385,000 | 18 Siglap Link #26-32(Stack 32) |
The developer clearly priced the sea views higher, as Stack 27 has a higher price psf across all transactions. The price range was from $1,605 to $2,042 psf for Stack 27, but only between $1,565 to $1,936 psf for Stack 32.
Now let’s compare the gains between the stacks:

Sold On | Address | Area (sqft) | Profit (S$) | Bought On | Days | Annualised (%) |
23 May 2024 | 18 Siglap Link #18-32(Stack 32) | 678 | 102,598 | 10 Mar 2019 | 1,901 | 1.5 |
14 Jun 2023 | 18 Siglap Link #20-32(Stack 32) | 678 | 137,220 | 30 May 2019 | 1,476 | 2.5 |
5 Jan 2022 | 18 Siglap Link #14-32(Stack 32) | 678 | 165,000 | 29 December 2017 | 1,468 | 3.3 |
5 Jul 2024 | 18 Siglap Link #16-32(Stack 32) | 678 | 243,000 | 14 Oct 2017 | 2,456 | 2.9 |
27 Sep 2021 | 18 Siglap Link #08-32(Stack 32) | 678 | 249,000 | 13 Aug 2017 | 1,506 | 5.1 |
8 Feb 2021 | 18 Siglap Link #26-27(Stack 27) | 786 | 298,000 | 22 Apr 2017 | 1,388 | 4.8 |
31 May 2021 | 18 Siglap Link #18-27(Stack 27) | 786 | 342,620 | 22 Apr 2017 | 1,500 | 5.3 |
7 Aug 2024 | 18 Siglap Link #23-27(Stack 27) | 786 | 500,000 | 22 Apr 2017 | 2,664 | 4 |
Stack 27 seems to have justified its price premium. Units in this stack consistently showed larger profits compared to Stack 32. Note #23-27 and #18-27, with profits of $500,000 and $342,000, respectively.
While Stack 32 showed some units with strong returns (e.g., #08-32 at 5.1 per cent gain), it has generally lower profit figures and more modest annualised returns.
Speculatively, this may have been partly affected by Stack 27 units being two-bed, two-bathroom units, whereas Stack 32 had two-bed, one-bath units.
Nonetheless, the sea view seems to have won out over the landed view, for this set of units.
Two-bedder units, Block 12 (Stack 7 and Stack 12)
(Note: Stack 12 starts from the fifth floor)
Stack 7 gets the sea view, while Stack 12 gets the landed view. The views are unblocked for both stacks.

Date | Size (sqft) | $PSF | Price | Address | $PSF difference |
22 Apr 2017 | 786 | $1,593 | $1,251,360 | 12 Siglap Link #05-07(Stack 7) | 9.86% |
22 Apr 2017 | 678 | $1,450 | $983,000 | 12 Siglap Link #05-12(Stack 12) | |
22 Apr 2017 | 786 | $1,585 | $1,245,580 | 12 Siglap Link #06-07(Stack 7) | 8.71% |
22 Apr 2017 | 678 | $1,458 | $989,000 | 12 Siglap Link #06-12(Stack 12) | |
20 Apr 2017 | 786 | $1,722 | $1,353,380 | 12 Siglap Link #12-07(Stack 7) | 11.67% |
22 Apr 2017 | 678 | $1,542 | $1,045,440 | 12 Siglap Link #12-12(Stack 12) | |
20 Apr 2017 | 786 | $1,732 | $1,361,220 | 12 Siglap Link #13-07(Stack 7) | 11.17% |
22 Apr 2017 | 678 | $1,558 | $1,056,330 | 12 Siglap Link #13-12(Stack 12) | |
20 Apr 2017 | 786 | $1,805 | $1,418,140 | 12 Siglap Link #19-07(Stack 7) | 5.62% |
22 Apr 2017 | 678 | $1,709 | $1,159,000 | 12 Siglap Link #19-12(Stack 12) | |
20 Apr 2017 | 786 | $1,836 | $1,442,560 | 12 Siglap Link #20-07(Stack 7) | 6.81% |
1 May 2017 | 678 | $1,719 | $1,166,000 | 12 Siglap Link #20-12(Stack 12) | |
22 Apr 2017 | 786 | $1,911 | $1,501,360 | 12 Siglap Link #26-07(Stack 7) | 7.30% |
22 Apr 2017 | 678 | $1,781 | $1,208,000 | 12 Siglap Link #26-12(Stack 12) |
As before, the sea view units were priced above the landed view. Stack 7 units generally have higher prices, and #26-07 was the priciest in both stacks, at $1,911 psf.
Looking at the gains between Stacks 7 and 12

Sold On | Address | Area (sqft) | Profit (S$) | Bought On | Days | Annualised (%) |
22 Nov 2021 | 12 Siglap Link #26-12(Stack 12) | 678 | 162,000 | 22 Apr 2017 | 1,675 | 2.8 |
21 Oct 2020 | 12 Siglap Link #21-07(Stack 7) | 786 | 167,640 | 22 Apr 2017 | 1,278 | 3.2 |
3 Dec 2021 | 12 Siglap Link #22-12(Stack 12) | 678 | 178,000 | 19 Oct 2017 | 1,506 | 3.4 |
10 Nov 2021 | 12 Siglap Link #13-12(Stack 12) | 678 | 193,670 | 22 Apr 2017 | 1,663 | 3.8 |
28 Oct 2022 | 12 Siglap Link #08-12(Stack 12) | 678 | 209,000 | 26 Jul 2017 | 1,920 | 3.6 |
9 Feb 2022 | 12 Siglap Link #10-12(Stack 12) | 678 | 246,440 | 22 April 2017 | 1,754 | 4.6 |
27 Sep 2022 | 12 Siglap Link #25-12(Stack 12) | 678 | 261,010 | 22 Apr 2017 | 1,984 | 3.7 |
29 Mar 2023 | 12 Siglap Link #12-12(Stack 12) | 678 | 334,560 | 22 Apr 2017 | 2,167 | 4.8 |
23 Jun 2021 | 12 Siglap Link #07-07(Stack 7) | 786 | 335,800 | 22 Apr 2017 | 1,523 | 5.8 |
18 Mar 2024 | 12 Siglap Link #11-12(Stack 12) | 678 | 370,500 | 22 Apr 2017 | 2,522 | 4.5 |
15 Feb 2022 | 12 Siglap Link #08-07(Stack 7) | 786 | 406,400 | 22 Apr 2017 | 1,760 | 5.8 |
3 Dec 2021 | 12 Siglap Link #11-07(Stack 7) | 786 | 436,190 | 20 Apr 2017 | 1,688 | 6.3 |
28 Jul 2022 | 12 Siglap Link #17-07(Stack 7) | 786 | 436,840 | 20 Apr 2017 | 1,925 | 5.2 |
23 Nov 2022 | 12 Siglap Link #09-07(Stack 7) | 786 | 450,140 | 22 Apr 2017 | 2,041 | 5.4 |
27 May 2024 | 12 Siglap Link #15-07(Stack 7) | 786 | 623,100 | 20 Apr 2017 | 2,594 | 5.4 |
Stack 7 came out ahead, and the sea view clearly won here. The average profit for Stack 7 was $408,015, while for Stack 12 it was only $244,398.
Notably, the premium gap for Stack 7 (sea view) widened over time. In early sales (2020-2021), the profits for both stacks were closer, ranging from $160,000 to $335,000. But by 2024, Stack 7 saw record-high profits, hitting $623,100 (#15-07), while Stack 12 maxed out at $370,500 (#11-12).
So the profit difference widened from around $50,000 in earlier years to over $250,000 in recent years. But we need to add the caveat, once again, that the sea view units had two bathrooms, whereas the landed view units had a single bathroom, and this could again have been a contributing factor.
Now let’s look at three-bedder units
For these units, there is a notable discrepancy besides the views. Namely, the three-bedders facing the landed estate tend to be smaller, while the ones with the sea view tend to be larger. This size difference could add another factor to overall performance, besides just the view.
Let’s start our three-bedder comparison with Block 18 (Stack 29 and Stack 31)
Stack 29 gets the sea view, while Stack 31 gets the landed view. Besides this though, Stack 31 does have access to a private lift.

Date | Size (sqft) | $PSF | Price | Address | $PSF difference |
29 Nov 2020 | 1,259 | 1,714 | 2,158,800 | 18 Siglap Link #05-29(Stack 29) | 7.33% |
20 Apr 2018 | 1,087 | 1,597 | 1,736,000 | 18 Siglap Link #05-31(Stack 31) | |
7 Mar 2020 | 1,259 | 1,714 | 2,158,800 | 18 Siglap Link #06-29(Stack 29) | 10.72% |
11 Mar 2018 | 1,087 | 1,548 | 1,683,000 | 18 Siglap Link #06-31(Stack 31) | |
15 Oct 2018 | 1,259 | 1,964 | 2,473,500 | 18 Siglap Link #12-29(Stack 29) | 13.79% |
18 Mar 2018 | 1,087 | 1,726 | 1,876,000 | 18 Siglap Link #12-31(Stack 31) | |
21 Apr 2019 | 1,259 | 1,963 | 2,472,000 | 18 Siglap Link #13-29(Stack 29) | 15.67% |
23 Dec 2017 | 1,087 | 1,697 | 1,845,000 | 18 Siglap Link #13-31(Stack 31) |
Stack 29 (sea view) was consistently priced higher. The premium gap on the lower floors (5th to 6th) was about seven to 10 per cent, but this rose to 14 to 15 per cent on the higher floors.
It’s likely that below the 8th floor, the view didn’t clear the treeline (sea view) or school (landed view), so perhaps buyers didn’t perceive too much of a difference in view quality; but from the higher floor onwards, the sea/landed preference was more pronounced.
Now let’s compare gains between Stacks 29 and 31:

Sold On | Address | Area (sqft) | Profit (S$) | Bought On | Days | Annualised (%) |
8 Mar 2021 | 18 Siglap Link #13-31(Stack 31) | 1,087 | 123,000 | 23 Dec 2017 | 1,171 | 2 |
26 Jul 2022 | 18 Siglap Link #09-29(Stack 29) | 1,259 | 237,250 | 24 Jun 2019 | 1,128 | 3.1 |
2 Oct 2024 | 18 Siglap Link #23-31(Stack 31) | 1,087 | 543,400 | 17 Sep 2020 | 1,476 | 5.8 |
29 May 2024 | 18 Siglap Link #16-31(Stack 31) | 1,087 | 650,000 | 14 Mar 2018 | 2,268 | 4.9 |
20 Sep 2023 | 18 Siglap Link #10-29(Stack 29) | 1,259 | 663,888 | 6 Apr 2019 | 1,628 | 5.6 |
4 Jul 2024 | 18 Siglap Link #16-29(Stack 29) | 1,259 | 679,500 | 29 Sep 2018 | 2,105 | 4.2 |
9 Sep 2024 | 18 Siglap Link #07-31(Stack 31) | 1,087 | 702,888 | 7 Apr 2018 | 2,347 | 5.4 |
30 Apr 2024 | 18 Siglap Link #06-29(Stack 29) | 1,259 | 861,200 | 7 Mar 2020 | 1,515 | 8.4 |
Stack 29 generally performed better. The average profit for Stack 29 was $504,822, while for Stack 31, it was $504,488; a small but noticeable difference.
In terms of the highest recorded profit though, the winner was in Stack 29 (#06-29), which saw a profit of $861,200. In contrast, the top profit in Stack 31 was from #07-31, at $702,888.
Speculatively, the private lift may have contributed to lower gains for Stack 31. Private lifts are considered a luxury feature, and not all buyers will find the added cost of a private lift to be justifiable; this could cool demand from certain buyers.
Three-bedder units, Block 12 (Stack 9 and Stack 11)
Stack 9 has a sea view, while Stack 11 has a landed view.

Date | Size (sqft) | $PSF | Price | Address | $PSF difference |
25 Nov 2020 | 1,259 | 1,713 | 2,157,960 | 12 Siglap Link #02-09(Stack 9) | 15.28% |
6 Oct 2017 | 1,087 | 1,486 | 1,615,000 | 12 Siglap Link #02-11(Stack 11) | |
6 Jan 2018 | 1,259 | 1,594 | 2,007,000 | 12 Siglap Link #03-09(Stack 9) | 7.78% |
13 May 2017 | 1,087 | 1,479 | 1,608,000 | 12 Siglap Link #03-11(Stack 11) | |
22 Apr 2017 | 1,259 | 1,649 | 2,076,620 | 12 Siglap Link #09-09(Stack 9) | 6.25% |
22 Apr 2017 | 1,087 | 1,552 | 1,687,560 | 12 Siglap Link #09-11(Stack 11) | |
22 Apr 2017 | 1,259 | 1,659 | 2,089,360 | 12 Siglap Link #10-09(Stack 9) | 6.21% |
22 Apr 2017 | 1,087 | 1,562 | 1,698,340 | 12 Siglap Link #10-11(Stack 11) | |
22 Apr 2017 | 1,259 | 1,720 | 2,165,800 | 12 Siglap Link #16-09(Stack 9) | 6.04% |
22 Apr 2017 | 1,087 | 1,622 | 1,763,020 | 12 Siglap Link #16-11(Stack 11) | |
22 Apr 2017 | 1,259 | 1,758 | 2,213,820 | 12 Siglap Link #17-09(Stack 9) | 4.15% |
22 Apr 2017 | 1,087 | 1,688 | 1,835,000 | 12 Siglap Link #17-11(Stack 11) | |
22 Apr 2017 | 1,259 | 1,856 | 2,337,300 | 12 Siglap Link #23-09(Stack 9) | 6.12% |
10 Sep 2017 | 1,087 | 1,749 | 1,901,000 | 12 Siglap Link #23-11(Stack 11) | |
22 Apr 2017 | 1,259 | 1,872 | 2,357,880 | 12 Siglap Link #24-09(Stack 9) | 3.31% |
7 Jan 2018 | 1,087 | 1,812 | 1,970,000 | 12 Siglap Link #24-11(Stack 11) |
Across all transactions, Stack 9 had a higher price per psf compared to Stack 11.The price difference between the two started at around $40,950 in 2018, and grew to $53,350 by 2021, so the sea view was clearly prized over the landed view.
Now let’s compare the gains between Stacks 9 and 11

Sold On | Address | Area (sqft) | Profit (S$) | Bought On | Days | Annualised (%) |
6 Nov 2019 | 12 Siglap Link #01-11(Stack 11) | 1,087 | 9,060 | 22 Apr 2017 | 928 | 0.2 |
15 Mar 2021 | 12 Siglap Link #17-09(Stack 9) | 1,259 | 236,180 | 22 Apr 2017 | 1,423 | 2.6 |
12 Aug 2020 | 12 Siglap Link #23-09(Stack 9) | 1,259 | 242,700 | 22 Apr 2017 | 1,208 | 3 |
5 May 2021 | 12 Siglap Link #22-11(Stack 11) | 1,087 | 303,000 | 4 Nov 2017 | 1,278 | 4.2 |
18 Jan 2021 | 12 Siglap Link #08-09(Stack 9) | 1,259 | 311,590 | 22 Apr 2017 | 1,367 | 3.9 |
11 Mar 2021 | 12 Siglap Link #19-09(Stack 9) | 1,259 | 325,020 | 22 Apr 2017 | 1,419 | 3.5 |
12 Apr 2021 | 12 Siglap Link #16-11(Stack 11) | 1,087 | 336,980 | 22 Apr 2017 | 1,451 | 4.5 |
17 Jun 2022 | 12 Siglap Link #20-11(Stack 11) | 1,087 | 412,000 | 23 Apr 2017 | 1,881 | 3.9 |
20 May 2021 | 12 Siglap Link #18-09(Stack 9) | 1,259 | 433,600 | 22 Apr 2017 | 1,489 | 4.4 |
29 Sep 2023 | 12 Siglap Link #25-09(Stack 9) | 1,259 | 754,698 | 20 Apr 2017 | 2,353 | 4.4 |
20 Jun 2024 | 12 Siglap Link #06-11(Stack 11) | 1,087 | 765,000 | 9 May 2017 | 2,599 | 5.5 |
Stack 9 (the sea view) did a bit better. Its units often required a shorter holding period for strong returns, compared to Stack 11. For example, #18-09 (sold in May 2021, held 1,489 days) had a $433,600 profit, and 4.4 per cent annualised returns.
#06-11 had a seemingly more impressive profit of $765,000, and an annualised return of 5.5 per cent; but it was sold in June 2024 and had to be held for 2,599 days.
In terms of pure profitability though, both stacks are quite closely matched, with some units on both sides showing comparable gains.
Finally, let’s look at four-bedder units
For this, we’ll be looking at Block 16 (Stack 17 and 19). Stack 17 gets the sea view, and Stack 19 gets the landed view. Note that four-bedders start from the 17th floor onward, so they all clear the treeline and school.

Date | Size (sqft) | $PSF | Price | Address | $PSF difference |
22 Apr 2017 | 1,679 | 1,679 | 2,819,520 | 16 Siglap Link #17-17(Stack 17) | 7.63% |
22 Apr 2017 | 1,485 | 1,560 | 2,317,590 | 16 Siglap Link #17-19(Stack 19) | |
22 Apr 2017 | 1,679 | 1,701 | 2,856,150 | 16 Siglap Link #18-17(Stack 17) | 8.14% |
22 Apr 2017 | 1,485 | 1,573 | 2,336,400 | 16 Siglap Link #18-19(Stack 19) | |
22 Apr 2017 | 1,679 | 1,749 | 2,936,340 | 16 Siglap Link #21-17(Stack 17) | 7.50% |
5 May 2017 | 1,485 | 1,627 | 2,417,000 | 16 Siglap Link #21-19(Stack 19) | |
31 May 2018 | 1,679 | 2,096 | 3,520,000 | 16 Siglap Link #22-17(Stack 17) | 12.15% |
30 Apr 2018 | 1,485 | 1,869 | 2,777,000 | 16 Siglap Link #22-19(Stack 19) | |
12 Jan 2019 | 1,679 | 2,127 | 3,571,200 | 16 Siglap Link #25-17(Stack 17) | 11.13% |
2 Oct 2018 | 1,485 | 1,914 | 2,843,070 | 16 Siglap Link #25-19(Stack 19) | |
12 Jan 2019 | 1,679 | 2,144 | 3,600,000 | 16 Siglap Link #26-17(Stack 17) | 12.25% |
18 Dec 2018 | 1,485 | 1,910 | 2,836,800 | 16 Siglap Link #26-19(Stack 19) |
Every transaction shows Stack 17 commanding a higher initial price than Stack 19. The price difference ranged from $58,950 to $72,325, proving a steady premium for sea views; in terms of price psf the gap ranged from 7.5 to 8.14 per cent. As the launch progressed, the price gap got wider, especially for same-level units in Stack 17 that sold at a later date than their counterparts in Stack 19.
Hence, buyers consistently paid more for the sea view from the start.
There haven’t been any four-bedders in Stack 17 sold on the secondary market. For Stack 19, only one unit has been sold, but it’s already changed hands twice.
Sold On | Address | Area (sqft) | Profit (S$) | Bought On | Days | Annualised (%) |
28 Mar 2024 | 16 Siglap Link #18-19(Stack 19) | 1,485 | 445,000 | 11 Jun 2021 | 1,021 | 5.1 |
11 Jun 2021 | 16 Siglap Link #18-19(Stack 19) | 1,485 | 628,600 | 22 Apr 2017 | 1,511 | 5.9 |
While we can’t draw many conclusions from this alone. But looking at the annualised returns of the various units above, we can see that an annualised gain of 5.1 to 5.9 per cent would be on the higher end.
In general, Seaside Residences’ sea view units have performed better.
Again, this isn’t to say the gains are purely due to the facing, as we’ll likely never have a comparison so ideal we can isolate such factors entirely. A few other quirks—such as a second bathroom, a slightly bigger unit, or a better layout—also affect the eventual gains.
But with that taken into account, the sea view units—across one, two, and three-bedders—have generally shown that a sea view unit might be a better choice here over the landed facings.
For home buyers, the real challenge isn’t spotting listings—it’s understanding what actually drives long-term value.
If you’ve found this breakdown helpful, we’ve done the same for many others who wanted data-backed insights before making their next move.
Thinking of buying soon? Schedule a session with our real estate consultants—we’d be happy to walk you through how this approach can help you narrow your options and buy with confidence.
Next, we’ll take a look at Clement Canopy; so if you live here or are interested in buying here, stay with us for the follow-up study on Stacked.
Ryan J
A seasoned content strategist with over 17 years in the real estate and financial journalism sectors, Ryan has built a reputation for transforming complex industry jargon into accessible knowledge. With a track record of writing and editing for leading financial platforms and publications, Ryan's expertise has been recognised across various media outlets. His role as a former content editor for 99.co and a co-host for CNA 938's Open House programme underscores his commitment to providing valuable insights into the property market.Read next from Property Investment Insights

Property Investment Insights They Paid A Premium For The Sea View (And Made $200K More): Inside Clement Canopy’s Resale Data

Property Investment Insights Selling Your Condo? This Overlooked Factor Could Quietly Undercut Your Selling Price

Property Investment Insights How Different Condo Views Affect Returns In Singapore: A 25-Year Study Of Pebble Bay

Property Investment Insights Can Leasehold Condos Deliver Better Returns Than Freehold? A 10-Year Data Study Says Yes
Latest Posts

Homeowner Stories Why We Chose A Walk-Up Apartment (Yes, With No Lift) For Our First Home

Landed Home Tours Inside Balmoral Park: Rare Freehold Landed Homes With 1.6 Plot Ratio In District 10

Singapore Property News New Record For Landed Home Prices In Singapore: It’s Like An A+ in The Least Important Exam

Homeowner Stories How a 57% Rent Spike Drove Flor Patisserie Out — And What It Says About Singapore’s Retail Scene

Property Trends Should You Wait For The Property Market To Dip? Here’s What Past Price Crashes In Singapore Show

Home Tours Inside A Minimalist’s Tiny Loft With A Stunning City View

On The Market 5 Most Affordable Newly MOP 4-Room HDB Flats From $585k

Property Market Commentary Distressed Property Sales Are Up In Singapore In 2025: But Don’t Expect Bargain Prices

Singapore Property News This $1.5M Bukit Timah Executive HDB Flat With 62-Years Lease Left Just Set A Record: Here’s Why

Editor's Pick Where To Find The Cheapest 2 Bedroom Resale Units In Central Singapore (From $1.2m)

Property Picks 19 Cheaper New Launch Condos Priced At $1.5m Or Less. Here’s Where To Look

Property Advice The Ultimate Work From Home Homebuyer Checklist (That Most People Still Overlook)

Editor's Pick These $4m Freehold Landed Homes In Joo Chiat Have A 1.4 Plot Ratio: What Buyers Should Know

Editor's Pick Now That GE2025 Is Over, Let’s Talk About The Housing Proposals That Didn’t Get Enough Scrutiny

Property Advice When ‘Bad’ Property Traits Can Be A Bargain For Homebuyers In Singapore
