Penrith Pricing Review: How It Compares To Nearby Resale And New Launches

Get The Property Insights Serious Buyers Read First: Join 50,000+ readers who rely on our weekly breakdowns of Singapore’s property market.

A seasoned content strategist with over 17 years in the real estate and financial journalism sectors, Ryan has built a reputation for transforming complex industry jargon into accessible knowledge. With a track record of writing and editing for leading financial platforms and publications, Ryan's expertise has been recognised across various media outlets. His role as a former content editor for 99.co and a co-host for CNA 938's Open House programme underscores his commitment to providing valuable insights into the property market.
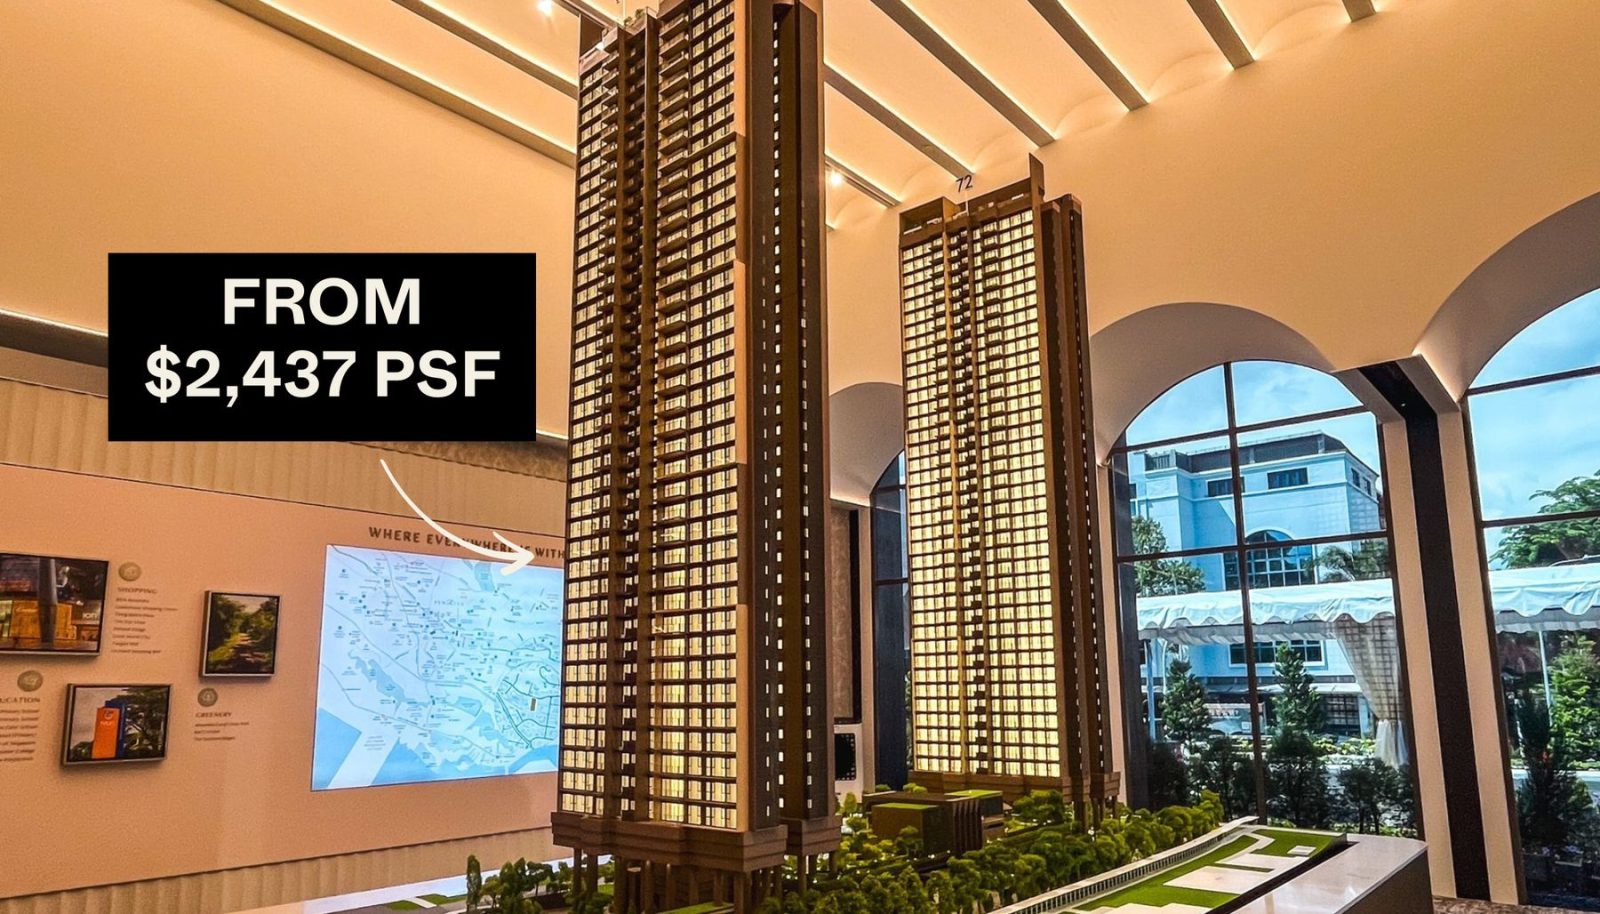
Penrith launches at $2,437 psf, making it the highest-priced project in Queenstown today. At first glance, this positions it above nearby comparables such as Queens Peak, Margaret Ville, and Stirling Residences. But the headline $PSF alone doesn’t tell the full story. Thanks to compact and efficient layouts, Penrith’s overall quantum remains competitive, with many two- and three-bedder units sitting squarely in the mid-range compared to its neighbours, while four-bedders are priced at levels that still look accessible by today’s standards.
On a broader scale, Penrith’s pricing is lower than several recent OCR and RCR launches. That’s significant: it means buyers who might otherwise have considered fringe or suburban projects now have the option of a city-fringe address at a comparable entry point. For HDB upgraders in Queenstown, Clementi, or Bukit Merah (many sitting on strong paper gains), that makes Penrith a viable opportunity to buy into a mature, well-connected neighbourhood.
This mix of “highest locally, but competitive regionally” makes Penrith less about whether buyers will pay a premium, and more about how they perceive value in today’s market. Is Penrith overpriced for Queenstown, or underpriced when measured against the wider pool of launches in 2025? Let’s take a closer look.
Quick Summary
- Penrith launches with starting prices from $2,437 psf, the highest in its immediate area but still competitive in overall quantum thanks to compact, efficient layouts.
- Compared to nearby resale projects like Queens Peak, Margaret Ville, and Stirling Residences, its two- and three-bedders are mid-priced, while the four-bedders remain relatively accessible.
- On a broader scale, Penrith’s pricing is lower than several recent OCR and RCR launches, giving it an edge for buyers seeking city-fringe convenience at a lower entry point.
- With limited new supply in D3 and strong upgrader demand from nearby Queenstown HDB owners, the project stands out as a rare new launch in a mature, well-connected neighbourhood.
Our key considerations when looking at Penrith’s pricing
These are the main issues we’ll take into consideration:
- District performance: How District 3 (D3) and the broader market have performed across different market segments and tenures.
- Resale comparisons: How Penrith’s potential launch prices might stack up against resale projects around Margaret Drive.
- Nearest competitor check: How Penrith’s layouts and pricing compare to its closest new-launch alternative.
- New launch context by bedroom type: Where Penrith’s two-, three-, and four-bedders sit within today’s broader market, in both $PSF and quantum.
- Exit strategies: What potential outcomes look like at the point of resale.
These are the indicative starting prices for Penrith
Unit type | Estimated size (sq ft) | Indicative starting price | Indicative starting $PSF |
2 Bedroom | 614 – 678 | $1,495,000 | $2,437 |
3 Bedroom | 786 – 1,066 | $1,973,000 | $2,511 |
4 Bedroom | 1,173 – 1,281 | $3,078,000 | $2,623 |
District Performance
Now let’s see how condos in District 3 have performed over the past decade compared to the rest of Singapore. This includes all transaction types: new, subsale, and resale.
All tenures
Year | D3 | All non-landed private properties |
2014 | $1,652 | $1,289 |
2015 | $1,569 | $1,180 |
2016 | $1,610 | $1,232 |
2017 | $1,686 | $1,304 |
2018 | $1,759 | $1,435 |
2019 | $1,962 | $1,560 |
2020 | $2,004 | $1,513 |
2021 | $2,042 | $1,600 |
2022 | $2,292 | $1,712 |
2023 | $2,259 | $1,869 |
2024 | $2,200 | $1,886 |
Annualised | 2.91% | 3.88% |

At an annualised gain of 2.91 per cent, District 3 falls slightly below the overall market’s 3.88 per cent per year. However, performance since 2021 has been more robust; possibly projects such as Stirling Residences and Margaret Ville have helped lift the district’s baseline.
Now let’s look at it in terms of leasehold and freehold projects:
99-year leasehold properties
Year | D3 | All non-landed private properties |
2014 | $1,661 | $1,195 |
2015 | $1,582 | $1,104 |
2016 | $1,626 | $1,166 |
2017 | $1,702 | $1,230 |
2018 | $1,771 | $1,359 |
2019 | $1,973 | $1,474 |
2020 | $2,018 | $1,453 |
2021 | $2,075 | $1,517 |
2022 | $2,312 | $1,595 |
2023 | $2,296 | $1,783 |
2024 | $2,214 | $1,854 |
Annualised | 2.92% | 4.49% |

At 2.92 per cent, D3’s leasehold properties notably trail the national average of 4.49 per cent. This is likely due to properties here already being quite pricey, thus having less room for big percentage gains.
999-year/freehold properties
Year | D3 | All non-landed private properties |
2014 | $1,436 | $1,505 |
2015 | $1,407 | $1,438 |
2016 | $1,329 | $1,470 |
2017 | $1,368 | $1,501 |
2018 | $1,491 | $1,617 |
2019 | $1,517 | $1,797 |
2020 | $1,536 | $1,688 |
2021 | $1,513 | $1,812 |
2022 | $1,941 | $1,995 |
2023 | $1,784 | $2,111 |
2024 | $1,908 | $2,003 |
Annualised | 2.88% | 2.90% |

For freehold projects, D3 saw prices move almost in lockstep with the wider market average, at 2.88 per cent versus 2.9 per cent. This segment has shown a steadier but slower appreciation pattern compared to leasehold counterparts.
Resale Benchmarks
Next, let’s look at how Penrith compares to nearby projects; both leasehold and freehold. These are based on resale and sub sale transactions from 2024 to June 2025.
Project | Completion year | Tenure | No. of units | Unit mix | Avg size | Avg $PSF |
QUEENS | 2002 | 99-year | 722 | 2, 3, 4 | 1209 | $1,714 |
ALEXIS | 2012 | Freehold | 293 | 1, 2, 3 | 567 | $1,778 |
THE ANCHORAGE | 1997 | Freehold | 775 | 1, 2, 3, 4 | 1514 | $1,951 |
MARGARET VILLE | 2021 | 99-year | 309 | 1, 2, 3, 4 | 834 | $2,169 |
QUEENS PEAK | 2020 | 99-year | 736 | 1, 2, 3, 4, 5 | 745 | $2,195 |
COMMONWEALTH TOWERS | 2017 | 99-year | 845 | 1, 2, 3, 4 | 648 | $2,205 |
STIRLING RESIDENCES | 2022 | 99-year | 1259 | 1, 2, 3, 4 | 683 | $2,344 |
PENRITH | Starting from $2,437 |
One quality of D3 is that it has a good mix of both 99-year and freehold projects. This is quite different from CCR districts (dominated by freehold) and OCR districts (dominated by leasehold).
Most of the 99-year developments are relatively young, completed within the past decade. The freehold ones tend to be older, and many date back to the ‘90s and early ‘00s.
The majority of D3 condos are larger projects with more than 700 units, offering a wide range of layouts from one-bedders to larger five-bedders.
With a starting price of $2,437 psf, Penrith will hold the highest $PSF in the area. However, given that many older projects have larger unit sizes, their overall quantum can be much higher than Penrith.
So to get a clearer picture, let’s break down the comparisons by unit type.
The following data is based on sub sale and resale transactions from 2024 to June 2025.
2-bedroom units
Project | Avg $PSF | Avg price | No. of tnx |
ALEXIS | $1,623 | $1,138,250 | 4 |
QUEENS PEAK | $2,124 | $1,470,200 | 15 |
PENRITH | Starting from $1,495,000 | ||
STIRLING RESIDENCES | $2,334 | $1,554,554 | 106 |
MARGARET VILLE | $2,165 | $1,587,398 | 12 |
QUEENS | $1,749 | $1,600,000 | 1 |
COMMONWEALTH TOWERS | $2,274 | $1,655,214 | 14 |
THE ANCHORAGE | $1,971 | $2,390,000 | 3 |
3-bedroom units
Project | Avg $PSF | Avg price | No. of tnx |
QUEENS PEAK | $2,205 | $1,945,603 | 28 |
PENRITH | Starting from $1,973,000 | ||
QUEENS | $1,708 | $2,037,614 | 21 |
MARGARET VILLE | $2,182 | $2,056,489 | 10 |
COMMONWEALTH TOWERS | $2,271 | $2,257,626 | 11 |
STIRLING RESIDENCES | $2,423 | $2,388,548 | 14 |
THE ANCHORAGE | $1,947 | $3,062,429 | 14 |
4-bedroom units
Project | Avg $PSF | Avg price | No. of tnx |
QUEENS | $1,747 | $2,463,629 | 3 |
MARGARET VILLE | $2,180 | $2,581,555 | 5 |
COMMONWEALTH TOWERS | $2,250 | $2,930,000 | 2 |
PENRITH | Starting from $3,078,000 | ||
QUEENS PEAK | $2,170 | $3,270,000 | 1 |
STIRLING RESIDENCES | $2,498 | $3,360,750 | 4 |
Across all unit types, Penrith’s pricing keeps it in the middle of the pack:
Its two- and three-bedroom units are competitively priced against nearby resale options such as Margaret Ville, Queens Peak, and Commonwealth Towers. The four-bedroom units, while carrying a higher $PSF, maintain a lower overall price (Quantum) compared to larger counterparts like The Anchorage, Queens, and Stirling Residences, where overall prices often exceed $3 million.
Overall, Penrith sits above older resale developments like Queens and The Anchorage, but below the top benchmarks set by Stirling Residences.
Let’s now take a look at how unit sizes compare across nearby projects.
We’ll use the minimum size of each unit type to compare. Take note that Penrith is a post-GFA harmonisation project, which means its total square footage does not include unliveable spaces like air-con ledges. This can make it appear slightly smaller than older resale units, which will include spaces such as strata void space, air-con ledges, etc.
2-bedroom units
Project | Min. size (sqft) |
ALEXIS | 592 |
PENRITH | 614 |
QUEENS PEAK | 624 |
STIRLING RESIDENCES | 624 |
MARGARET VILLE | 635 |
COMMONWEALTH TOWERS | 689 |
QUEENS | 915 |
THE ANCHORAGE | 1,044 |
3-bedroom units
Project | Min. size (sqft) |
PENRITH | 786 |
QUEENS PEAK | 807 |
STIRLING RESIDENCES | 883 |
COMMONWEALTH TOWERS | 904 |
MARGARET VILLE | 915 |
ALEXIS | 969 |
QUEENS | 1,012 |
THE ANCHORAGE | 1,378 |
4-bedroom units
Project | Min. size (sqft) |
MARGARET VILLE | 1,130 |
PENRITH | 1,173 |
COMMONWEALTH TOWERS | 1,302 |
STIRLING RESIDENCES | 1,346 |
QUEENS | 1,410 |
QUEENS PEAK | 1,507 |
THE ANCHORAGE | 2,077 |
Penrith is generally on the smaller end of the scale, though not always the smallest.
Two-bedders start from 614 sq ft, which is larger than Alexis (592 sq ft) but very slightly smaller than Queens Peak and Stirling Residences (624 sq ft).
Penrith’s three-bedders, at 786 sq ft, are the smallest on the list. Three-bedders Queens Peak start from 807 sq ft, while Stirling Residences and Commonwealth Towers start from 883 and 904 sq ft, respectively.
For the four-bedroom units, Penrith’s minimum size of 1,173 sq ft places it just above Margaret Ville’s 1,130 sq ft, but smaller than Commonwealth Towers (1,302 sq ft) and Stirling Residences (1,346 sq ft).
It’s certainly an advantage that Penrith doesn’t follow older projects like Queens and The Anchorage, which go well beyond 1,400 and even 2,000 sq ft. These older, oversized units would price it well beyond the range of most Singaporeans.
Based on unit sizes and average pricing, Queens Peak stands out as the closest resale comparison against Penrith.
Let’s take a look at how Queens Peak has been performing so far. This includes all resale and sub sale transactions:
Gains
Description | 1BR | 2BR | 3BR | 4BR | 5BR | Entire Project (Average) |
Average gains | $181,310 | $232,911 | $324,244 | $403,568 | $1,028,944 | $434,195 |
Average purchase price | $772,068 | $1,140,739 | $1,536,571 | $2,499,632 | $3,136,056 | $1,817,013 |
ROI | 23.75% | 20.78% | 21.31% | 16.08% | 32.91% | 22.97% |
No. of tnx | 79 | 42 | 66 | 5 | 2 | 194 (total) |
Average holding period (years) | 5.8 | 5.5 | 5.5 | 4.2 | 7.5 | 5.7 |
The five-bedders delivered the highest ROI at 32.91 per cent, followed – quite surprisingly – by the one-bedders at 23.75 per cent. The two- and three-bedroom units posted relatively similar returns of about 21 per cent, while the four-bedders recorded the lowest ROI at 16.08 per cent.
There have been no unprofitable transactions at Queens Peak.
Let’s compare the floor plans for each bedroom type:

Both the two-bedders at Penrith and Queens Peak are roughly the same size; but since Penrith is a post-harmonisation project, the amount of liveable space may actually be a bit bigger.
Both layouts are two-bed, one-bath types. The living and dining areas are separate, and while Penrith’s dining area shares space with the kitchen, it’s wider and may feel more spacious. Both use an L-shaped open kitchen tucked neatly in a corner, which makes good use of space.
The master bathrooms in both are Jack and Jill layouts, opening to the common area. This is practical for a compact unit..
The main design difference is the balcony. Queens Peak’s balcony is oddly shaped thanks to the tower’s curves, while Penrith’s is more regular; that’s generally easier to furnish.
That said, Penrith’s two-bedders start higher in price than a comparable Queens Peak unit on the 25th floor. But the premium may be fair for a newer project, especially since some Queens Peak stacks face the MRT track.

Again, Penrith’s GFA is harmonised, so it may look smaller on paper, but the actual liveable space may be comparable to Queens Peak.
Both are three-bed, two-bath layouts. Penrith goes with a more conventional design, while Queens Peak uses a dumbbell layout with bedrooms on opposite sides of the living area. Both have clearly separated living and dining spaces.
Penrith comes with an enclosed kitchen, while the kitchen in Queens Peak is open but can be enclosed if preferred. Queens Peak also has two balconies – one in the living room and another in the master bedroom – while Penrith keeps it simpler with a single balcony in the living area.
All three bedrooms in both layouts can fit double beds. As before, Queens Peak’s balconies are irregularly shaped due to the building design, while Penrith’s are regular and easier to furnish.
Once again, Penrith’s starting price for a three-bedder is higher than a comparable Queens Peak unit, on account of it being the newer project.

The smallest four-bedder in Penrith is considerably smaller than the one in Queens Peak. Penrith’s version is a four-bed, two-bath layout, while Queens Peak’s is a four-bed, three-bath unit that also comes with a private lift and an additional family room.
Penrith sticks to a conventional layout, whereas Queens Peak uses a dumbbell configuration. Both have nicely segregated living and dining areas. The balcony in Penrith spans the width of the living room, while the one in Queens Peak extends further, connecting the living area to an adjacent bedroom.
Both kitchens include a store/utility room and a WC, but the utility room in Queens Peak can be accessed from the bedroom hallway; it’s flexible enough to double as a study or helper’s room. All four bedrooms in both units can fit double beds, though Penrith’s master suite has a walk-in wardrobe, which Queens Peak lacks.
Given the size difference, Queens Peak’s four-bedder naturally costs more. Penrith may actually appeal more to buyers today, simply because its smaller size is still spacious but keeps the quantum affordable.
Now let’s take a look at Penrith’s prices compared to recent new launches (as of September 2025)
Project | Tenure | District | Average $PSF for new sale transactions | Average developer’s profit margin (based on average $PSF) | Average quantum |
Canberra Crescent Residences | 99-year | 27 | $1,985 | 29.25% | $1,615,551 |
Faber Residence | 99-year | 5 | Starting from $1,995 | ||
Springleaf Residence | 99-year | 26 | $2,176 | 28.90% | $1,847,722 |
Penrith | Starting from $2,437 | ||||
Lyndenwoods | 99-year | 5 | $2,462 | – | $2,262,991 |
Bloomsbury Residences | 99-year | 5 | $2,503 | 20.57% | $1,927,345 |
ELTA | 99-year | 5 | $2,548 | 18.18% | $2,090,020 |
Skye At Holland | 99-year | 10 | Starting from $2,598 | ||
One Marina Gardens | 99-year | 1 | $2,952 | 25.02% | $1,953,295 |
Aurea | 99-year | 7 | $2,964 | – | $3,318,410 |
Promenade Peak | 99-year | 9 | $2,969 | 33.19% | $2,582,522 |
Arina East Residences | Freehold | 15 | $2,983 | 26.29% | $2,541,822 |
River Green | 99-year | 9 | $3,120 | 38.19% | $2,007,283 |
Meyer Blue | Freehold | 15 | $3,230 | – | $3,408,917 |
Upperhouse at Orchard | 99-year | 10 | $3,305 | – | $2,768,831 |
W Residences Marina View | 99-year | 1 | $3,344 | – | $3,417,500 |
The Robertson Opus | 999-year | 9 | $3,356 | – | $2,917,685 |
At a starting price of about $2,437 psf, Penrith is at the lower end of today’s new-launch range, below many other projects in both the RCR and (in some cases even the OCR).
Lower than Penrith, we see Canberra Crescent Residences at around $1,985 psf, while Faber Residence starts from about $1,995 psf. Also below are Springleaf Residence and Lyndenwoods, whilst Bloomsbury Residences is very close ($2,503 psf.)
Most of the pricier projects are, unsurprisingly, the CCR new launches like One Marina Gardens, Aurea, Promenade Peak, and River Green.
Meyer Blue, Upperhouse at Orchard, W Residences Marina View, and The Robertson Opus are all much higher, but that’s also because these are freehold projects.
More from Stacked
7 Reasons Reflections at Keppel Bay Underperformed—Despite Its Iconic Design and Prime Waterfront Location
In this Stacked Pro breakdown:
This can make Penrith quite attractive in today’s new launch context
Based on the indicative starting $PSF of $2,437, Penrith is priced under several RCR projects and even a few OCR ones; an alluring prospect for a D3 condo near the city centre.
Even when comparing against Bloomsbury Residences ($2,503 psf) and ELTA ($2,548 psf), Penrith still looks competitive. Developers’ profit margins across the latest launches range from about 18 to 38 per cent, with an average of roughly 27 per cent, which could leave a bit of wiggle room for pricing in initial launch phases.
While this comparison mixes Penrith’s indicative starting prices with average transacted psf for other launches, the main point remains: Penrith is one of the more reasonably priced RCR offerings in late 2025.
Let’s now take a look at Penrith’s minimum launch prices, compared with the other new projects today.


Going by minimum price, Penrith’s sits in the low to mid range among current new launches.
While there aren’t any other fresh launches in D3 right now, buyers shortlisting Penrith are likely to also consider Skye at Holland.
Despite one being in the RCR and the other in the CCR, the two projects are close enough – both geographically and in launch timing – that they’ll be seen as viable alternatives to each other. The difference in their starting $PSF isn’t massive either, which makes the comparison even more relevant.
Let’s take a look at their floor plans and prices next.
A note on bedroom sizes:
This isn’t easily seen in the floor plans, but in all of the following, Penrith’s master bedrooms are slightly larger than Skye at Holland. Penrith’s master bedrooms are about 96.8 sq ft, while Skye at Holland’s are about 86.1 sq ft. Not a huge difference, we know, but it’s worth pointing out.

Both Penrith and Skye at Holland offer two-bed, one-bath layouts, and their overall sizes are close, with Penrith being just a bit larger.
Penrith goes with a conventional layout, while Skye at Holland uses a dumbbell configuration, with bedrooms flanking the living area. Both the living and dining areas are clearly divided. Penrith’s dining area may feel a bit more spacious since it’s wider, even though it shares space with the kitchen. Both have open kitchens tucked along one wall.
The master bathrooms in both are Jack and Jill style, opening to the common area; this is practical for a smaller unit. Each unit also has a balcony connected to the living area; not everyone considers balconies a good use of space in smaller units, but they do provide good ventilation.
With starting prices for both projects sitting fairly close, we don’t see either project having a clear edge here. And while Penrith is a little bigger, Skye at Holland does have a more prestigious D10 address, so they more or less balance out.

The three-bed, two-bath units at Skye at Holland are slightly larger than those at Penrith, though both use conventional layouts.
Both have clearly segregated living and dining areas, each with a balcony attached to the living room. The kitchen in Penrith is tucked neatly into a corner, while Skye at Holland’s kitchen sits beside the dining area for easier access and flow.
The key difference lies in the bathrooms. Skye at Holland’s common bathroom is a Jack and Jill setup, connecting to one of the common bedrooms – so effectively, it offers two ensuite bedrooms. Penrith’s layout keeps things simpler with a single ensuite master and a separate shared bathroom.
All three bedrooms in both units can comfortably fit double beds. The main entrance at Skye at Holland opens into a small foyer for added privacy, whereas Penrith’s opens directly into the living space.
Overall, Skye at Holland’s layout adds extra touches that improve daily convenience – the Jack and Jill bath, the foyer, and slightly more space. But its starting price is notably higher than Penrith’s, which balances out the two.
For buyers who prioritise value over address prestige, Penrith’s RCR location and lower entry price could be the more practical pick.

The four-bedders at Skye at Holland are slightly larger than those at Penrith. Both are four-bed, two-bath layouts, but Skye adds a private lift, a luxury touch that might matter to some buyers.
In both layouts, the living and dining areas are well segregated, and each comes with a balcony attached to the living room. The kitchen in Penrith includes a yard, store, and WC, while Skye at Holland’s kitchen is split into wet and dry zones. The wet kitchen has its own yard, home shelter, and WC, which is a win for Skye at Holland.
All four bedrooms in both units can fit double beds. Penrith’s master bedroom includes a walk-in wardrobe, a feature that Skye’s layout lacks. Some buyers may consider this more practical than a private lift, and a better trade-off.
Skye at Holland’s starting price is notably higher, but aside from the private lift and dry kitchen, the overall layouts aren’t vastly different. For buyers who don’t prioritise those extra features, Penrith offers better price efficiency.
A quick note on district locations
On a practical basis, we can say both Penrith and Skye at Holland are very close in terms of accessibility and convenience. However, it may matter to some that D10 carries more historical prestige. This is a subjective element, and there’s no accurate way to gauge its immediate or future impact.
Buyer Profile and Exit Strategies
Let’s first take a look at the potential buyer pool for Penrith.
It’s worth pointing out that Queenstown has long been one of the pricier HDB towns in Singapore, and that could make a big impact. Someone selling a 4-room or 5-room flat in Queenstown will probably have an easier time making the jump to a private property; and Penrith might represent a good option for a Queenstown seller who doesn’t want to move too far.
But of course, not all buyers will just be from Queenstown. So here’s a look at who has bought D3 properties since 2020, and what sort of property they previously came from:
Year | HDB | Unknown | Private | % HDB Upgraders | % of existing private property owners |
2020 | 367 | 188 | 521 | 34% | 48% |
2021 | 350 | 139 | 707 | 29% | 59% |
2022 | 315 | 83 | 713 | 28% | 64% |
2023 | 247 | 34 | 460 | 33% | 62% |
2024 | 222 | 7 | 423 | 34% | 65% |
The proportion of HDB upgraders buying into D3 has stayed consistent and significant, hovering between 28 and 34 per cent over the previous years. However, the share of buyers who came from the private market has risen sharply, from around 48 per cent in 2020 to 65 per cent in 2024.
This suggests that D3 is also attracting buyers who are already condo owners, rather than just HDB upgraders. This is a good sign for future resale prospects, showing D3 draws both private as well as HDB upgraders.
Let’s now take a look at the price range that HDB upgraders are buying into, to see if Penrith is affordable to them.
Price range | No. of transactions (done between 2024 to June 2025) |
Under $1M | 27 |
Between $1M – $1.5M | 84 |
Between $1.6M – $2M | 117 |
Between $2.1M – $2.5M | 50 |
Between $2.6M – $3M | 24 |
Above $3M | 16 |

Most HDB upgraders buying private properties in D3 fall within the $1.6 million to $2 million range. However, we also saw a significant number of deals (84 in total) between $1 million and $1.5 million.
Based on resale data and new launch indicative prices, these buyers are mainly picking up two- and three-bedroom units; the most accessible entry points into private housing in D3.
Penrith’s starting prices for three-bedders sit comfortably within this range, while its two-bedders are actually priced slightly lower. So we can say that Penrith is priced within range for HDB upgraders. It’s especially good for those who need to get into the RCR without over-stretching.
Now, let’s look at the possible exit strategy for Penrith buyers
Before diving into resale or rental prospects, we’ll first look at the overall unit supply across Singapore. This helps gauge how Penrith’s unit mix fits into broader market demand. Here’s the estimated unit supply across Singapore as of 2025:
Bedrooms | CCR | RCR | OCR |
1BR | 18% | 17% | 9% |
2BR | 28% | 30% | 24% |
3BR | 36% | 43% | 52% |
4BR | 17% | 9% | 13% |
5BR | 1% | 1% | 2% |
Across all regions, three-bedders form the largest proportion of homes, but the OCR has the highest share, at more than half of total units. In contrast, the OCR has the lowest number of one- and two-bedders compared to the RCR and CCR, where smaller units are more common.
This difference matters for exit planning. Penrith’s compact two- and three-bedders sit right in the middle of that spectrum: small enough to attract investors and upgraders from the OCR, but still within the RCR price and location bracket.
Let’s zoom in closer on the immediate location of Penrtih:
No. of bedrooms | 1BR | 2BR | 3BR | 4BR | 5BR |
Percentage of unit supply in the vicinity of Perith (includes only resale projects that we were looking at at the beginning of the article) against the supply in D3 (estimated) | 43% | 34% | 37% | 24% | 48% |
In D3 specifically, three-bedroom units make up the bulk of supply, followed by two-bedders; still broadly in line with the RCR average. The mix of units in the immediate vicinity of Penrith also mirrors this distribution.
Interestingly, the share of one- and five-bedroom units nearby makes up a substantial proportion of D3’s total supply. This creates a notable gap in the mid-sized segments, like the two and three-bedders.
Now we can understand why the developer used this particular unit mix for Penrith:
Unit type | Estimated size (sqft) | Number of units | Unit breakdown |
2 Bedroom | 614 | 76 | |
2 Bedroom Premium | 678 | 78 | 33.33% |
3 Bedroom | 786 – 850 | 117 | |
3 Bedroom Premium | 936 – 1066 | 77 | 41.99% |
4 Bedroom | 1173 | 76 | |
4 Bedroom Premium | 1281 | 38 | 24.68% |
Penrith itself is made up mostly of three-bedroom units, with two-bedders following right behind. This is a mix that nearly plugs the gap for mid-sized units in the area.
So we know the supply is reasonably well-catered to the demand. Now we need to look at the resale performances of these unit types in D3:
This includes resale and sub sale transactions.
Year | 1-bedroom average $PSF | 2-bedroom average $PSF | 3-bedroom average $PSF | 4-bedroom average $PSF | 5-bedroom average $PSF |
2014 | $1,729 | $1,653 | $1,556 | $1,613 | $1,672 |
2015 | $1,716 | $1,591 | $1,498 | $1,478 | $1,712 |
2016 | $1,674 | $1,631 | $1,540 | $1,495 | $1,618 |
2017 | $1,802 | $1,704 | $1,633 | $1,536 | $1,581 |
2018 | $1,873 | $1,810 | $1,691 | $1,713 | $1,644 |
2019 | $2,208 | $1,955 | $1,762 | $1,780 | $1,790 |
2020 | $2,163 | $2,047 | $1,843 | $1,803 | $1,529 |
2021 | $2,188 | $2,072 | $1,948 | $1,918 | |
2022 | $2,315 | $2,336 | $2,248 | $2,250 | $1,638 |
2023 | $2,323 | $2,255 | $2,244 | $2,142 | |
2024 | $2,232 | $2,273 | $2,125 | $1,999 | $1,816 |
Annualised | 2.59% | 3.24% | 3.17% | 2.17% | 0.83% |
Looking at both resale and sub sale over the past decade, two-bedders in D3 have shown the strongest growth, with an annualised rate of about 3.24 per cent. Three-bedders have seen almost similar performance at 3.17 per cent.
This further affirms the supply gap for mid-sized two and three-bedders, which we pointed out above.
The larger four- and five-bedroom units have appreciated at a slower pace, around 2.17 per cent and 0.83 per cent respectively. Now, to some degree, this is due to their higher quantum, which leaves less room for percentage gains; but the slower pace also reflects a demand for smaller, more affordable family-sized (mid-sized) units in D3.
This trend is also widely consistent with what we’ve seen across the RCR, where compact family units tend to see more frequent resale activity, and better resilience in slower markets.
Now, let’s zoom in further and look at the profitability of different unit types in the projects around Penrith.
This includes only units that were purchased from 2014 onwards and sold between 2024 and June 2025.
2-bedroom units
Gains
Project | Average purchase price | Average sale price | Average gains | Average ROI | Average holding period (years) | No. of transactions |
QUEENS | $1,260,000 | $1,420,000 | $160,000 | 12.70% | 3.8 | 1 |
MARGARET VILLE | $1,311,736 | $1,550,985 | $239,249 | 18.02% | 5.1 | 22 |
QUEENS PEAK | $1,140,739 | $1,373,649 | $232,911 | 20.78% | 5.5 | 42 |
COMMONWEALTH TOWERS | $1,199,908 | $1,447,680 | $247,772 | 21.28% | 6.6 | 89 |
THE ANCHORAGE | $1,601,667 | $1,960,833 | $359,167 | 22.52% | 4.6 | 6 |
STIRLING RESIDENCES | $1,244,230 | $1,530,708 | $286,478 | 23.03% | 4.5 | 204 |
Average/total | $1,293,046 | $1,547,309 | $254,263 | 19.72% | 5.0 | 364 |
Losses
Project | Average purchase price | Average sale price | Average gains | Average ROI | Average holding period (years) | No. of transactions |
COMMONWEALTH TOWERS | $1,268,000 | $1,250,000 | -$18,000 | -1.42% | 4.2 | 1 |
ALEXIS | $1,243,750 | $1,086,250 | -$157,500 | -13.04% | 5.3 | 4 |
Average/total | $1,255,875 | $1,168,125 | -$87,750 | -7.23% | 4.8 | 5 |
Among the profitable two-bedder sales, average ROIs ranged from about 13 to 23 per cent. Stirling Residences and Commonwealth Towers were among the stronger performers, averaging around 21 to 23 per cent ROI. Even older developments like The Anchorage, though, achieved solid returns at around 22.5 per cent.
Looking at average sale prices, Penrith’s starting point of $1.495 million sits in the mid-range: higher than resale prices at Queens Peak and Commonwealth Towers, but still lower than newer or premium launches like Stirling Residences.
Overall, this puts Penrith in a good position. The transaction history suggests steady resale demand for two-bedders in D3, and this is one of the spaces Penrith is targeting with its price and unit mix.
3-bedroom units
Gains
Project | Average purchase price | Average sale price | Average gains | Average ROI | Average holding period (years) | No. of transactions |
ALEXIS | $1,360,000 | $1,600,000 | $240,000 | 17.65% | 3.4 | 1 |
QUEENS PEAK | $1,536,571 | $1,860,815 | $324,244 | 21.31% | 5.5 | 66 |
MARGARET VILLE | $1,651,573 | $2,014,746 | $363,173 | 22.07% | 5.0 | 17 |
QUEENS | $1,459,160 | $1,783,686 | $324,526 | 22.33% | 5.9 | 23 |
COMMONWEALTH TOWERS | $1,620,945 | $2,013,499 | $392,554 | 24.35% | 5.5 | 49 |
STIRLING RESIDENCES | $1,696,848 | $2,202,949 | $506,102 | 30.04% | 4.3 | 46 |
THE ANCHORAGE | $1,863,978 | $2,934,200 | $1,070,222 | 57.49% | 6.7 | 5 |
Average/total | $1,598,439 | $2,058,556 | $460,117 | 27.89% | 5.2 | 207 |
This was more volatile than the two-bedders. The average ROIs for profitable sales saw a wide range, between 18 to 57 per cent.
That said, most leasehold projects saw gains between 20 and 30 per cent, with standout performances from Stirling Residences (about 30 per cent) and The Anchorage, which achieved over 57 per cent on average.
Commonwealth Towers, Queens Peak, and Margaret Ville all recorded returns in the 21 to 24 per cent range, which may reflect the “truer” range for the typical project.
At a starting price of $1.973 million, Penrith’s three-bedders fall right in the mid-range compared to nearby leasehold projects. It is, once again, above older developments like Queens Peak, but below some of the newer launches.
Overall, transactions suggest D3’s three-bedders are among the most resilient unit types in recent years; and there’s potential for resale units to significantly outperform (as in the case of The Anchorage) in these family-sized-but-not-oversized layouts.
We do think there will be continued upgrader demand for some time, given the broader shortage of mid-sized homes in the RCR.
4-bedroom units
Gains
Project | Average purchase price | Average sale price | Average gains | Average ROI | Average holding period (years) | No. of transactions |
QUEENS | $1,852,500 | $2,145,000 | $292,500 | 15.68% | 7.6 | 2 |
QUEENS PEAK | $2,499,632 | $2,903,200 | $403,568 | 16.08% | 4.2 | 5 |
MARGARET VILLE | $2,130,672 | $2,569,531 | $438,859 | 20.76% | 4.2 | 9 |
COMMONWEALTH TOWERS | $2,102,133 | $2,611,667 | $509,533 | 24.25% | 5.5 | 9 |
STIRLING RESIDENCES | $2,278,429 | $3,206,143 | $927,714 | 40.64% | 5.3 | 7 |
Average/total | $2,172,673 | $2,687,108 | $514,435 | 23.48% | 5.4 | 32 |
Among recent profitable transactions, four-bedders in D3 saw average ROIs ranging from 16 to 41 per cent. The bigger swings in performance are common for these larger units, which have a high quantum and tend to transact less frequently.
Most of the profitable four-bedder transactions had longer holding periods, which is also common for units of this size (often purchased as long-term family homes). This also raises the gains.
That said, at a starting price of about $3.078 million, Penrith’s four-bedders sit at the higher end compared to its surrounding leasehold projects.
Given Penrith’s two- and three-bedders are priced in the mid-range relative to nearby projects, we feel those are the intended highlights. The four-bedders are more of an indulgence for pure owner-occupiers, who are probably less focused on gains.
Overall, the price is a compelling entry point for buyers looking at two or three-bedders, and who want a new launch in the RCR.
Now that we’ve looked at existing condos in the area, let’s consider upcoming new launches and how these might affect Penrith in future.

We see that two nearby plots have been earmarked for future residential development, while a large reserve site nearby remains unzoned (currently occupied by offices and schools).
Over time, the two residential plots will introduce new supply to the area, providing some future competition. The eventual impact on prices will depend on factors such as whether these are launched as public or private housing, and their launch prices relative to current developments. For now, it’s too early to tell, and all we know is that there will be alternatives in the future.
The same goes for the future reserve site. We don’t know how it will be used yet. If it’s converted to residential, it may further intensify competition. But if it’s developed for commercial purposes instead, it could bring more amenities, jobs, and convenience – all of which could boost the value of surrounding homes, including Penrith.
There are also upcoming BTO launches in the Alexandra and Bukit Merah areas, which may eventually contribute to a new wave of HDB upgraders. However, this is a long way down the road, given these flats also have a 10-year Minimum Occupation Period (MOP). We’ve also never seen how well Plus and Prime flats perform in the resale market, as it hasn’t happened yet; so we can’t make any real predictions on the impact.
Conclusion:
Over the past decade, the price growth of condos in D3 has lagged behind both the overall market and the broader RCR. But this slower growth also means the area may be relatively underpriced, setting the stage for catch-up potential.
At an indicative starting price of $2,437 psf, Penrith commands the highest psf in its immediate area. However, $PSF is no longer as important as overall price (quantum) today. What matters is that Penrith keeps overall prices in the low to mid range. This is also balanced out by newer and more efficient layouts.
In any case, even if we were to insist on $PSF comparisons, Penrith’s starting $PSF is among the lowest across current new launches; even lower than some OCR projects.
On the resale front, Queens Peak emerges as Penrith’s closest comparison in terms of pricing and layout. Compared to Queens Peak, Penrith’s two and three-bedders are priced slightly higher, but its four-bedders are more affordable thanks to being smaller.
Given the lack of competing launches in D3, buyers will likely also cross-shop Skye at Holland, which is launching around the same time. While Skye’s larger three and four-bedders justify higher prices, Penrith offers a more accessible entry point. But one subjective factor is whether buyers place more weight on Skye’s D10 address, as a matter of status.
With regard to future prospects, the buyer profile in D3 continues to evolve. HDB upgraders make up roughly one-third of private buyers, but it’s promising that existing private owners are now also joining in. In the more immediate view, upgraders purchase within the $1.6 to $2 million range, aligning closely with Penrith’s three-bedder pricing right now.
All things considered, Penrith’s key advantages are (1) competitive pricing in the context of 2025 new launches and (2) being a new RCR project with few immediate competitors right now. It’s the first new launch in D3 in around seven years, and its unit mix is tailored to plug a much-needed gap.
For more deep dives and pricing analysis of various condo projects, follow us on Stacked Pro. If you’d like to get in touch for a more in-depth consultation, you can do so here.
Ryan J
A seasoned content strategist with over 17 years in the real estate and financial journalism sectors, Ryan has built a reputation for transforming complex industry jargon into accessible knowledge. With a track record of writing and editing for leading financial platforms and publications, Ryan's expertise has been recognised across various media outlets. His role as a former content editor for 99.co and a co-host for CNA 938's Open House programme underscores his commitment to providing valuable insights into the property market.Read next from New Launch Condo Analysis

New Launch Condo Analysis This New 706-Unit Integrated Condo at River Valley Starts From $1.298M – And the Price Raises a Big Question for Buyers

Property Investment Insights Faber Residence Pricing Review: How It Compares To Nearby Resale And New Launches

New Launch Condo Analysis Skye At Holland Pricing Review: How It Compares To Nearby Resale And New Launches

Property Investment Insights Are Older One- and Two-Bedders in District 10 Holding Up Against the New Launches? We Break It Down
Latest Posts

Property Market Commentary Why These Newly Completed Condos Have Made Owners Up to $700K in Just 5 Years

Editor's Pick Penrith Condo Review: Full-Facility Condo For Just 462 Units Near The MRT

Overseas Property Investing Why Renewed Interest In Johor Will Not Help All Investors In The Iskandar Region

On The Market 5 Cheapest 5-Room HDB Flats You Can Buy Right Now From $535k

Singapore Property News The Real Reason Homes Keep Getting Snapped Up in Singapore

Editor's Pick We Toured One Of Singapore’s Most Expensive Landed Estates — Is It Really Worth The Price?

Property Market Commentary The Best Condo Rental Yields Near International Schools In Singapore Isn’t Where You’d Expect

On The Market The Cheapest 3-Bedroom Condos in Singapore You Can Buy Right Now Under $1.2M

Singapore Property News Record $1.27M Sale Makes This 30-Year-Old HDB The Town’s Priciest Yet

On The Market Three Rare Bungalows With Unique Design Hit The Market For $13.98m – Each With Over 9,300 Sq Ft Of Space

Editor's Pick Why I Sold My 40-Year-Old Jurong Flat For A Newer Bukit Panjang One: A Buyer’s Case Study

Editor's Pick 5 Ways To Get A Better Price For Your Property When The Market Is Changing

Property Market Commentary Are Singapore’s Oldest HDB Flats Finally Losing Value? A 2025 Price Update

Singapore Property News The World’s Real Estate Is Now Worth US$393 Trillion In 2025. Here’s Where Singapore Fits In

Property Trends The Room That Changed the Most in Singapore Homes: What Happened to Our Kitchens?
