Can a One-Bedder Outperform a Two-Bedder? We Analysed 5 Years of Data
Get The Property Insights Serious Buyers Read First: Join 50,000+ readers who rely on our weekly breakdowns of Singapore’s property market.

A seasoned content strategist with over 17 years in the real estate and financial journalism sectors, Ryan has built a reputation for transforming complex industry jargon into accessible knowledge. With a track record of writing and editing for leading financial platforms and publications, Ryan's expertise has been recognised across various media outlets. His role as a former content editor for 99.co and a co-host for CNA 938's Open House programme underscores his commitment to providing valuable insights into the property market.
It’s a common saying that if you’re going to buy a smaller unit, you should buy a two-bedder (ideally two-bed, two-bath units). The theory is that two-bedders are more versatile, and hence see wider demand and stronger returns. Ask most people and they’ll tell you it’s “common wisdom.” But after doing some deep dives to try and prove or disprove this, we’ve come across something interesting: a series of projects where the one-bedders managed to outdo the two-bedders, over five years. Here they are:
Projects where one-bedders outperformed the two-bedders
For this analysis, we looked at resale transactions from 2020 to 2024. This is to ensure recency in the transactions.
To calculate annualised growth, we focused only on projects that had one- and two-bedroom transactions, recorded in both 2020 and 2024.
We then narrowed the scope to projects with at least 10 transactions for each unit type, over the past five years.
Project | Annualised growth for 1-bedroom units | Annualised growth for 2-bedroom units | Difference |
EASTERN LAGOON I & II | 11.24% | 4.75% | 6.49% |
SIGLAP V | 6.60% | 2.78% | 3.83% |
ALEXIS | 6.75% | 3.34% | 3.41% |
GUILLEMARD EDGE | 6.89% | 3.80% | 3.09% |
CONCOURSE SKYLINE | 3.19% | 0.51% | 2.68% |
CARDIFF RESIDENCE | 5.45% | 2.88% | 2.58% |
PARC ROSEWOOD | 6.41% | 4.29% | 2.12% |
THE TRILINQ | 5.96% | 3.86% | 2.10% |
EIGHT COURTYARDS | 7.78% | 5.87% | 1.91% |
WATERBANK AT DAKOTA | 3.47% | 1.57% | 1.90% |
QUESTA @ DUNMAN | 4.19% | 2.41% | 1.78% |
CASA CAMBIO | 5.64% | 3.94% | 1.70% |
THE SAIL @ MARINA BAY | 3.62% | 1.93% | 1.69% |
THE LAKEFRONT RESIDENCES | 4.38% | 2.87% | 1.51% |
PALM ISLES | 7.56% | 6.10% | 1.46% |
SPOTTISWOODE 18 | 3.39% | 1.96% | 1.43% |
SOLEIL @ SINARAN | 3.99% | 2.63% | 1.36% |
REGENT RESIDENCES | 3.94% | 2.60% | 1.34% |
RIVER PLACE | 7.70% | 6.59% | 1.11% |
KINGSFORD . HILLVIEW PEAK | 3.69% | 2.67% | 1.02% |
MANDARIN GARDENS | 8.61% | 7.62% | 0.99% |
CANBERRA RESIDENCES | 7.23% | 6.31% | 0.93% |
SKIES MILTONIA | 5.46% | 4.65% | 0.81% |
ECO | 4.83% | 4.07% | 0.77% |
PARC RIVIERA | 3.52% | 2.96% | 0.56% |
PARC CENTROS | 6.92% | 6.39% | 0.53% |
SKY VUE | 5.86% | 5.35% | 0.52% |
BARTLEY RESIDENCES | 4.85% | 4.34% | 0.51% |
ISUITES @ PALM | 5.06% | 4.67% | 0.40% |
SEAHILL | 3.96% | 3.59% | 0.37% |
LAKE GRANDE | 5.40% | 5.05% | 0.35% |
RIVERSAILS | 7.10% | 6.81% | 0.29% |
SOUTHBANK | 3.70% | 3.43% | 0.28% |
KINGSFORD WATERBAY | 5.21% | 5.04% | 0.17% |
RIVERBANK @ FERNVALE | 5.67% | 5.55% | 0.12% |
THE GLADES | 3.98% | 3.90% | 0.08% |
EUHABITAT | 3.98% | 3.90% | 0.08% |
BEDOK RESIDENCES | 4.43% | 4.37% | 0.06% |

Let’s take a look at the top two projects where one-bedders outperformed two-bedders:
- Eastern Lagoon
- Siglap V
We’ll try to see if we can determine why the larger units didn’t do better, as expected. However, do keep in mind that transactions are multi-factorial; they can include certain elements not seen in the data, such as buyers willing to overpay because a certain location is important to them; or perhaps sellers demanding more due to better renovations.
1. Eastern Lagoon I & II
At Eastern Lagoon (both I & II combined in the dataset), one-bedroom units have shown stronger $PSF appreciation compared to two-bedders. While the data doesn’t split between the two phases, both are of the same age and sit adjacent; they’re side by side, with very similar layouts, facilities, and age. So treating them together still gives us a reliable directional snapshot.
District | 16 |
Tenure | Freehold |
Completion year | 1985 |
No. of units | 307 |
1-bedroom units | 2-bedroom units | |
Annualised growth | 11.24% | 4.75% |
No. of units sold from 2020 to 2024 | 12 | 13 |
These are the average sizes and prices for the units:
Year | Average 1-bedroom price | Average 2-bedroom price | Price difference |
2020 | $847,667 | $1,335,000 | $487,333 |
2021 | $1,109,000 | $1,373,500 | $264,500 |
2022 | $1,215,000 | $1,475,000 | $260,000 |
2023 | $1,325,000 | $1,630,000 | $305,000 |
2024 | $1,260,944 | $1,638,750 | $377,806 |

1-bedroom sizes | 689 – 893 sq ft |
2-bedroom sizes | 797 – 1076 sq ft |
The price gap between the one- and two-bedders has narrowed since 2020, although it narrowed in 2022 before widening again by 2024.
Notably, Eastern Lagoon’s one-bedders are gigantic by today’s standards, with the biggest layouts (893 sq ft) exceeding the smallest two-bedders (797 sq ft). As an aside, that square footage would be assigned to three-bedders if they were built today (more on this below.)
This helps explain the stronger price growth for the smaller units: even though they’re “officially” designated as one-bedders, they are bigger than the two-bedders.
Now, let’s look at their profitability over the past five years
Unit type | Average gains | Average ROI | Average holding period (years) |
1-bedroom | $485,781 | 76.69% | 13.0 |
2-bedroom | $421,600 | 43.94% | 8.9 |
Over the past five years, there were no unprofitable transactions recorded at Eastern Lagoon.
One-bedders saw average gains of about $485,781, translating to an average ROI of 76.69 per cent, after a holding period of around 13 years. In contrast, two-bedders achieved slightly lower average gains of $421,600 and an ROI of 43.94 per cent, with a shorter holding period of about 8.9 years.
This suggests that, while both unit types have been profitable, the one-bedders stand out for delivering stronger returns despite their longer holding periods; a result likely driven by their lower entry quantum and larger-than-typical sizes for the category.
Now, let’s take a look at the rental yields
Unit type | Average price in 2024 | Average rent from June 2024 to June 2025 | Rental yield |
1-bedroom | $1,260,944 | $3,045 | 2.90% |
2-bedroom | $1,638,750 | $3,570 | 2.61% |
The difference in rental yields between the two is virtually negligible; even though one-bedders have a slight edge (due to the lower quantum), we would surmise that most landlords will defer to the two-bedders, with their higher absolute rental; an extra $525 a month is just more useful.
With that in mind, let’s now broaden the view to look at how freehold/999-year one- and two-bedders across District 16 have performed.
1-bedroom units
Year | Average price | Average $PSF | ||
D16 | Eastern Lagoon | D16 | Eastern Lagoon | |
2020 | $762,333 | $847,667 | $1,276 | $1,139 |
2021 | $706,333 | $1,109,000 | $1,420 | $1,472 |
2022 | $824,714 | $1,215,000 | $1,514 | $1,648 |
2023 | $825,600 | $1,325,000 | $1,762 | $1,783 |
2024 | $850,861 | $1,260,944 | $1,628 | $1,744 |

2-bedroom units
Year | Average price | Average $PSF | ||
D16 | Eastern Lagoon | D16 | Eastern Lagoon | |
2020 | $1,215,700 | $1,335,000 | $1,226 | $1,408 |
2021 | $1,184,754 | $1,373,500 | $1,190 | $1,461 |
2022 | $1,285,383 | $1,475,000 | $1,276 | $1,561 |
2023 | $1,448,038 | $1,630,000 | $1,419 | $1,824 |
2024 | $1,507,567 | $1,638,750 | $1,463 | $1,695 |

For one-bedders, the price gap is especially pronounced. In 2024, District 16 one-bedders averaged around $850,861 at $1,628 psf, while Eastern Lagoon’s averaged $1,260,944 at $1,744 psf. That’s a premium of more than $400,000 in price.
With two-bedders, the difference is smaller but still noticeable. In 2024, the district average was $1,507,567 at $1,463 psf, compared to $1,638,750 at $1,695 psf in Eastern Lagoon. Here, the premium works out to roughly $131,000.
Overall, Eastern Lagoon stands out for commanding stronger prices across both unit types – but the premium is particularly high for its one-bedders.
Let’s also take a look at the average sizes of the units transacted.
More from Stacked
Why Marina Bay Suites May Look Like a Poor Performer—But Its 4-Bedroom Units Tell a Different Story
In this Stacked Pro breakdown:
For this, we are again focusing only on freehold/999-year condos in District 16, to see how Eastern Lagoon compares against the wider market.
Year | Average 1-bedroom size (for units sold) | Eastern Lagoon’s average 1-bedroom size (for units sold) | Average 2-bedroom size (for units sold) | Eastern Lagoon’s average 2-bedroom size (for units sold) |
2020 | 628 | 746 | 996 | 947 |
2021 | 502 | 753 | 1009 | 942 |
2022 | 552 | 737 | 1013 | 947 |
2023 | 480 | 742 | 1032 | 893 |
2024 | 549 | 721 | 1032 | 969 |
Looking at the average sizes of units sold, Eastern Lagoon’s one-bedders are consistently larger than most District 16 counterparts. In 2024, for example, one-bedders in D16 averaged about 549 sq ft, compared to 721 sq ft at Eastern Lagoon.
This size advantage has been consistent over the past five years. We can see Eastern Lagoon’s layouts are almost always 150 to 250 sq ft larger than the norm.
For two-bedders, the picture is more mixed. While Eastern Lagoon does have layouts that exceed the district average, the units that transacted over the past five years have tended to be smaller. In 2024, for instance, two-bedders in District 16 averaged 1,032 sq ft, while those sold at Eastern Lagoon averaged 969 sq ft.
As the project dates back to 1985, detailed floor plans are not available for direct comparison. However, the transaction data is sufficient for us to understand what’s happening: the one-bedders, despite their name, actually tend to be bigger than the two-bedder units.
These oversized one-bedders are also much larger than their counterparts in the same district, not just within Eastern Lagoon itself.
This can happen because in the 1980s, one-bedroom units weren’t built as “shoebox” apartments for investors.
Instead, they were marketed to affluent singles, expatriates, or couples not living with children. Developers treated them more like “compact luxury homes”, so layouts leaned toward larger living/dining areas, rather than maxing out the bedroom count. It wasn’t unusual for a one-bedder to come with a full dining area, wet kitchens with service yards, or even multiple bathrooms.
It was only from the 2000s onward, as property prices rose, that developers leaned into the “shoebox” idea; and the emphasis has since shifted toward keeping the quantum low.
2. Siglap V
District | 15 |
Tenure | Freehold |
Completion year | 2013 |
No. of units | 114 |
1-bedroom units | 2-bedroom units | |
Annualised growth | 6.60% | 2.78% |
No. of units sold from 2020 to 2024 | 28 | 13 |
These are the average sizes and prices for the units:
Year | Average 1-bedroom price | Average 2-bedroom price | Price difference |
2020 | $710,000 | $1,240,888 | $530,888 |
2021 | $678,000 | $1,229,778 | $551,778 |
2022 | $799,400 | $1,195,000 | $395,600 |
2023 | $843,346 | – | – |
2024 | $803,378 | $1,236,815 | $433,437 |

1-bedroom sizes | 366 – 797 sq ft |
2-bedroom sizes | 689 – 1163 sq ft |
The price gap between one- and two-bedders has narrowed from 2020 to 2024. While average one-bedroom prices have risen over this period, two-bedroom prices have remained relatively flat, leading to a smaller premium for the two-bedders.
Now, let’s take a look at their profitability over the last five years
Gains | Losses | |||||
Unit type | Average gains | Average ROI | Average holding period (years) | Average losses | Average ROI | Average holding period (years) |
1-bedroom | $59,737 | 7.54% | 10.9 | -$68,105 | -8.58% | 11.0 |
2-bedroom | $115,380 | 10.32% | 13.0 | -$71,650 | -5.46% | 11.6 |
When measured by overall ROI, the two-bedders have delivered stronger returns. They also saw lower average losses in the event of unprofitable transactions, suggesting they were somewhat more resilient.
However, one-bedders had a shorter average holding period of about 10.9 years. This shorter holding time, coupled with their lower quantum, made their gains look stronger when expressed as annualised growth. In contrast, two-bedders were held longer, around 13 years on average.
Because the owners of two-bedders held for longer, their eventual profit quantum was larger, which translated into higher overall ROI; but the year-on-year growth rate for them was slower.
Now, let’s take a look at the rental yield
Unit type | Average price in 2024 | Average rent from June 2024 to June 2025 | Rental yield |
1-bedroom | $803,378 | $2,702 | 4.04% |
2-bedroom | $1,236,815 | $3,726 | 3.61% |
Nothing too surprising here again; the one-bedders have a higher rental yield as expected, due to their lower quantum.
Let’s take a look at the average $PSF and sale prices as compared to the rest of District 15
1-bedroom units
Year | Average price | Average $PSF | ||
D15 | Siglap V | D15 | Siglap V | |
2020 | $849,646 | $710,000 | $1,723 | $1,205 |
2021 | $916,641 | $678,000 | $1,791 | $1,378 |
2022 | $886,718 | $799,400 | $1,680 | $1,452 |
2023 | $914,910 | $843,346 | $1,778 | $1,533 |
2024 | $963,746 | $803,378 | $1,867 | $1,556 |

2-bedroom units
Year | Average price | Average $PSF | ||
D15 | Siglap V | D15 | Siglap V | |
2020 | $1,431,051 | $1,240,888 | $1,724 | $1,253 |
2021 | $1,499,332 | $1,229,778 | $1,810 | $1,232 |
2022 | $1,518,855 | $1,195,000 | $1,764 | $1,220 |
2023 | $1,745,571 | $2,310 | ||
2024 | $1,848,729 | $1,236,815 | $2,412 | $1,398 |

From 2020 to 2024, both of Siglap V’s one- and two-bedders transacted below district averages. Across the five-year period, Siglap V has maintained this discount to the broader market.
Speculatively, this could be due to its mixed-use nature. This is the same project where the neighbourhood’s Cold Storage is, in addition to a cafe, a large spa, and some other amenities. Craftsmen Coffee here is something of a neighbourhood hang-out.
While convenient, some buyers tend to view such developments as less prestigious than “pure” residential condos, which could weigh on resale performance.
Let’s look at the average sizes for the units transacted
Year | Average 1-bedroom size (for units sold) | Siglap V’s average 1-bedroom size (for units sold) | Average 2-bedroom size (for units sold) | Siglap V’s average 2-bedroom size (for units sold) |
2020 | 499 | 603 | 873 | 990 |
2021 | 525 | 491 | 866 | 999 |
2022 | 535 | 551 | 889 | 980 |
2023 | 516 | 555 | 777 | – |
2024 | 528 | 517 | 799 | 897 |
Transacted one-bedders were comparable to the District 15 average, sometimes slightly larger (603 sq ft vs 499 sq ft in 2020). More recently though, they align more closely with the district average (517 sq ft vs 528 sq ft in 2024).
For two-bedders, Siglap V’s units have consistently been larger than the district average. In 2020, for instance, its two-bedders averaged 990 sq ft compared to 873 sq ft across District 15. Even in 2024, the project’s two-bedders came in at 897 sq ft, still above the district’s 799 sq ft average.
While Siglap V’s pricing sits below the wider market, its unit sizes – especially for two-bedders – tend to be larger.
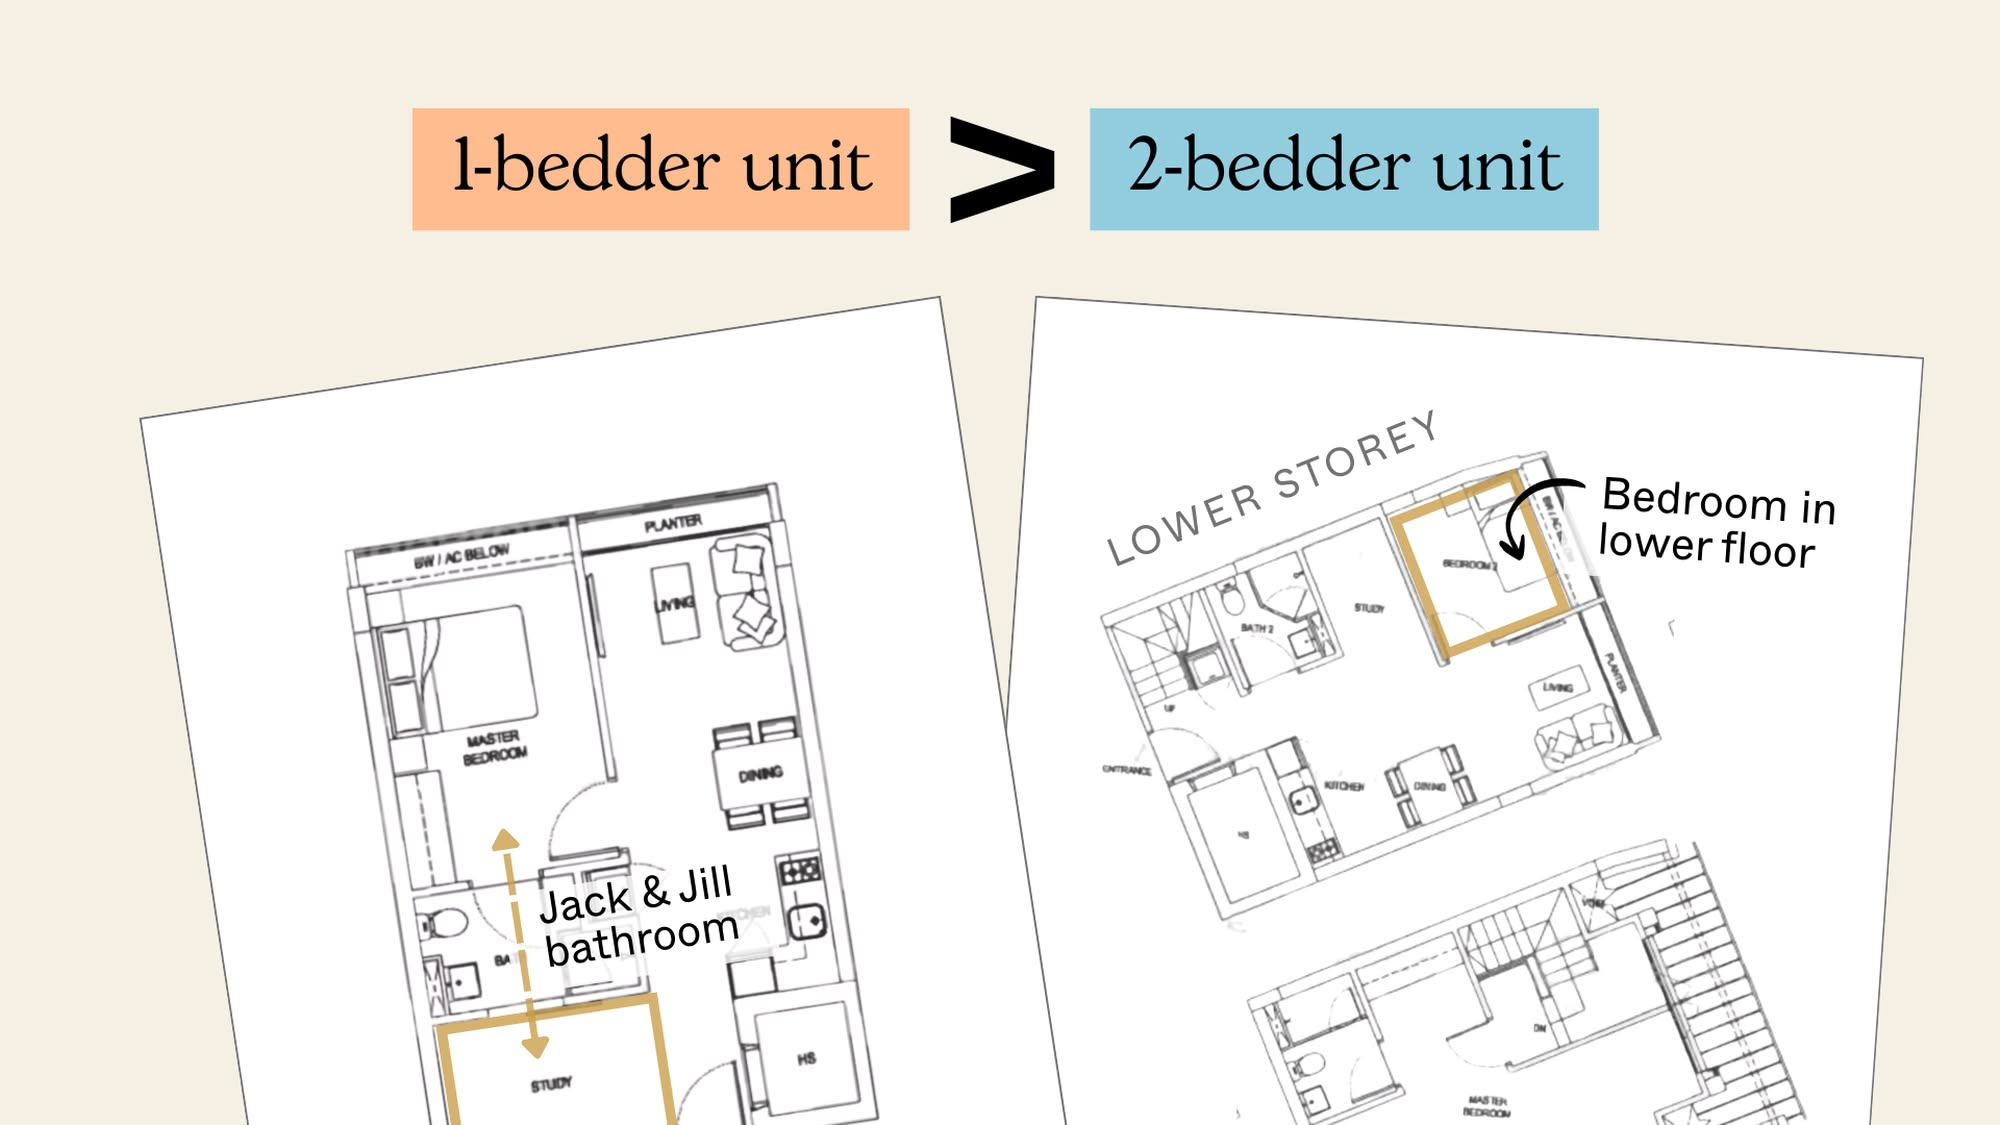
Let’s also take a look at the floor plans for the one- and two-bedders in Siglap V:

Interestingly, this project has more one-bedroom + study units than regular one-bedders, and more two-bedroom + study penthouses than standard two-bedders. Perhaps it’s because it’s right at the mouth of a large landed cluster: larger units could appeal to buyers right-sizing from the nearby landed properties, like in Frankel Estate.
The one-bedroom + Study is compact but practical. The study is large enough to function as a small bedroom if needed, and a Jack and Jill bathroom provides access from both the bedroom and study. It also comes with a home shelter, which is useful for storage and keeping the main space clutter-free. Instead of a full balcony, the unit only has a small planter, so most of the layout is devoted to internal living space.
As for the two-bedroom + study penthouse, it is fairly generous in size. One bedroom sits on the lower floor while the master suite occupies the upper level, with two bathrooms split between the floors. The upper-floor master is especially spacious, and like the smaller unit, this layout also includes a home shelter and just a small planter instead of a balcony, again maximising internal living space.
Penthouses generally cater to a niche pool of buyers though, which further explains why Siglap V’s two-bedders haven’t performed as strongly: the majority of them are penthouse units.
By contrast, the one-bedders come in at a lower price point and deliver a higher rental yield, making them more attractive on a bottom-line basis.
Conclusion
The data from Eastern Lagoon and Siglap V suggest that one-bedders have traits that can drive stronger performance, compared to larger units.
In all two projects, one-bedders delivered higher rental yields, which likely boosted their appeal to investors. Unit size and layout can also play a role: Eastern Lagoon, for example, offers one-bedders that are larger than the district average.
Price positioning is another important factor. The price gap between one- and two-bedders remains substantial across all two developments, even if it has narrowed over time.
For buyers emphasising a lower capital commitment, the lower quantum of a one-bedder can mean lower risk with better yield.
This shows there are exceptions to common sayings about two-bedders being “better.” One-bedders can sometimes outperform two-bedders, and it’s important to look closely at specific projects rather than go by loose generalisations.
While many buyers continue to believe two-bedders are “better” in terms of both livability and long-term appreciation, we hope we’ve shed light on why that’s not always true.
It’s not about assuming bigger is always safer; it’s about recognising where one-bedders buck the trend with stronger yields, lower risk, and investor appeal. Stay open to opportunities in projects where one-bedders have unique layouts, stronger rental demand, or sharper price gaps, because those are the factors that can move returns.
Curious how these principles apply to your specific investment goals? Let’s chat.
For more deep dives on the Singapore property market, follow us on Stacked Pro.
Ryan J
A seasoned content strategist with over 17 years in the real estate and financial journalism sectors, Ryan has built a reputation for transforming complex industry jargon into accessible knowledge. With a track record of writing and editing for leading financial platforms and publications, Ryan's expertise has been recognised across various media outlets. His role as a former content editor for 99.co and a co-host for CNA 938's Open House programme underscores his commitment to providing valuable insights into the property market.Read next from Property Investment Insights
Property Investment Insights Analysing 10 Years of District 15 Boutique Condo Transactions: Insights Into What Drives Profitability

Property Investment Insights District 7 vs District 9: Which Prime Location Has Delivered Better Condo Value?

New Launch Condo Analysis Springleaf Residence Pricing Review: How It Compares To Nearby Resale And New Launches

Property Investment Insights New Launch vs Resale Condos in District 9: Which Bedroom Types Offer Better Value Today?
Latest Posts

Landed Home Tours We Toured A Freehold Landed Estate In Singapore With Vintage Properties and Top Thai Restaurants

Singapore Property News NDP Rally 2025: The 4 Key Housing Takeaways for Singaporeans

Singapore Property News Springleaf Residence Sells 870 of 941 Units (92%) At Launch — What’s Driving Demand?

Singapore Property News Could Your East-Side Condo Be Worth More Now? Singapore Just Raised Height Limits Near Changi

Singapore Property News From SERS to VERS: What Every HDB Owner Needs to Know About the Big Shift

On The Market 5 Cheapest 3-Bedroom Condos To Buy Right Now In 2025 (From $980K)

Homeowner Stories I’m a Former Police Officer Who Now Co-Owns 40 Property Investments Without Managing a Single Tenant: Here’s How

Property Advice The Ideal Size for Each Room of Your Condo to Actually Feel Liveable Revealed

Property Advice 5 Mistakes You Make When Comparing Condo Prices – Your ‘Good Deal’ Might Be Hiding a Secret

Overseas Property Investing 4 Hidden Risks To Avoid When Buying Property In Malaysia (A Guide For Singaporeans)

Homeowner Stories I Bought a Freehold Property in Singapore and Regret It — Here’s the Big Mistake I Made

Editor's Pick We Toured A Rare Part Of Singapore Where Terrace Houses Are Bigger Than The Semi-Detached Units

Singapore Property News What Buyers Overlook When Purchasing Older Condos (Until It’s Too Late)

Editor's Pick 5 Ways Housing Shapes Singapore’s National Identity

On The Market 5 Attractive Freehold Condos With Private Pools (Under $2M)