We Compared Old vs New Condos in One of Singapore’s Priciest Family Neighbourhoods: Here’s What We Found For Family-Sized Units
Get The Property Insights Serious Buyers Read First: Join 50,000+ readers who rely on our weekly breakdowns of Singapore’s property market.
A seasoned content strategist with over 17 years in the real estate and financial journalism sectors, Ryan has built a reputation for transforming complex industry jargon into accessible knowledge. With a track record of writing and editing for leading financial platforms and publications, Ryan's expertise has been recognised across various media outlets. His role as a former content editor for 99.co and a co-host for CNA 938's Open House programme underscores his commitment to providing valuable insights into the property market.
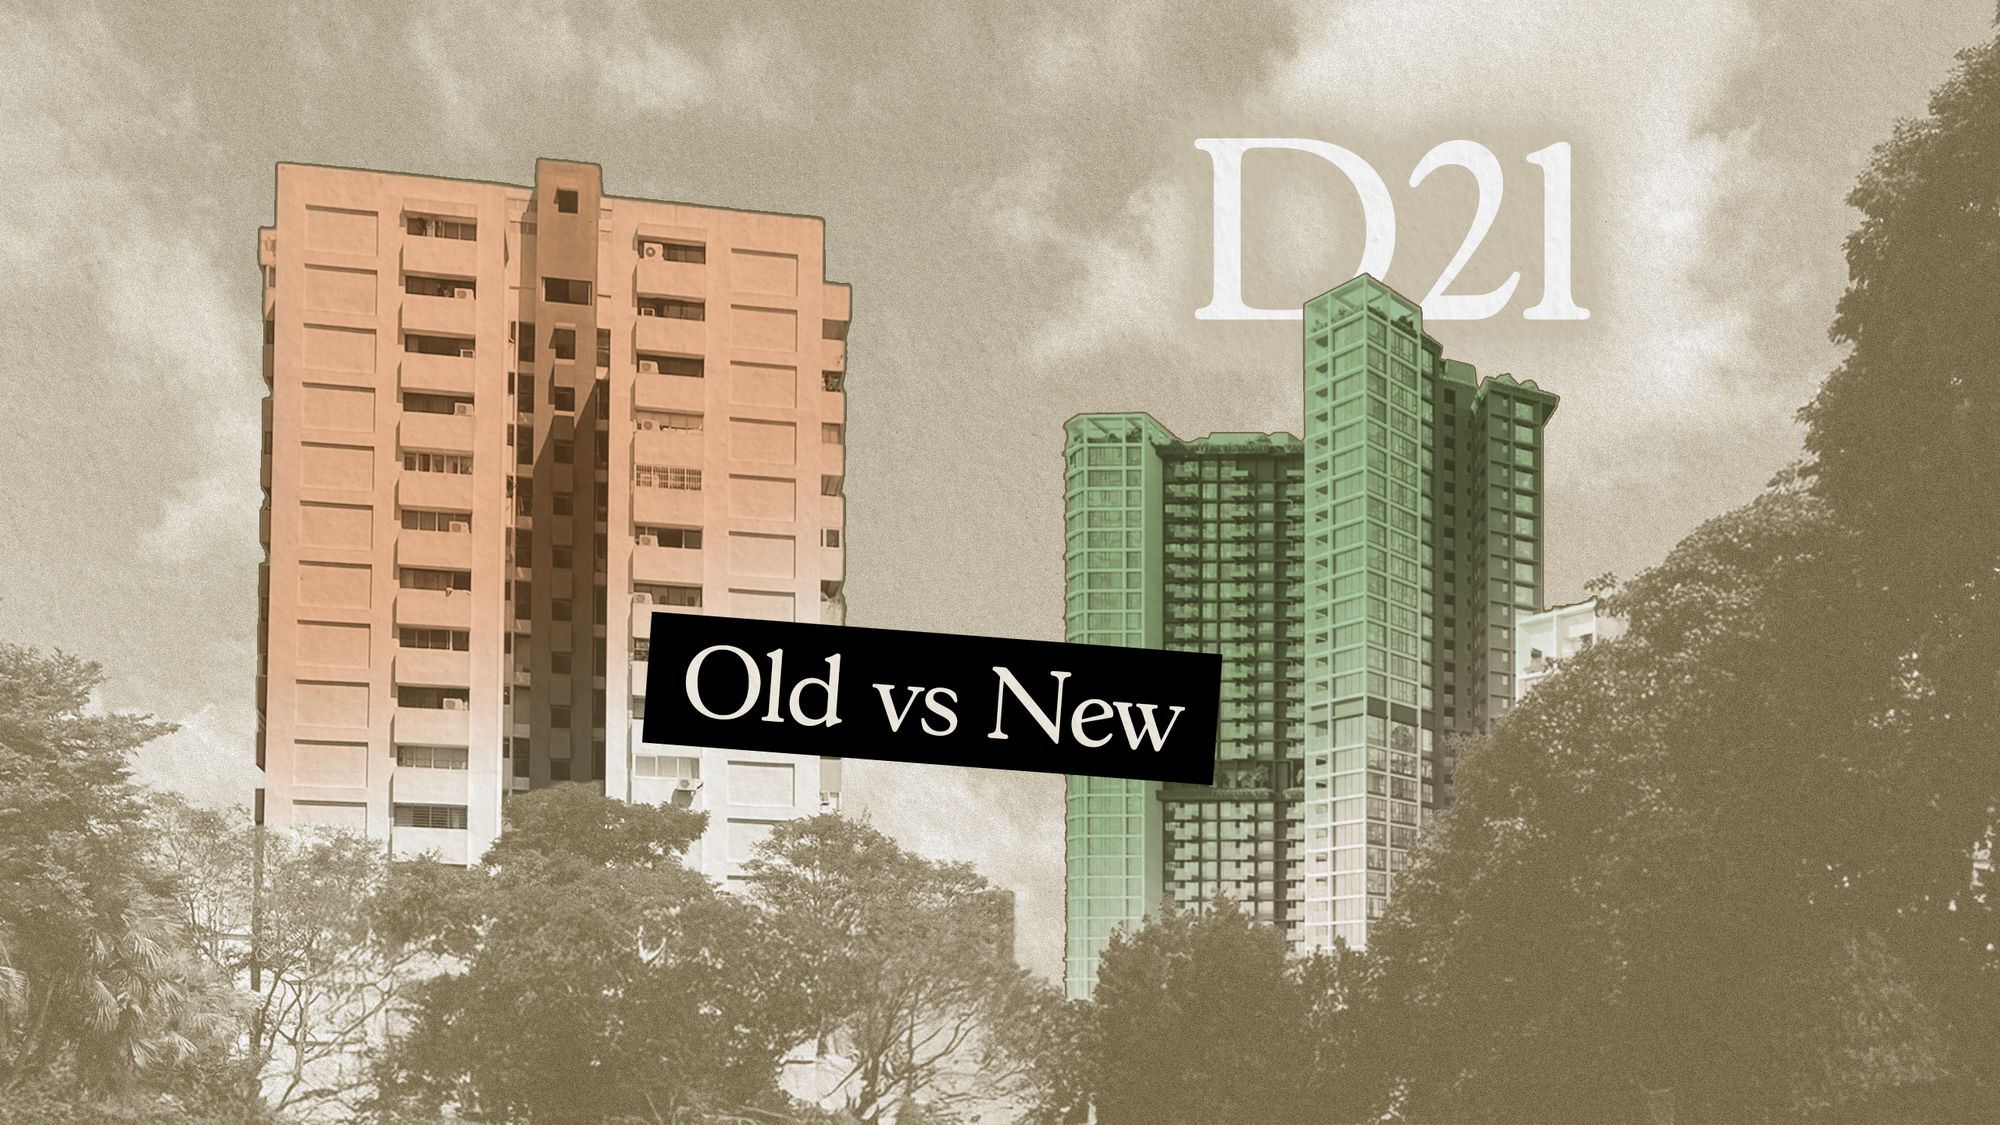
In our continuation from part 1, we’re going to look at the leasehold three and four-bedders in District 21 (D21). In many ways, these family-sized homes are the “true” bread-and-butter of the district, as D21 is primarily known as a family-oriented zone: perhaps a little more upscale than some other heartland areas, but ultimately still an area with schools, greenery, and open spaces. In light of that, can older three or four-bedders continue to draw interest? Let’s have a look at how they’re faring:
A quick note on newer versus older
As we’ve mentioned in part 1, we use 20 years or younger for newer (not new, mind you, but just newer) because most projects in Singapore last 19 to 24 years – so it’s a good middle point. It’s also generally accepted in the market (by convention and no particular authority) that the 20+ age range is when most condos are referred to as “older.” We are also looking at leasehold condos here, as they’re the ones where lease decay and age have the most discernible impact.
Let’s start with the overall performance of the newer and older three-bedders
3-bedroom units
Average $PSF
| Year | New | Old | Difference |
| 2014 | $1,043 | $829 | $214 |
| 2015 | $1,003 | $802 | $200 |
| 2016 | $1,040 | $758 | $281 |
| 2017 | $981 | $800 | $181 |
| 2018 | $1,108 | $824 | $284 |
| 2019 | $1,200 | $976 | $224 |
| 2020 | $1,133 | $879 | $254 |
| 2021 | $1,194 | $1,030 | $164 |
| 2022 | $1,246 | $1,102 | $144 |
| 2023 | $1,428 | $1,202 | $226 |
| 2024 | $1,513 | $1,108 | $405 |
| Annualised | 3.79% | 2.95% |

For the three-bedders in D21, newer condos outpaced older ones (3.79 per cent versus 2.95 per cent).
Throughout this period, the $PSF of newer units consistently stayed higher than their older counterparts, and the premium widened over time. Back in 2014, the gap was around $214 psf, but by 2024 it had stretched to $405 psf.
So far, this shows newer three-bedders faring better; but we also need to look at the actual overall price/quantum:
Average price
| Year | New | Old | Difference |
| 2014 | $1,295,894 | $1,379,164 | -$83,270 |
| 2015 | $1,235,185 | $1,291,470 | -$56,284 |
| 2016 | $1,301,966 | $1,212,536 | $89,430 |
| 2017 | $1,212,920 | $1,260,968 | -$48,048 |
| 2018 | $1,421,160 | $1,425,286 | -$4,126 |
| 2019 | $1,456,875 | $1,535,450 | -$78,575 |
| 2020 | $1,373,884 | $1,457,926 | -$84,041 |
| 2021 | $1,555,929 | $1,623,147 | -$67,218 |
| 2022 | $1,603,380 | $1,778,970 | -$175,589 |
| 2023 | $1,772,560 | $1,814,330 | -$41,770 |
| 2024 | $1,921,387 | $1,784,629 | $136,758 |
| % increase from 2014 to 2024 | 48.27% | 29.40% |

Over the past decade, the average price of newer three-bedders rose by about 48.3 per cent, compared to just 29.4 per cent for older ones. That’s a substantial gap.
For most of our time period, older three-bedders were actually costlier in absolute price. But we see that by 2024, newer units had overtaken them, averaging $1.92 million versus $1.78 million.
So while D21’s older three-bedders do show resilience, the faster rate of appreciation is clearly with the newer projects. Lease decay is not a severe issue, as the older condos are still appreciating, but so far, it looks like buyers who want to see gains should be picking the newer (below 20 years) options.
Let’s also look at the unit sizes to see if older units are maintaining their price point through simple spaciousness
Average size (based on units transacted)
| Year | New | Old |
| 2014 | 1255 | 1679 |
| 2015 | 1240 | 1622 |
| 2016 | 1271 | 1627 |
| 2017 | 1240 | 1603 |
| 2018 | 1319 | 1725 |
| 2019 | 1224 | 1612 |
| 2020 | 1221 | 1673 |
| 2021 | 1340 | 1594 |
| 2022 | 1298 | 1641 |
| 2023 | 1255 | 1538 |
| 2024 | 1280 | 1625 |

Older three-bedders in D21 have consistently been larger than newer counterparts, often by 300 to 400 sq ft or more. In 2014, older units averaged around 1,679 sq ft versus 1,255 sq ft for newer ones; even by 2024, the gap remained wide at 1,625 sq ft compared to 1,280 sq ft.
This size advantage explains why older units often held higher overall prices (quantum) for much of the past decade, despite their lower $PSF.
Here’s the number of transactions we looked at, which is a fairly healthy volume:
No. of transactions
| Year | New | Old |
| 2014 | 21 | 25 |
| 2015 | 27 | 23 |
| 2016 | 29 | 42 |
| 2017 | 39 | 38 |
| 2018 | 43 | 14 |
| 2019 | 24 | 20 |
| 2020 | 33 | 27 |
| 2021 | 58 | 53 |
| 2022 | 26 | 33 |
| 2023 | 23 | 36 |
| 2024 | 30 | 41 |
Now let’s look at the specific projects where there were transactions in 2024
New
| Project | Average $PSF | Average price | Average size | No. of unit sold | Lease start year |
| LE WOOD | $1,286 | $1,595,000 | 1241 | 4 | 1999 |
| HIGH OAK CONDOMINIUM | $1,370 | $1,711,667 | 1252 | 3 | 1996 |
| THE RAINTREE | $1,404 | $1,844,818 | 1314 | 11 | 2003 |
| MEADOWLODGE | $1,521 | $2,046,000 | 1346 | 2 | 1997 |
| SOUTHAVEN I | $1,362 | $2,170,900 | 1599 | 2 | 1994 |
| GARDENVISTA | $1,865 | $2,174,975 | 1168 | 8 | 1999 |
Old
| Project | Average $PSF | Average price | Average size | No. of unit sold | Lease start year |
| SHERWOOD TOWER | $1,026 | $1,617,993 | 1580 | 16 | 1976 |
| PINE GROVE | $1,062 | $1,851,941 | 1742 | 17 | 1984 |
| CAVENDISH PARK | $1,454 | $1,933,981 | 1331 | 6 | 1991 |
| BEAUTY WORLD CENTRE | $1,120 | $2,097,500 | 1873 | 2 | 1979 |
Among the newer condos, Gardenvista stands out with the highest $PSF at $1,865, but this is largely due to its smaller size. By comparison, Southaven I achieved one of the highest average prices at $2.17 million, driven largely by its large unit size of 1,599 sq ft. The Raintree also shows strong demand, with 11 units transacted at an average price of about $1.84 million.
On the older side, Pine Grove continues to illustrate the size effect: with an average size of 1,742 sq ft, reaching $1.85 million. Beauty World Centre sits at the top of the old projects in terms of price, at $2.1 million, but again, this comes from very large units averaging 1,873 sq ft.
Overall, the 2024 data shows that newer three-bedders have pushed ahead in terms of $PSF, while older ones remain competitive mainly because of size and quantum. Nonetheless, the numbers tilt in favour of newer projects still.
Here’s how the three-bedder units across the key newer and older projects in District 21 have performed over the last 10 years. We’ve bolded the newer projects for easier comparison.
| Year | LE WOOD | HIGH OAK CONDOMINIUM | THE RAINTREE | MEADOWLODGE | SOUTHAVEN I | GARDENVISTA | SHERWOOD TOWER | PINE GROVE | CAVENDISH PARK | BEAUTY WORLD CENTRE |
| 2014 | $895 | $871 | $1,006 | $871 | $1,298 | $712 | $845 | $1,196 | $829 | |
| 2015 | $858 | $843 | $977 | $944 | $838 | $1,235 | $688 | $773 | $1,072 | |
| 2016 | $826 | $985 | $1,109 | $874 | $1,199 | $675 | $684 | $1,066 | $762 | |
| 2017 | $770 | $853 | $1,008 | $1,018 | $798 | $1,218 | $683 | $787 | $1,028 | $774 |
| 2018 | $767 | $923 | $1,093 | $1,064 | $886 | $1,334 | $696 | $949 | $828 | |
| 2019 | $983 | $1,115 | $1,192 | $952 | $1,365 | $928 | $1,097 | $804 | ||
| 2020 | $879 | $1,032 | $1,046 | $1,148 | $922 | $1,400 | $762 | $906 | $1,161 | $845 |
| 2021 | $929 | $1,068 | $1,137 | $1,194 | $957 | $1,477 | $759 | $972 | $1,235 | $961 |
| 2022 | $1,055 | $1,139 | $1,222 | $1,352 | $1,167 | $1,661 | $902 | $1,059 | $1,416 | $995 |
| 2023 | $1,167 | $1,259 | $1,360 | $1,220 | $1,786 | $989 | $1,078 | $1,462 | $1,063 | |
| 2024 | $1,286 | $1,370 | $1,404 | $1,521 | $1,362 | $1,865 | $1,026 | $1,062 | $1,454 | $1,120 |
| Annualised | 3.69% | 4.63% | 3.39% | 4.57% | 3.69% | 3.72% | 2.31% | 1.97% | 3.05% |
More from Stacked
District 7 vs District 9: Which Prime Location Has Delivered Better Condo Value?
District 9 is about “old school prestige," and many Singaporeans have grown up with the sense that owning a condo…
Newer projects like High Oak Condominium and Meadowlodge saw some of the stronger growth rates, at 4.63 per cent and 4.57 per cent annualised, respectively.
Among the older projects, Sherwood Tower and Pine Grove underperformed, with annualised growth rates of just 2.31 per cent and 1.97 per cent. Beauty World Centre fared a little better at 3.05 per cent, while Cavendish Park stood out with 3.72 per cent – roughly on par with the stronger newer developments.
Newer three-bedders have generally shown stronger or at least comparable growth, even if exceptions like Cavendish Park do exist.
Now let’s look at their rental yields to see if this could contribute to their demand. Even though three-bedders generally aren’t bought to be rented out, leases still occur – mainly because this is such a proven family location:
| Project | Average price in 2024 | Average monthly rent (June 2024 – June 2025) | Rental yield |
| SOUTHAVEN I | $2,170,900 | $4,651 | 2.57% |
| MEADOWLODGE | $2,046,000 | $4,700 | 2.76% |
| GARDENVISTA | $2,174,975 | $5,316 | 2.93% |
| THE RAINTREE | $1,844,818 | $4,952 | 3.22% |
| LE WOOD | $1,595,000 | $4,325 | 3.25% |
| CAVENDISH PARK | $1,933,981 | $5,250 | 3.26% |
| SHERWOOD TOWER | $1,617,993 | $4,402 | 3.26% |
| HIGH OAK CONDOMINIUM | $1,711,667 | $4,677 | 3.28% |
Nothing too surprising here; older projects show slightly stronger rental yields than the newer ones, as well they should (they tend to be cheaper, thus pushing up the gross yield.)
For instance, Cavendish Park and Sherwood Tower both achieved yields of 3.26 per cent, while High Oak Condominium went further with 3.28 per cent. In contrast, newer projects like Southaven I and Meadowlodge were on the lower end, with yields between 2.57 and 2.76 per cent.
This can be due to the lower costs of the ageing projects, which still generate rental income close to the district average despite their age and lower prices.
Now let’s look at newer versus older four-bedders
Average $PSF
| Year | New | Old | Difference |
| 2014 | $986 | ||
| 2015 | |||
| 2016 | $1,078 | $672 | $407 |
| 2017 | $1,088 | $648 | $440 |
| 2018 | $1,251 | ||
| 2019 | $1,125 | ||
| 2020 | $1,093 | ||
| 2021 | $1,223 | ||
| 2022 | $1,297 | $1,485 | -$188 |
| 2023 | $1,488 | ||
| 2024 | $1,613 | ||
| Annualised (2016 to 2022) | 3.13% | 14.14% |

As is often the case with four-bedders, we have to contend with a limited number of transactions. These high-priced units simply aren’t bought and sold often; and when they are bought, they’re often held for very long periods.
So the data for this segment is much thinner, with transactions for older units occurring only in certain years.
That said, on a $PSF basis, newer four-bedders generally held the edge. The exception was in 2022, when the few older transactions shot up to $1,485 psf compared to $1,297 psf for newer units. If we take the 2016 to 2022 period, the annualised growth rate for older four-bedders works out to a staggering 14.14 per cent, while newer ones saw just 3.13 per cent.
That said, the sample size here is so limited that we can’t draw clear conclusions. In some years, only one or two older four-bedders changed hands, which makes the figures highly volatile (e.g., the spike in 2022 comes from a single transaction in Cavendish Park, which has consistently been among the higher-priced older projects.)
Nonetheless, on paper and from the transactions we have, it looks like the older four-bedders outperformed the newer ones.
Let’s look at the actual quantum of the transactions
Average price
| Year | New | Old | Difference |
| 2014 | $1,560,000 | ||
| 2015 | |||
| 2016 | $1,552,500 | $1,500,000 | $52,500 |
| 2017 | $1,536,286 | $1,368,000 | $168,286 |
| 2018 | $1,717,422 | ||
| 2019 | $1,643,333 | ||
| 2020 | $1,680,000 | ||
| 2021 | $1,796,667 | ||
| 2022 | $1,771,250 | $2,910,000 | -$1,138,750 |
| 2023 | $2,087,500 | ||
| 2024 | $2,272,560 | ||
| % increase from 2016 to 2022 | 14.09% | 94.00% |

While this still doesn’t help with the lower transaction volumes, it does add some depth. From 2016 to 2022, newer four-bedders rose about 14.1 per cent in price, going from roughly $1.55 million to $1.77 million. Older four-bedders surged by 94 per cent in the same period, from $1.5 million to $2.91 million.
But when we look closer at the actual transactions, we see the 2016 and 2017 sales were from Kismis View. This project generally transacts at the lower end of D21’s pricing. The 2022 transaction, however, was from Cavendish Park, which has consistently been among the priciest of the older developments.
So this isn’t representative of all the older four-bedders surging in value. Rather, it’s the effect of comparing transactions from a lower-priced project to a much higher-priced one.
On that note, these are the sizes of the newer versus older units:
Average size (based on units transacted)
| Year | New | Old |
| 2014 | 1582 | |
| 2015 | ||
| 2016 | 1461 | 2234 |
| 2017 | 1418 | 2110 |
| 2018 | 1378 | |
| 2019 | 1464 | |
| 2020 | 1553 | |
| 2021 | 1489 | |
| 2022 | 1367 | 1959 |
| 2023 | 1408 | |
| 2024 | 1417 |

There are significant size discrepancies. Older four-bedders averaged over 2,100 sq ft, compared to around 1,400 to 1,460 sq ft for newer ones.
Even in 2022, when Cavendish Park four-bedders were sold, they averaged close to 2,000 sq ft versus just 1,367 sq ft for newer projects.
So while the data shows older four-bedders transacting at higher overall prices, this is largely a function of size. The higher square footage simply means a higher total cost.
The transaction volumes are, as mentioned, very limited:
No. of transactions
| Year | New | Old |
| 2014 | 2 | |
| 2015 | ||
| 2016 | 8 | 2 |
| 2017 | 7 | 1 |
| 2018 | 9 | |
| 2019 | 3 | |
| 2020 | 4 | |
| 2021 | 6 | |
| 2022 | 4 | 1 |
| 2023 | 4 | |
| 2024 | 5 |
Now, let’s look at the projects transacted in 2024
New
| Project | Average $PSF | Average price | Average size | No. of units sold | Completion year |
| HIGH OAK CONDOMINIUM | $1,203 | $1,653,333 | 1374 | 3 | 1996 |
| GARDENVISTA | $1,579 | $2,125,000 | 1346 | 1 | 1999 |
Old
| Project | Average $PSF | Average price | Average size | No. of units sold | Completion year |
| CAVENDISH PARK | $1,485 | $2,910,000 | 1959 | 1 | 1991 |
Newer projects such as High Oak Condominium and Gardenvista have shown steady but modest growth, with Gardenvista standing out as the stronger performer. In contrast, Cavendish Park – the only older development with a four-bedder transaction – posted a much higher annualised growth rate; but this is based on a single sale in 2022, which makes it unusable as a true indicator.
It’s also worth noting that the Cavendish Park unit was much larger than the newer counterparts, which explains its significantly higher quantum and smaller pool of transactions.
The more consistent picture comes from the newer projects, where Gardenvista has maintained a healthier pace of appreciation. For the older condos, prices are going to be more volatile, and it’s harder to draw conclusions.
This is the performance of the projects over the past decade
| Year | HIGH OAK CONDOMINIUM | GARDENVISTA | CAVENDISH PARK |
| 2014 | |||
| 2015 | |||
| 2016 | $841 | $1,240 | |
| 2017 | $914 | $1,252 | |
| 2018 | $1,282 | ||
| 2019 | |||
| 2020 | $1,000 | $1,330 | |
| 2021 | $1,446 | ||
| 2022 | $1,203 | $1,579 | $1,485 |
| 2023 | $1,769 | ||
| 2024 | $1,845 |
Gardenvista is clearly the stronger of the newer projects. From $1,240 psf in 2016, it climbed to $1,845 psf by 2024, showing steady appreciation. High Oak Condominium saw a slower trajectory, with its most recent transaction at $1,203 psf in 2022, reflecting more modest growth.
Cavendish Park, the sole older project with a four-bedder transaction, reached $1,485 psf in 2022. But as we said before, there’s not much to be drawn from a single transaction.
In general, newer four-bedders in D21 – particularly at Gardenvista – have been reliable in terms of long-term performance.
Seeing as there was just one transaction done in Cavendish Park over the past 10 years, we can’t look at its annualised growth rate or make a comparison
Although four-bedders are very rarely rental assets, let’s look at the rental yields for completeness
| Project | Average price in 2022 | Average monthly rent (June 2024 – June 2025) | Rental yield |
| CAVENDISH PARK | $2,910,000 | $7,000 | 2.89% |
| GARDENVISTA | $2,125,000 | $5,897 | 3.33% |
| HIGH OAK CONDOMINIUM | $1,653,333 | $5,380 | 3.90% |
There’s nothing particularly revealing here – it makes sense that the cheaper, older project (High Oak Condominium) would have the higher gross rental yield, and vice versa.
Conclusion:
With the three-bedders, older projects cost more than newer ones for most of the previous decade. But by 2024, the trend had reversed, and newer three-bedders saw higher average prices. When we break it down by individual projects though, we saw it wasn’t very uniform across D21:
Some newer and older developments have very comparable prices, while outliers with lower or higher averages tend to distort the broader figures. This makes assessment of individual projects and units more important for D21, and buyers shouldn’t be too quick to make assumptions that “older = worse.”
For the four-bedders, transaction volumes are too thin to provide a meaningful conclusion. Much of the apparent outperformance of older units comes from a single Cavendish Park transaction, which has one of the highest prices in the district. So unfortunately, there’s nothing we can conclusively state about the four-bedder segment here.
Coming back to three-bedders though, we can see the healthy number of three-bedder transactions suggests this segment remains attractive to buyers. But whilst there’s support even for older leasehold condos, those who want gains should focus on newer segments first.
For more on newer versus older condo performances in various districts, follow us on Stacked Pro. If you’d like to get in touch for a more in-depth consultation, you can do so here.
Ryan J
A seasoned content strategist with over 17 years in the real estate and financial journalism sectors, Ryan has built a reputation for transforming complex industry jargon into accessible knowledge. With a track record of writing and editing for leading financial platforms and publications, Ryan's expertise has been recognised across various media outlets. His role as a former content editor for 99.co and a co-host for CNA 938's Open House programme underscores his commitment to providing valuable insights into the property market.Read next from Property Investment Insights
Property Investment Insights Which Condos Made the Biggest Profits in 2025? One Owner Earned $3.8M in Just 5 Years
Property Investment Insights Are Older One- and Two-Bedders in District 21 Holding Up Against the New Launches? We Break It Down
New Launch Condo Analysis Zyon Grand Pricing Review: How It Compares To Nearby Resale And New Launches In River Valley
Property Investment Insights Are Older Three- and Four-Bedders in District 10 Holding Up Against the New Launches? We Break It Down
Latest Posts
Property Market Commentary Why Singapore Homes Feel So Unaffordable (Even If Incomes Have Risen)
Editor's Pick Why Older Freehold Condos Are Struggling to Go En-Bloc in 2025
Property Advice Most New Condo Buyers in Singapore Forget to Check This Before Buying (Until It’s Too Late)
Singapore Property News Why This Rare New Queenstown Condo Nearly Sold Out Even At $2,800 Psf
On The Market Surprisingly Affordable 5 bedroom Condos You Can Buy Right Now Under $2.3 Million
Landed Home Tours I Toured A Rare Freehold Landed Street Where $5M Still Gets You A Proper Family Home
Singapore Property News When ‘Fringe’ Homes Cross $2,000 PSF, Has Singapore’s Idea of ‘Prime’ Changed for Good?
On The Market Four Rare Penthouses Overlooking Jurong Lake Gardens On The Market From $4.38m – Each With Over 2,000 Sqft Of Space
Editor's Pick Singapore’s First W Hotel–Branded Condo Launches From $3,230 PSF in Marina Bay: Here’s What You Need To Know
On The Market The Cheapest 4-Room HDB Flats in Central Singapore You Can Still Buy Under $520K
Editor's Pick Zyon Grand Condo Review: Integrated Condo With Direct MRT Access From $2,689 Psf
BTO Reviews October 2025 BTO Launch Review: Ultimate Guide To Choosing The Best Unit
On The Market 5 Rare HDB Flats Above 1,700 Sq ft You Can Buy Right Now In 2025
Editor's Pick A Holland Village New Launch Just Sold 98.8% Of Its Units In One Weekend — Here’s Why Everyone Rushed In
Landed Home Tours We Toured A Landed Street Near One Of Singapore’s Most Sought-After Schools — Where A Home Last Sold For $32 Million