Are Older One- and Two-Bedders in District 21 Holding Up Against the New Launches? We Break It Down

Get The Property Insights Serious Buyers Read First: Join 50,000+ readers who rely on our weekly breakdowns of Singapore’s property market.

A seasoned content strategist with over 17 years in the real estate and financial journalism sectors, Ryan has built a reputation for transforming complex industry jargon into accessible knowledge. With a track record of writing and editing for leading financial platforms and publications, Ryan's expertise has been recognised across various media outlets. His role as a former content editor for 99.co and a co-host for CNA 938's Open House programme underscores his commitment to providing valuable insights into the property market.
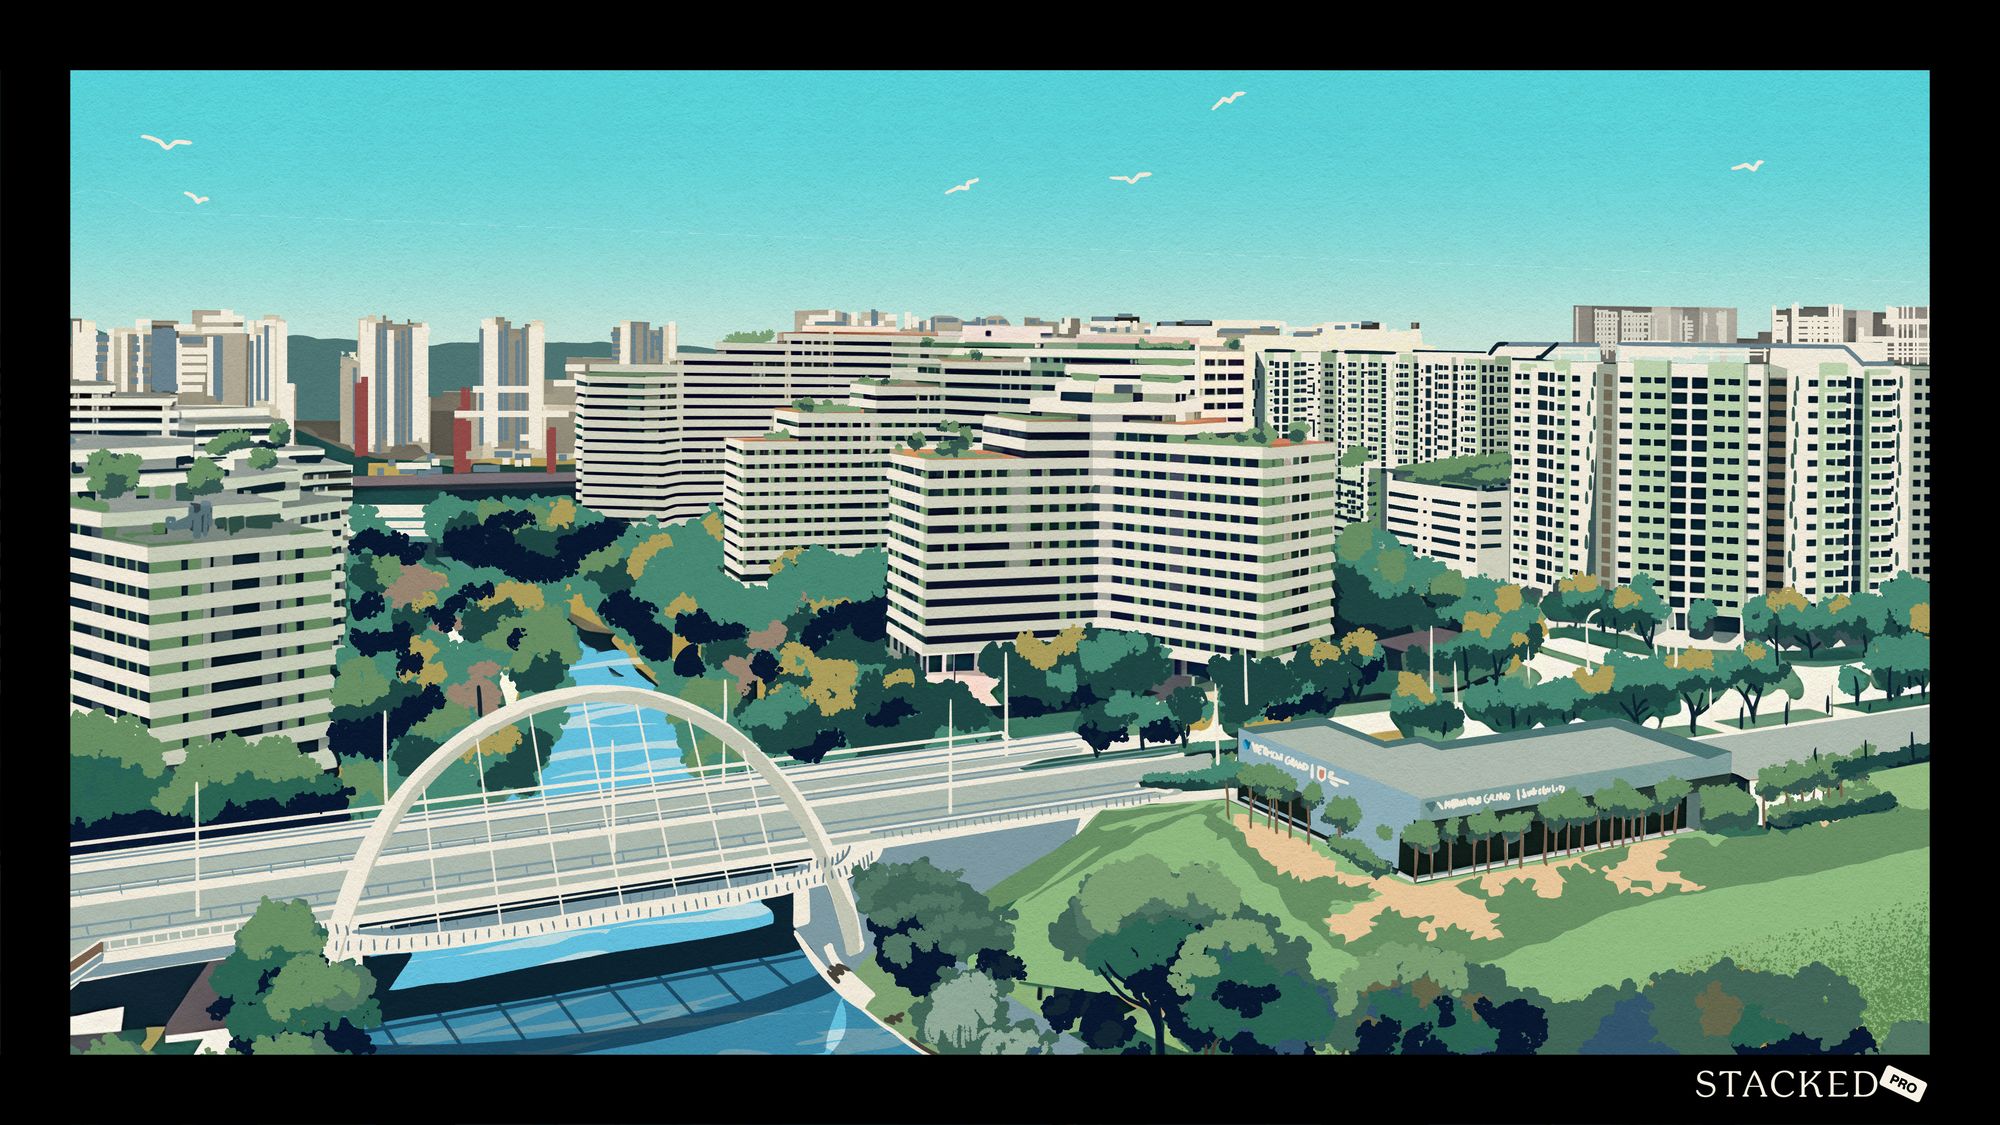
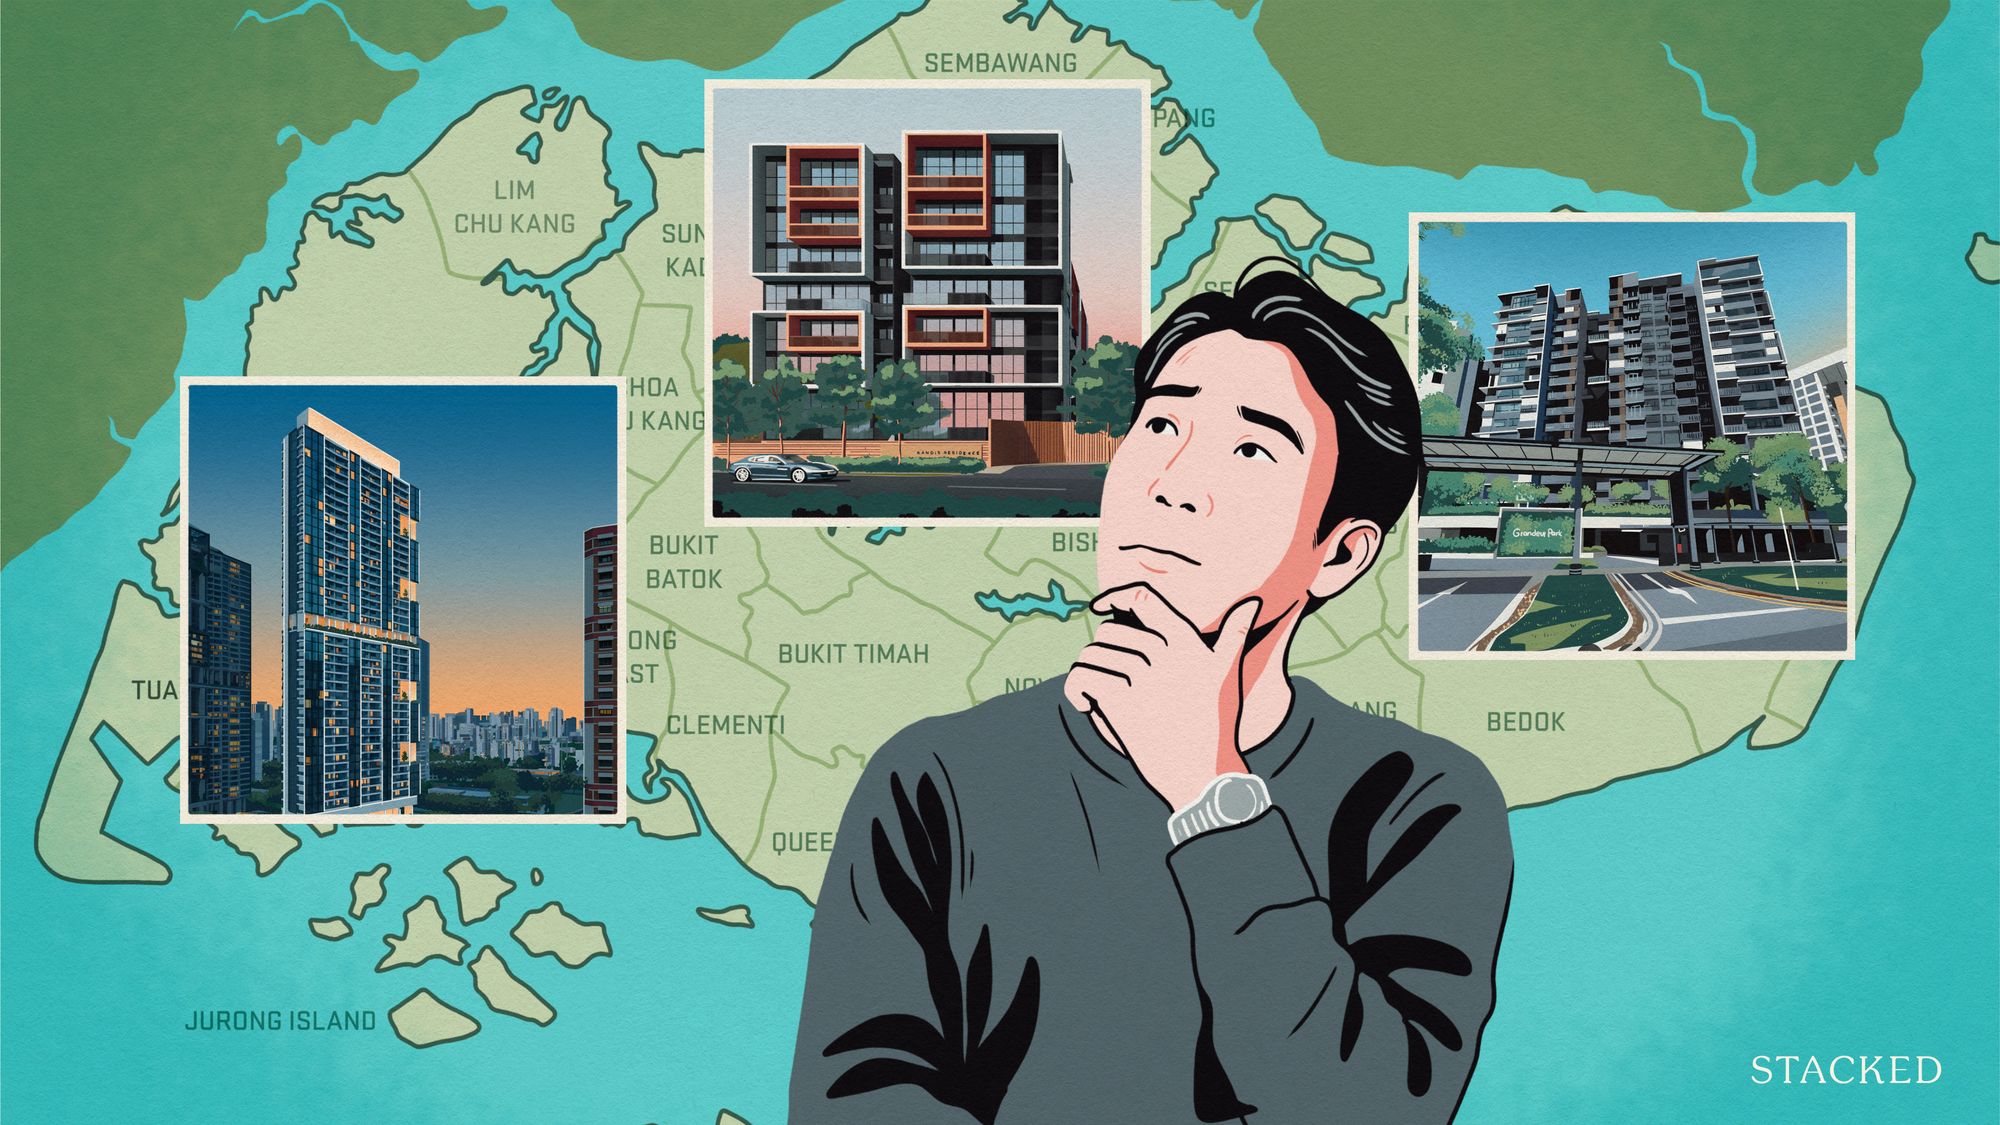
District 21 (D21) covers Upper Bukit Timah, Clementi Park, and Ulu Pandan, and it’s one of the most varied districts. D21 is really not easy to categorise because it has the full range of landed housing, boutique condos, some larger mass-market condos, etc. If there’s one thing they all have in common, it’s a good amount of green space and family-oriented amenities.
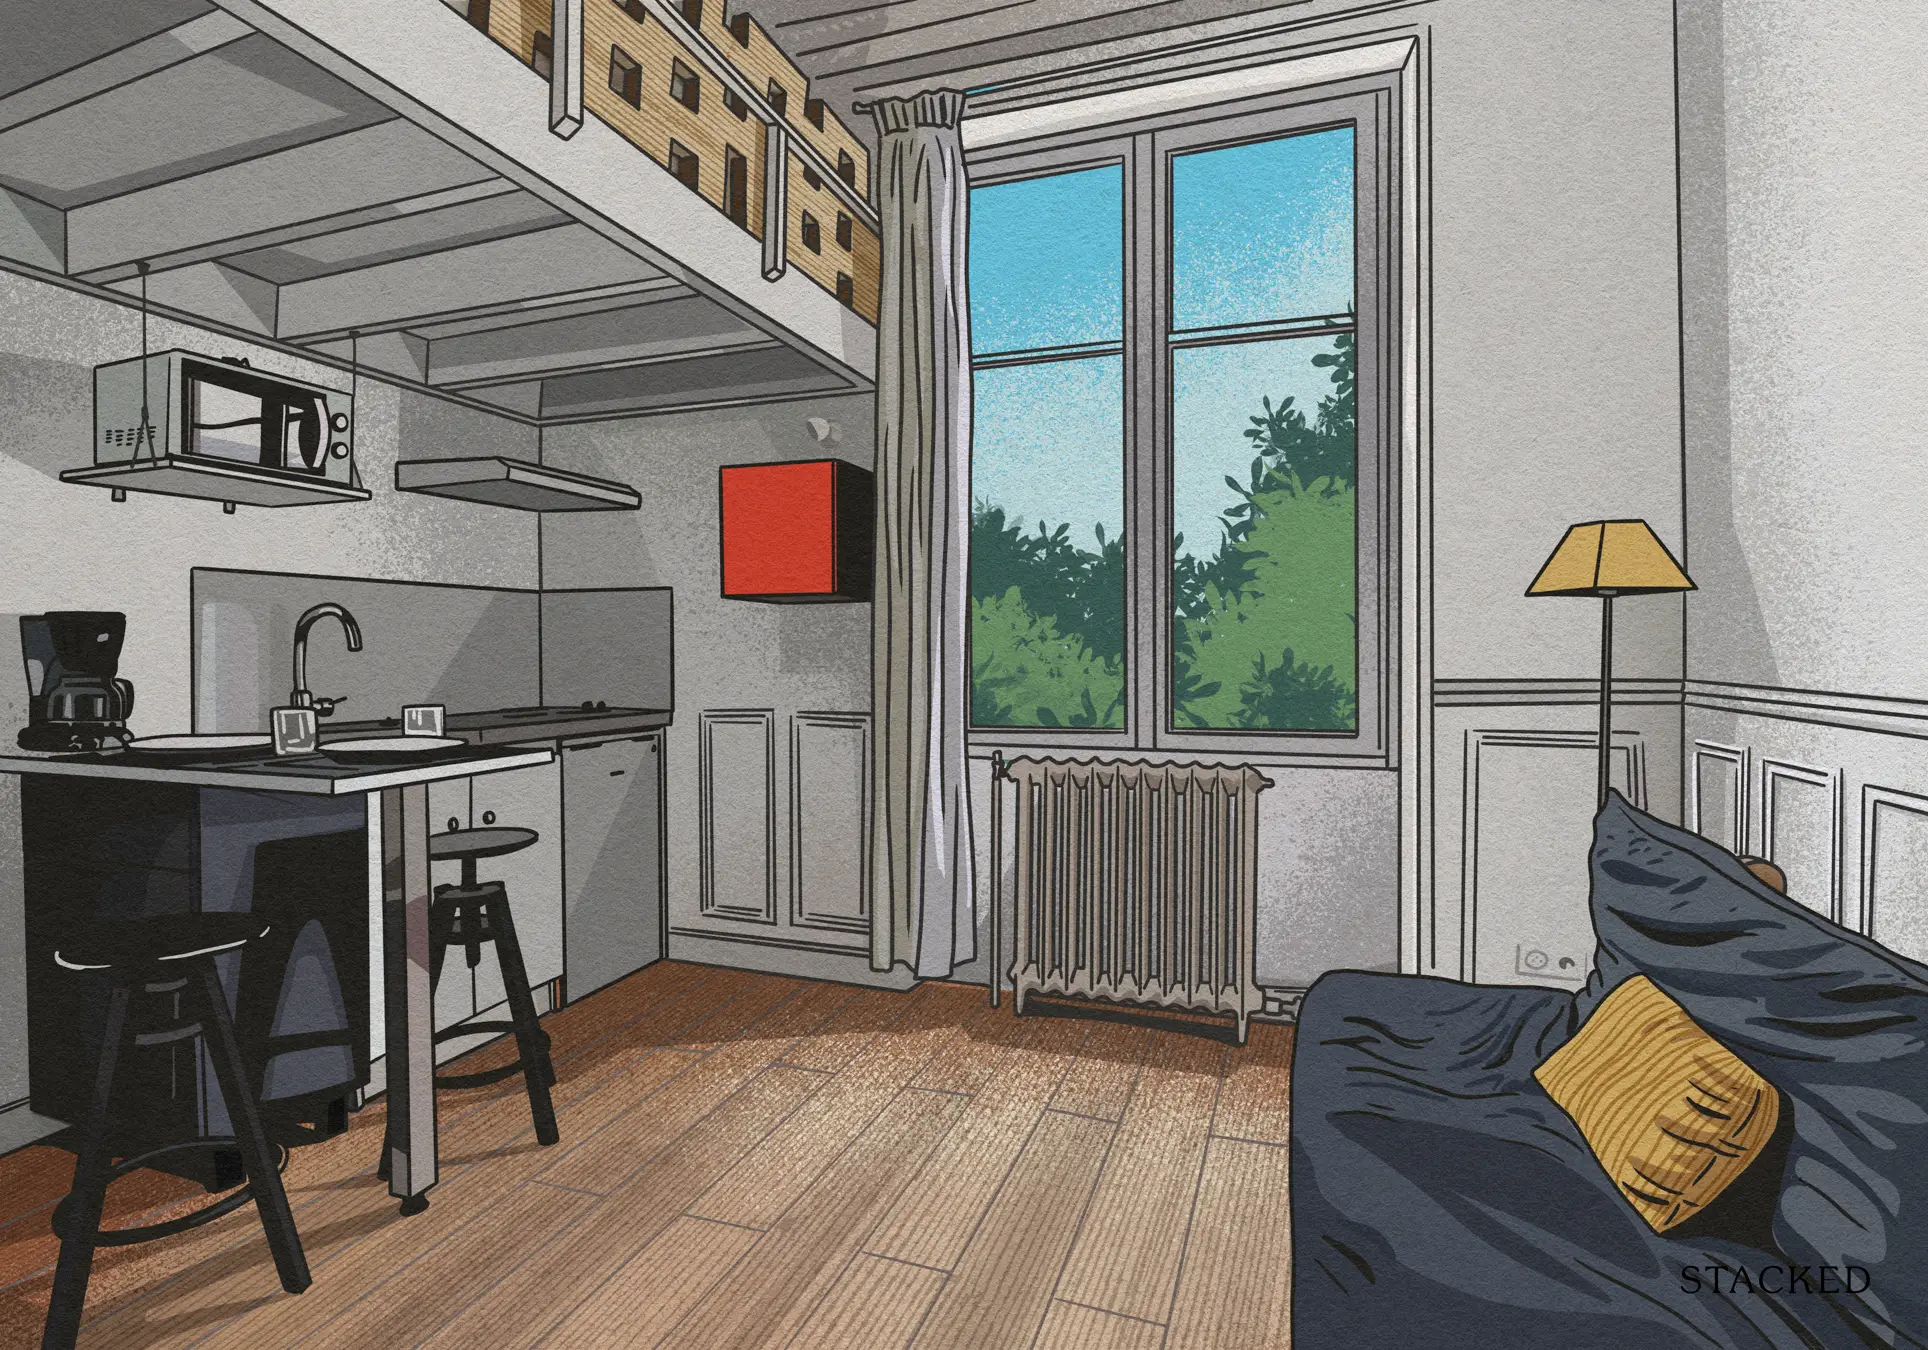
For one- and two-bedders, D21 tends to draw a mix of investors and younger buyers. Investors are attracted by the rental potential from nearby educational institutions, while homeowners are drawn to the lower entry price compared to CCR districts, with a similar lifestyle setting.
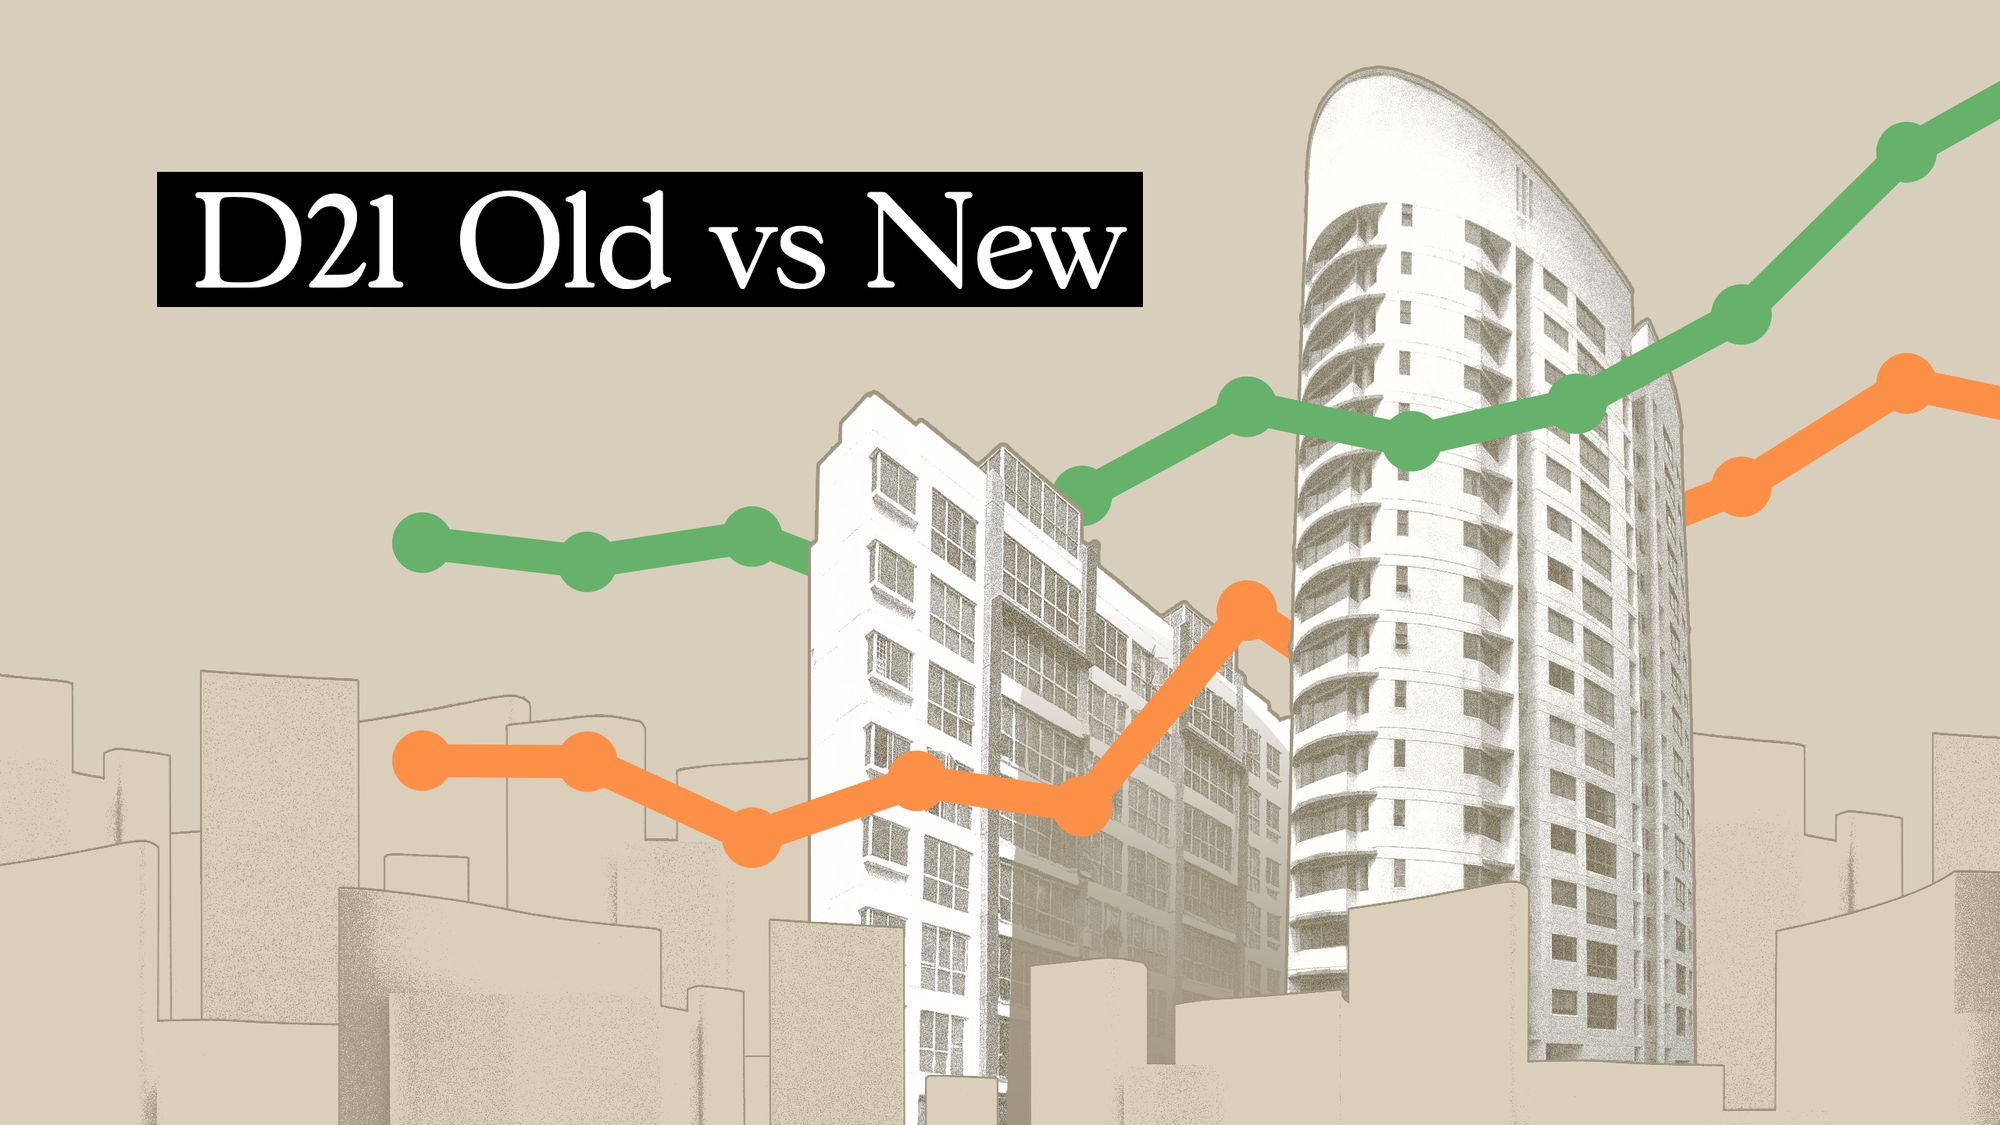
The big question, however, is whether newer or older projects here are falling behind with age. In this article, we’ll break down the performance of older versus newer one- and two-bedders in D21 over the past decade, to help inform your buying or selling decisions.
To start, we’re focusing only on 99-year leasehold condos, as this is where the effects of lease decay are most significant. For this analysis, “new” refers to condo projects that are 20 years old or younger, while “old” refers to those beyond the 20-year mark.
We use 20 years as the dividing line for two reasons. First, it aligns with how long most condo projects tend to last; and most condos that go en bloc are between 19 and 24 years of age. Second, it’s consistent with how the market itself views ageing projects, as condos above 20 years are conventionally regarded as “older” by buyers.
For newer condos, we’ll include projects with leases starting from 1994 to 2014. For older condos, we’ll look at those with leases starting from 1993 and earlier. This ensures we’re tracking the same pool of projects over time.
Finally, we’ll use only subsale and resale transactions to avoid distortions caused by developer discounts.
First, let’s look at how condo projects have fared in D21 overall
Let’s start by looking at the overall performance of non-landed private properties in D21 (resale)
Year | D21 | All non-landed private properties |
2014 | $1,145 | $1,215 |
2015 | $1,084 | $1,197 |
2016 | $1,062 | $1,248 |
2017 | $1,109 | $1,293 |
2018 | $1,229 | $1,323 |
2019 | $1,278 | $1,346 |
2020 | $1,263 | $1,280 |
2021 | $1,351 | $1,354 |
2022 | $1,499 | $1,473 |
2023 | $1,677 | $1,595 |
2024 | $1,768 | $1,681 |
Annualised | 4.44% | 3.30% |

Over the past decade, resale condos in D21 appreciated at 4.44 per cent, which is noticeably higher than the islandwide average of 3.30 per cent.
But since our focus is on how age affects property performance, it makes sense to narrow this further.
So we’ll zoom in on the 99-year leasehold condos in D21, where age and lease length play a more direct role in determining value. Let’s see how these leasehold condos have performed over the past 10 years.
Year | D21 | All non-landed private properties |
2014 | $959 | $1,066 |
2015 | $955 | $1,051 |
2016 | $904 | $1,140 |
2017 | $918 | $1,123 |
2018 | $1,047 | $1,164 |
2019 | $1,114 | $1,189 |
2020 | $1,044 | $1,159 |
2021 | $1,129 | $1,227 |
2022 | $1,273 | $1,370 |
2023 | $1,629 | $1,516 |
2024 | $1,653 | $1,616 |
Annualised | 5.60% | 4.25% |

Leasehold projects here saw an annualised growth rate of 5.60 per cent, which is comfortably above the islandwide average of 4.25 per cent; so D21 leasehold projects are a strong performer in general.
For completeness, let’s also take a look at how 999-year and freehold projects in D21 have performed over the same period.
Year | D21 | All non-landed private properties |
2014 | $1,202 | $1,385 |
2015 | $1,132 | $1,366 |
2016 | $1,122 | $1,393 |
2017 | $1,154 | $1,461 |
2018 | $1,278 | $1,524 |
2019 | $1,327 | $1,572 |
2020 | $1,334 | $1,488 |
2021 | $1,446 | $1,586 |
2022 | $1,590 | $1,709 |
2023 | $1,726 | $1,799 |
2024 | $1,847 | $1,855 |
Annualised | 4.38% | 2.97% |

Just like the leasehold segment, 999-year/freehold projects in D21 have also managed to beat the overall market. Prices appreciated at an annualised 4.38 per cent versus 2.97 per cent islandwide.
However, our focus is on leasehold, as this is where age/lease decay can be expected to show the most tangible effects. So now let’s look at how newer versus older projects have performed in D21:
Year | New | Old | Difference |
2014 | $1,061 | $846 | $214 |
2015 | $1,042 | $845 | $197 |
2016 | $1,067 | $770 | $297 |
2017 | $1,004 | $826 | $178 |
2018 | $1,107 | $801 | $306 |
2019 | $1,195 | $994 | $202 |
2020 | $1,161 | $884 | $277 |
2021 | $1,198 | $1,052 | $145 |
2022 | $1,286 | $1,116 | $170 |
2023 | $1,446 | $1,218 | $228 |
2024 | $1,537 | $1,184 | $353 |
Annualised | 3.78% | 3.41% |

The difference is very small. Newer leasehold projects in D21 have recorded an annualised growth rate of 3.78 per cent, compared to 3.41 per cent for older developments; most investors would consider this negligible.
That said, $PSF figures alone don’t always tell the full story.
To get a clearer picture, let’s take a look at the average quantum (total price) transacted for new versus old projects in D21.
Year | New | Old | Difference |
2014 | $1,252,702 | $1,349,182 | -$96,480 |
2015 | $1,195,667 | $1,220,929 | -$25,262 |
2016 | $1,314,886 | $1,185,213 | $129,673 |
2017 | $1,207,224 | $1,191,071 | $16,152 |
2018 | $1,341,116 | $1,348,094 | -$6,978 |
2019 | $1,384,351 | $1,442,680 | -$58,329 |
2020 | $1,381,095 | $1,426,688 | -$45,592 |
2021 | $1,484,715 | $1,494,455 | -$9,740 |
2022 | $1,559,760 | $1,739,707 | -$179,947 |
2023 | $1,736,144 | $1,713,086 | $23,057 |
2024 | $1,854,666 | $1,718,285 | $136,381 |
% increase from 2014 to 2024 | 48.05% | 27.36% |

Looking at the total quantum, the picture shifts slightly. At first, older properties tended to have a higher quantum; but by 2024, we can see the trend reversed, with newer projects overtaking them.
Overall, newer developments saw a price increase of about 48 per cent over the 10-year period, compared to 27 per cent for older ones.
To see why this might be happening, let’s look at specific unit types, starting with one-bedders.
1-bedroom units
Average $PSF
Year | New | Old | Difference |
2014 | |||
2015 | $662 | ||
2016 | $776 | ||
2017 | $817 | $779 | $38 |
2018 | $873 | $800 | $73 |
2019 | $1,160 | $712 | $448 |
2020 | |||
2021 | $1,042 | $1,092 | -$50 |
2022 | $1,177 | ||
2023 | $1,378 | $1,049 | $330 |
2024 | |||
Annualised (2017 – 2023) | 9.10% | 5.08% |

Because there were no transactions in certain years, we will look at the period from 2017 to 2023.
We see that newer one-bedders recorded an annualised growth rate of 9.10 per cent, compared to 5.08 per cent for older units. In most years, new projects commanded a higher $PSF than their older counterparts, and it has generally widened over time.
So far, this suggests that buyers of smaller units are more sensitive to age: newer one-bedders in D21 appear to do better.
But we can’t always get the full picture from $PSF alone, so let’s look at the actual quantum:
More from Stacked
Can A New Integrated Project Raise The Value Of Your Condo? The Surprising Results Near Sengkang Grand Residences
Can Living Near an Integrated Development Raise Your Condo’s Value?
Average price
Year | New | Old | Difference |
2014 | |||
2015 | $520,000 | ||
2016 | $610,000 | ||
2017 | $800,000 | $634,333 | $165,667 |
2018 | $855,000 | $662,800 | $192,200 |
2019 | $1,000,000 | $590,000 | $410,000 |
2020 | |||
2021 | $785,000 | $691,667 | $93,333 |
2022 | $950,000 | ||
2023 | $1,350,000 | $824,000 | $526,000 |
2024 | |||
% increase from 2017 to 2023 | 68.75% | 29.90% |

This is broadly similar to what we saw with $PSF.
From 2017 to 2023, newer one-bedders rose from about $800,000 to $1.35 million – a 68.8 per cent increase. In the same period, older one-bedders went from around $634,000 to $824,000, or about 29.9 per cent growth.
So in terms of quantum as well, the gap between new and old one-bedders has widened sharply. New projects command a higher $PSF as well as higher overall prices.
Let’s see if square footage is a factor in all of this
Average size (based on units transacted)
Year | New | Old |
2014 | ||
2015 | 786 | |
2016 | 786 | |
2017 | 980 | 815 |
2018 | 980 | 829 |
2019 | 883 | 829 |
2020 | ||
2021 | 753 | 664 |
2022 | 807 | |
2023 | 980 | 786 |
2024 |

Newer one-bedders in D21 actually appear to have larger average sizes than older ones.
But a strong caveat to be clear here is the very limited transaction history to go by for one-bedder condos; if anything, we wouldn’t read too much into the data for this at this point.
This is the total number of transactions we looked at:
Year | New | Old |
2014 | ||
2015 | 1 | |
2016 | 1 | |
2017 | 1 | 3 |
2018 | 3 | 1 |
2019 | 2 | 1 |
2020 | ||
2021 | 1 | 3 |
2022 | 1 | |
2023 | 1 | 2 |
2024 |
Unfortunately, this is not ideal. With so few one-bedroom transactions in D21, our figures should be taken with a pinch of salt.
Now let’s look into the specific one-bedder projects involved:
New
Project | Average $PSF | Average price | Average size | No. of units sold | Lease start year |
SOUTHAVEN I | $1,378 | $1,350,000 | 980 | 1 | 1994 |
Old
Project | Average $PSF | Average price | Average size | No. of units sold | Lease start year |
SHERWOOD TOWER | $1,049 | $824,000 | 786 | 2 | 1976 |
We can see that one of the clear reasons for Southaven – the newer project – costing more is simply down to its larger size. But let’s look at transactions over the past decade:
Year | SOUTHAVEN I | SHERWOOD TOWER |
2014 | ||
2015 | $662 | |
2016 | $776 | |
2017 | $817 | $779 |
2018 | $873 | $800 |
2019 | $919 | $712 |
2020 | ||
2021 | $874 | |
2022 | ||
2023 | $1,378 | $1,049 |
2024 | ||
Annualised (2017 to 2023) | 9.10% | 5.08% |
From 2017 to 2023, Southaven I one-bedders appreciated at an annualised 9.10 per cent, compared to 5.08 per cent for Sherwood Tower.
That said, the limited number of transactions means the sample size is too thin to draw sweeping conclusions. The only takeaway is that newer one-bedders, like those at Southaven I have shown stronger growth; and this can’t be considered representative, as the transactions are specific to these two projects.
We would normally want to look at rental yields as well, as they could reflect investor demand; but as there have been rental transactions in Sherwood Tower over the past year, we can’t compare yields.
Perhaps the two-bedroom units will be more revealing:
2-bedroom units
Average $PSF
Year | New | Old | Difference |
2014 | $1,127 | $992 | $135 |
2015 | $1,120 | $1,046 | $74 |
2016 | $1,169 | $979 | $190 |
2017 | $1,050 | $1,009 | $41 |
2018 | $1,074 | $822 | $252 |
2019 | $1,215 | $1,151 | $64 |
2020 | $1,332 | $909 | $423 |
2021 | $1,214 | $1,151 | $63 |
2022 | $1,445 | $1,130 | $315 |
2023 | $1,498 | $1,351 | $147 |
2024 | $1,567 | $1,471 | $96 |
Annualised | 3.35% | 4.01% |

Over the past decade, older two-bedders in D21 outpaced newer ones, with an annualised growth rate of 4.01 per cent versus 3.35 per cent. This is quite unusual, as newer projects generally have the advantage when it comes to appreciation.
Over the years, the $PSF gap between old and new two-bedders has narrowed. While newer projects still tend to command a higher $PSF, we can see that by 2024, the gap stood at just $96 psf: much closer than earlier peaks.
This points to strong resilience in the older two-bedders, which continue to defy lease decay.
Now let’s examine the same units in terms of average quantum:
Average price
Year | New | Old | Difference |
2014 | $1,062,500 | $1,099,333 | -$36,833 |
2015 | $1,043,727 | $1,037,500 | $6,227 |
2016 | $1,096,857 | $988,000 | $108,857 |
2017 | $995,389 | $1,013,250 | -$17,861 |
2018 | $1,058,468 | $1,619,444 | -$560,976 |
2019 | $1,165,750 | $1,192,000 | -$26,250 |
2020 | $1,244,286 | $1,258,000 | -$13,714 |
2021 | $1,153,313 | $1,299,288 | -$145,975 |
2022 | $1,364,000 | $1,387,429 | -$23,429 |
2023 | $1,426,667 | $1,446,429 | -$19,762 |
2024 | $1,513,741 | $1,522,407 | -$8,667 |
% increase from 2014 to 2024 | 42.47% | 38.48% |

Over the past decade, the price gap between new and old two-bedders has narrowed, but older units still cost slightly more on average: as of 2024, older two-bedders averaged about $1.52 million, compared to $1.51 million for newer ones.
Gains-wise, newer two-bedders rose by about 42.5 per cent, while older ones climbed by 38.5 per cent. So while the percentage gain was higher for newer projects, the older two-bedders are still more expensive in absolute price.
Let’s see if this is a matter of spaciousness:
Average size (based on units transacted)
Year | New | Old |
2014 | 955 | 1112 |
2015 | 939 | 1012 |
2016 | 946 | 1029 |
2017 | 961 | 1015 |
2018 | 998 | 1970 |
2019 | 972 | 1036 |
2020 | 941 | 1427 |
2021 | 960 | 1165 |
2022 | 947 | 1263 |
2023 | 969 | 1080 |
2024 | 975 | 1053 |

The data shows that older two-bedders in D21 are notably larger than their newer counterparts. Even in years where the gap narrowed, older units still averaged at least 70 to 100 sq ft more.
This size premium is why older two-bedders have consistently higher average prices, despite lower $PSF. This may explain the resilience of older leasehold condos, as they provide more space.
Here are the total number of transactions we looked at:
Year | New | Old |
2014 | 8 | 3 |
2015 | 11 | 6 |
2016 | 7 | 5 |
2017 | 10 | 8 |
2018 | 19 | 2 |
2019 | 8 | 4 |
2020 | 7 | 5 |
2021 | 16 | 17 |
2022 | 7 | 7 |
2023 | 6 | 7 |
2024 | 12 | 12 |
Now let’s look a the specific projects for these transactions
New
Project | Average $PSF | Average price | Average size | No. of units sold | Lease start year |
LE WOOD | $1,164 | $1,290,000 | 1109 | 1 | 1999 |
HIGH OAK CONDOMINIUM | $1,372 | $1,379,444 | 1007 | 2 | 1996 |
THE RAINTREE | $1,459 | $1,470,750 | 1009 | 4 | 2003 |
GARDENVISTA | $1,811 | $1,646,600 | 908 | 5 | 1999 |
Old
Project | Average $PSF | Average price | Average size | No. of units sold | Lease start year |
PINE GROVE | $1,105 | $1,462,500 | 1324 | 2 | 1984 |
ASTOR GREEN | $1,397 | $1,503,750 | 1077 | 4 | 1991 |
CAVENDISH PARK | $1,642 | $1,554,815 | 947 | 6 | 1991 |
Among the newer projects, Le Wood and High Oak Condominium bring down the overall average: both transacted at lower prices than Pine Grove, which happens to be the most affordable of the older developments.
The key difference is size: Pine Grove units are much larger at around 1,324 sq ft on average, which naturally pushes up their overall quantum.
At the same time, Cavendish Park, an older condo, posted one of the highest average $PSF among all the projects, second only to the newer Gardenvista. This shows that not all older developments lag behind newer ones; some can still achieve very competitive $PSF levels.
Overall, while older two-bedders in D21 cost more on average, it’s clear that this is influenced by the mix of projects involved.
Some newer developments are priced lower due to smaller sizes or less premium positioning, while certain older projects continue to punch above their weight in both $PSF and quantum.
With that in mind, let’s examine how these individual projects have performed over the past 10 years, the newer ones in bold for easier comparison.
Year | LE WOOD | HIGH OAK CONDOMINIUM | THE RAINTREE | GARDENVISTA | PINE GROVE | ASTOR GREEN | CAVENDISH PARK |
2014 | $922 | $1,328 | $826 | $1,076 | |||
2015 | $866 | $1,106 | $1,236 | $725 | $980 | $1,143 | |
2016 | $876 | $1,107 | $1,240 | $771 | $1,117 | ||
2017 | $852 | $1,140 | $1,181 | $809 | $1,032 | $1,085 | |
2018 | $809 | $902 | $1,075 | $1,203 | |||
2019 | $955 | $977 | $1,133 | $1,381 | $1,141 | $1,183 | |
2020 | $1,075 | $1,375 | $861 | $938 | $1,117 | ||
2021 | $834 | $1,102 | $1,244 | $1,428 | $1,013 | $1,213 | $1,300 |
2022 | $1,239 | $1,504 | $1,037 | $1,383 | |||
2023 | $1,327 | $1,754 | $1,099 | $1,401 | $1,350 | ||
2024 | $1,164 | $1,372 | $1,459 | $1,811 | $1,105 | $1,397 | $1,642 |
Annualised | 4.05% | 3.16% | 2.95% | 2.65% |
Since there are no transactions in certain years, we’ll focus only on those with transactions in both 2014 and 2024.
From this comparison, the newer two-bedders have generally outperformed the older ones over the decade. While there are notable variations based on size (see above), the market does show some aversion to lease decay.
That said, pricing alone doesn’t tell the full story. To round out the picture, let’s also consider rental performance.
Project | Average price in 2024 | Average monthly rent (June 2024 – June 2025) | Rental yield |
CAVENDISH PARK | $1,554,815 | $3,869 | 2.99% |
GARDENVISTA | $1,646,600 | $4,219 | 3.07% |
ASTOR GREEN | $1,503,750 | $3,950 | 3.15% |
HIGH OAK CONDOMINIUM | $1,379,444 | $3,750 | 3.26% |
LE WOOD | $1,290,000 | $3,550 | 3.30% |
THE RAINTREE | $1,470,750 | $4,079 | 3.33% |
Newer two-bedders generated higher rental yields than the older ones, but this is predictable because the older ones are larger and tend to be pricier. Gross yield is (rental income / total price), so a higher quantum unit will suppress yields.
That said, when we compare certain developments with broadly similar average prices, the newer projects show an edge. For example, The Raintree versus Astor Green.
The Raintree commands a higher monthly rent despite being in the same price band as Astor Green, suggesting that rental demand can tilt toward newer developments. This is also not entirely surprising, as many newer units also tend to have newer renovations in the unit, newer facilities, etc.
Conclusion
For one-bedders, the data is unfortunately a bit limited; but from what we do see, newer projects have pulled ahead. That’s not only in $PSF but also in overall prices, with the gap widening over time.
For two-bedders, however, older projects still hold their ground. While newer developments showed higher percentage gains over the decade, older units remain more expensive on average. Nonetheless, the resistance to lease decay shows it’s not easy to go wrong with a D21 condo; even if you happen to pick an older leasehold one.
On the rental front, yields skew higher for newer two-bedders, but this is mostly a function of lower quantum rather than stronger rentability.
Overall, it’s fair to say that smaller units in D21 lean toward newer projects, even though older ones retain their values surprisingly well. So pick new if you can, but don’t be too worried about age, even for the leasehold units.
In part two, we’ll be looking at the performance of three- and four-bedders in D21, units that are preferred by family units rather than investors. Let’s see if there’s a strong reaction to lease decay when more buyers are owner-occupiers rather than investors.
If you’d like to get in touch for a more in-depth consultation, you can do so here.
Ryan J
A seasoned content strategist with over 17 years in the real estate and financial journalism sectors, Ryan has built a reputation for transforming complex industry jargon into accessible knowledge. With a track record of writing and editing for leading financial platforms and publications, Ryan's expertise has been recognised across various media outlets. His role as a former content editor for 99.co and a co-host for CNA 938's Open House programme underscores his commitment to providing valuable insights into the property market.Read next from Property Investment Insights

New Launch Condo Analysis Zyon Grand Pricing Review: How It Compares To Nearby Resale And New Launches In River Valley

Property Investment Insights Are Older Three- and Four-Bedders in District 10 Holding Up Against the New Launches? We Break It Down

New Launch Condo Analysis Penrith Pricing Review: How It Compares To Nearby Resale And New Launches

Property Investment Insights Faber Residence Pricing Review: How It Compares To Nearby Resale And New Launches
Latest Posts

Property Advice Most New Condo Buyers in Singapore Forget to Check This Before Buying (Until It’s Too Late)

Singapore Property News Why This Rare New Queenstown Condo Nearly Sold Out Even At $2,800 Psf

On The Market Surprisingly Affordable 5 bedroom Condos You Can Buy Right Now Under $2.3 Million

Landed Home Tours I Toured A Rare Freehold Landed Street Where $5M Still Gets You A Proper Family Home

Singapore Property News When ‘Fringe’ Homes Cross $2,000 PSF, Has Singapore’s Idea of ‘Prime’ Changed for Good?

On The Market Four Rare Penthouses Overlooking Jurong Lake Gardens On The Market From $4.38m – Each With Over 2,000 Sqft Of Space

New Launch Condo Analysis Singapore’s First W Hotel–Branded Condo Launches From $3,230 PSF in Marina Bay: Here’s What You Need To Know

On The Market The Cheapest 4-Room HDB Flats in Central Singapore You Can Still Buy Under $520K

New Launch Condo Reviews Zyon Grand Condo Review: Integrated Condo With Direct MRT Access From $2,689 Psf

BTO Reviews October 2025 BTO Launch Review: Ultimate Guide To Choosing The Best Unit

On The Market 5 Rare HDB Flats Above 1,700 Sq ft You Can Buy Right Now In 2025

Editor's Pick A Holland Village New Launch Just Sold 98.8% Of Its Units In One Weekend — Here’s Why Everyone Rushed In

Landed Home Tours We Toured A Landed Street Near One Of Singapore’s Most Sought-After Schools — Where A Home Last Sold For $32 Million

Singapore Property News Why Old Run-Down Malls Make Neighbourhoods Better In Singapore

Editor's Pick Where Singaporeans Can Still Buy A City Apartment For $184,000 — And Earn 5% Rental Yield. But Should You?
